


 Abstract
 HTML
HTML Reference
 Related
 PDF
PDF


-
Numerous astrophysical and cosmological observations have revealed that dark matter (DM) constitutes ~25% of the energy of the Universe. Although the nature of DM is still a mystery, the DM particles are expected to annihilate or decay to standard model particles, such as gamma rays, neutrinos, and anti-matter particles. Among these, the cosmic-ray (CR) electrons and positrons at high energies play an important role in investigating the properties of DM.
The DArk Matter Particle Explorer (DAMPE) [1] collaboration has reported the total
$ e^++e^- $ spectrum from$ 25 $ GeV to$ 4.6 $ TeV with high energy resolution. The spectrum shows a break at$ \sim 0.9 $ TeV and a tentative peak structure at$ \sim 1.4 $ TeV [2]. Since high energy$ e^\pm $ with energies of$ \sim {\rm TeV}$ are unable to travel a long distance in the Milky Way due to the strong cooling effect induced by synchrotron radiation and inverse Compton scatting, the high energy$ e^++e^- $ spectrum is crucial for revealing the properties of the nearby sources. The spectral softening above$ \sim 0.9 $ TeV is consistent with the measurements from the ground based Cherenkov telescopes [3–5], and may be caused by the maximum acceleration limits of astrophysical sources, or the failure of the conventional assumption of continuous source distribution [6, 7].On the other hand, the tentative peak structure at
$ \sim 1.4 $ TeV is a challenge for astrophysics. Numerous works have studied the peak [7–27], and a monochromatic injection of$ e^\pm $ is a favored hypothesis to account for such a sharp structure. However, an astrophysical source cannot easily generate such a monochromatic distribution. Furthermore, the required astrophysical source should be very young and close enough to Earth so that the cooling effect is not significant.A promising interpretation of the
$ \sim 1.4 $ TeV peak is the nearby clump of annihilating dark matter (DM). The N-body simulations of cold and collisionless DM reveal that there is a large number of subhalos in the Galaxy [28–31]. The DM subhalos have been used to explain the boost factor required by the positron excess observed by previous experiments. Although the contributions from the Galactic DM subhalos, according to a distribution provided by the detailed N-body simulations, may not be significant [32], the contribution from a massive nearby subhalo could be large enough to explain the positron excess [33, 34].As mentioned above, in order to explain the sharp
$ \sim 1.4 $ TeV peak observed by DAMPE, the required subhalo should be large and close enough to Earth. Many studies assumed a typical subhalo with a mass of$ \sim 10^{7} - 10^{8} M_{\odot} $ and a distance of$ \sim 0.1-0.3 $ kpc. In this work, we present a study of the properties of a subhalo that account for the peak, such as the mass and distance from Earth, the mass and DM annihilation cross section in the subhalo, for different concentration models. We also compare the spectra of gamma-ray sources in 3FGL [35] with that from DM annihilation in the subhalo, so as to find candidates having comparable spectra. The probability of the nearby subhalo is discussed as well.This paper is organized as follows. In Sec. 2, we describe the propagation of CR
$ e^\pm $ and the injection of the subhalo. In Sec. 3, we discuss the properties of the DM subhalo that accounts for the DAMPE$ \sim1.4 $ TeV spectral peak. Finally, we give the conclusion and discussion in Sec. 4. -
The Cosmic Ray (CR) particles propagate diffusively in the magnetic field of the Galaxy after having been emitted from the source. For CR
$ e^\pm $ around a$ \,{\rm{TeV}} $ , such a propagation is accompanied with energy loss, and thus described by the propagation equation$ \frac{\partial\psi}{\partial t} = \nabla\cdot(D_{xx}\nabla\psi) - \frac{\partial}{\partial E}\left( \frac{{\rm{d}}E}{{\rm{d}}t}\psi \right) + Q, $

(1) where
$ \psi({{r}}, E, t) $ is the number density of particles per unit energy,$ Q({{r}}, E, t) $ is the injection source,$ D_{xx}(E) $ is the spatial diffusion coefficient parametrized as$ D_{xx}(E) = $ $ D_0(E/E_{{\rm{ref}}})^\delta $ , and$ {\rm{d}}E/{\rm{d}}t $ is the electron cooling rate. We adopt the propagation parameters$ D_0 = 4.16\times 10^{28}\,{\rm{cm}}^2\,{\rm{s}}^{-1} $ ,$ E_{{\rm{ref}}} = 4\,{\rm{GV}} $ and$ \delta = 0.5 $ from Ref. [36], fitted by the latest Boron-to-Carbon ratio data from AMS-02.For the rate of energy loss, we adopt the approximation [37]
$ -\frac{{\rm{d}}E}{{\rm{d}}t}\equiv b(E) = b_0 + b_1\frac{E}{1\,{\rm{GeV}}} + b_2\left( \frac{E}{1\,{\rm{GeV}}} \right)^2, $

(2) where
$ b_0\approx 3\times 10^{-16}\,{\rm{GeV}}\,{\rm{s}}^{-1} $ ,$ b_1\approx 10^{-15}\,{\rm{GeV}}\,{\rm{s}}^{-1} $ , and$ b_2\approx 10^{-16}\,{\rm{GeV}}\,{\rm{s}}^{-1} $ .$ b_0 $ and$ b_1 $ represent the rate of energy loss induced by the ionization and bremsstrahlung processes in the neutral gas with a density of$ 1\,{\rm{cm}}^{-3} $ , respectively.$ b_2 $ represents the rate of energy loss induced by the synchrotron and inverse Compton scattering (ICS) processes. The total energy density of the magnetic field and interstellar radiation field is taken to be$ 1\,{\rm{eV}}\,{\rm{cm}}^{-3} $ . In the analysis, we only consider$ e^{\pm} $ above$ 1\,{\rm{TeV}} $ , thus the energy loss rate$ b(E) $ is dominated by the synchrotron and ICS term$ b_2(E/1\,{\rm{GeV}})^{2} $ . In this case, we are able to calculate the$ e^\pm $ flux from DM subhalo with the Green function method.The Green function of Eq. (1) can be derived as [38]
$ G({{r}},E\leftarrow{{r}}_s,E_s) = \frac{\theta(E_s-E)E^{-2}}{\pi^{3/2}b_2r_d^3(E, E_s)}\exp\left( -\frac{R^2}{r_d^2(E, E_s)} \right), $

(3) where
$ r_d(E, E_s)\equiv \sqrt{ \frac {4D_0 \cdot\left( (E/E_{\rm{ref}})^{\delta-1}-(E_s/E_{\rm{ref}})^{\delta-1}\right)}{b_2(1-\delta)}} $

(4) is the diffusion length, and
$ R = |{{r}}_s - {{r}}| $ is the distance between the source and the target point. With the Green function$ G $ , the$ e^\pm $ flux observed at Earth is$ \psi({{r}}_0, E_0) = \int {\rm{d}}^3{{r}}\,{\rm{d}}E\,G({{r}}_0, E_0\leftarrow{{r}}, E)\,Q({{r}},E), $

(5) where the injection source
$ Q({{r}}, E) = \dfrac{\rho^2({{r}})\langle \sigma v\rangle}{4m_\chi^2}\dfrac{{\rm{d}}N}{{\rm{d}}E}(E) $ derives from DM annihilation in the subhalo. The annihilation spectrum$ {\rm{d}}N/{\rm{d}}E $ is obtained by PPPC [39, 40].We take the Einasto [41] profile to model the DM distribution in the subhalo
$ \rho(r) = \rho_{s}\exp \left\{-\frac{2}{\alpha}\left[\left(\frac{r}{r_{s}}\right)^{\alpha}-1\right] \right\}, $

(6) where
$ \rho_s $ is the normalization,$ r_s $ is the scale radius, and the index α represents the logarithmic slope. In the analysis, the parameters$ \rho_s $ and$ r_s $ are determined by the virial mass and concentration. The logarithmic slope α is taken to be 0.130 or 0.174, which are the minimum and maximum values respectively in Ref. [42].The virial mass of the subhalo can be approximated as
$ M_{\rm vir} \approx \frac{4}{3} \pi \Delta \rho_c R_{\rm vir}^3, $

(7) where
$ R_{\rm vir} $ is the virial radius,$ \rho_c $ is the critical density of the Universe, and a common choice is to set$ \Delta = 200 $ . The mass can also be obtained by$ M_{\rm vir} = \int_{0}^{R_{\rm vir}} 4 \pi r^2 \rho(r) {\rm d} r. $

(8) The relation between
$ R_{\rm vir} $ and$ r_s $ can be described by the concentration, which reads$ C_{\rm vir} = \frac{R_{\rm vir}}{r_s}, $

(9) where
$ C_{\rm vir} $ is the concentration.We use the concentration model from the simulation of the five-year results of WMAP with the relaxed samples [43] to describe the relation between
$ M_{\rm vir} $ and$ C_{\rm vir} $ . The median concentration from the best-fit is given by$ \log C_{\rm vir}^{\rm med} = 0.971 - 0.094 \log (M_{\rm vir}/[10^{12}h^{-1}M_{\odot}]). $

(10) We also use the same power law to parameterize the upper and lower limits of the concentration according to the
$ 2\sigma $ interval shown in Ref. [43]$ \log C_{\rm vir}^{\rm max} = 1.175 - 0.114 \log (M_{\rm vir}/[10^{12}h^{-1}M_{\odot}]),$

(11) $ \log C_{\rm vir}^{\rm min} = 0.712 - 0.087 \log (M_{\rm vir}/[10^{12}h^{-1}M_{\odot}]). $

(12) For a given slope α of the DM profile, we use these three concentration models to derive the relation between
$ \rho_s $ and$ r_s $ , and then obtain the$ e^\pm $ injection from DM annihilation in the subhalo. -
In this section, we use the remnants of DM annihilation in the subhalo to fit the DAMPE spectral peak. Considering the sharp shape of the spectral peak, we assume that DM particles directly annihilate into
$ e^+e^- $ . Since both the mass of the subhalo and its distance from Earth can influence the observed$ e^++e^- $ spectrum, we also discuss their correlation in this case.We perform a fit of the DAMPE
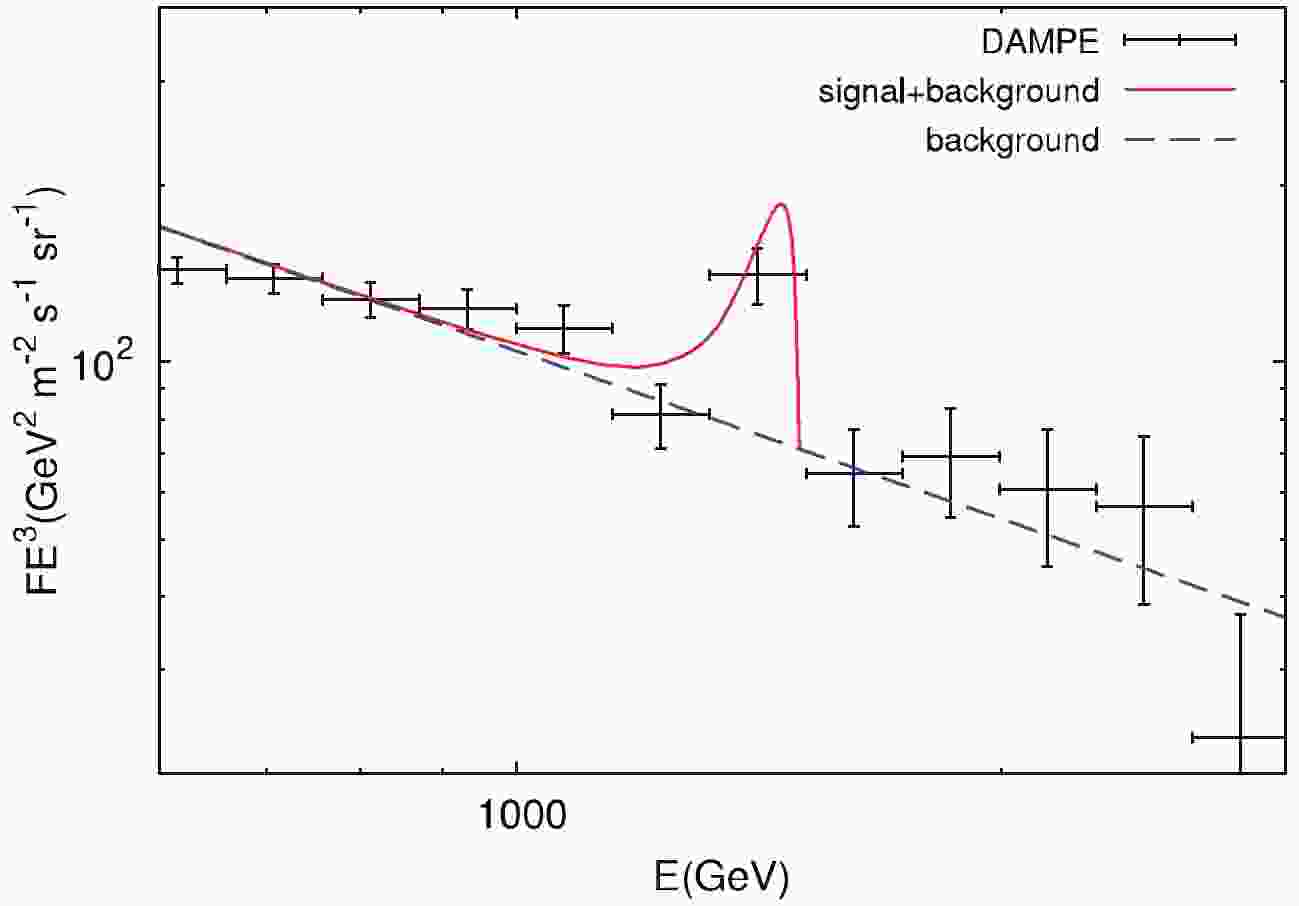
$ e^++e^- $ spectrum above$ \sim0.6 $ TeV. The background flux of CR electrons around$ \,{\rm{TeV}} $ is dominated by one or several nearby SNRs [6, 44], and its spectrum above$ 0.9\,{\rm{TeV}} $ can be parametrized by a power-law. For the given slope α, distance of the subhalo d and DM annihilation cross section$ \left\langle \sigma v \right\rangle $ , we can obtain the required viral mass of the subhalo from the fit using the concentration models. We show a best-fit spectrum for the maximum concentration model$ C_{\rm vir}^{\rm max} $ in Fig. 1, where α, d and$ \left\langle \sigma v \right\rangle $ have the typical values$ 0.13 $ , 0.3 kpc and$ 3 \times 10^{-26} \,{\rm{cm}}^{3}\,{\rm{s}}^{-1} $ , respectively.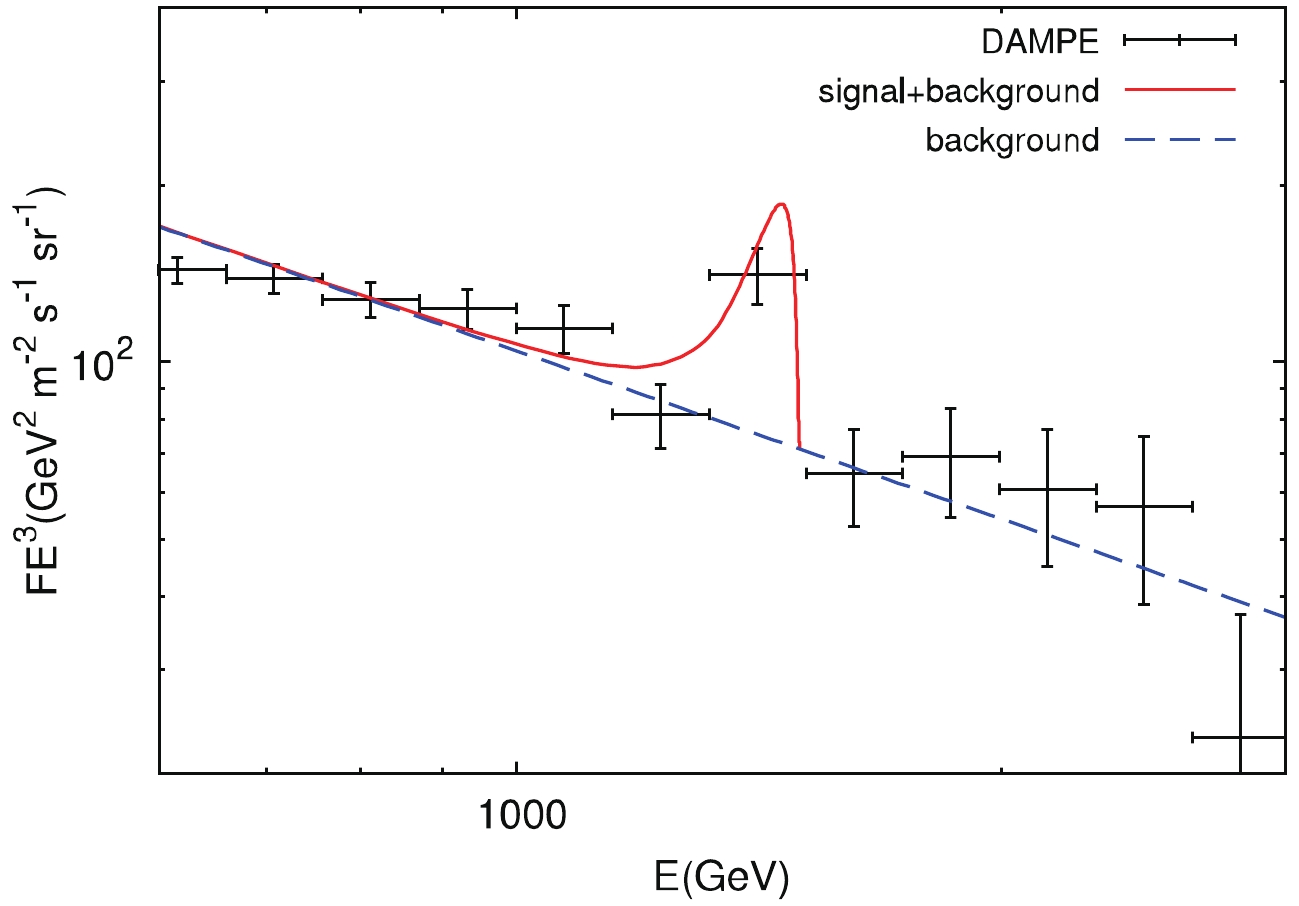
Figure 1. (color online) Fit of the DAMPE
$e^++e^-$ spectrum using the contribution of DM annihilation in a subhalo for the maximum concentration model. The DM annihilation final states are assumed to be$e^+e^-$ . The values of α, d and$\left\langle \sigma v \right\rangle$ are 0.13, 0.3 kpc and 3×10⁻²⁶cm3s−1, respectively.We fit the DAMPE spectrum above
$ \sim $ TeV for the subhalo at different distances, and obtain the best-fit viral mass of the subhalo$ M_{\rm vir} $ for three concentration models. The results for the two values of the DM profile slope,$ \alpha = 0.130 $ and$ \alpha = 0.174 $ , are shown in Fig. 2. The DM annihilation cross section is taken as$ 3 \times 10^{-26} \,{\rm{cm}}^{3}\,{\rm{s}}^{-1} $ . For a given distance, the required subhalo mass for$ C_{\rm vir}^{\rm max} $ is less than for$ C_{\rm vir}^{\rm med} $ by$ \sim 1 $ order of magnitude, and less than for$ C_{\rm vir}^{\rm min} $ by$ \sim 2 $ orders of magnitude. We can see that if the minimum concentration model$ C_{\rm vir}^{\rm min} $ is adopted, the required subhalo mass would be$ \sim 10^{10} M_{\odot} $ . This value is disfavored because it is close to the maximum subhalo mass in a halo of the size of the Milky Way [29].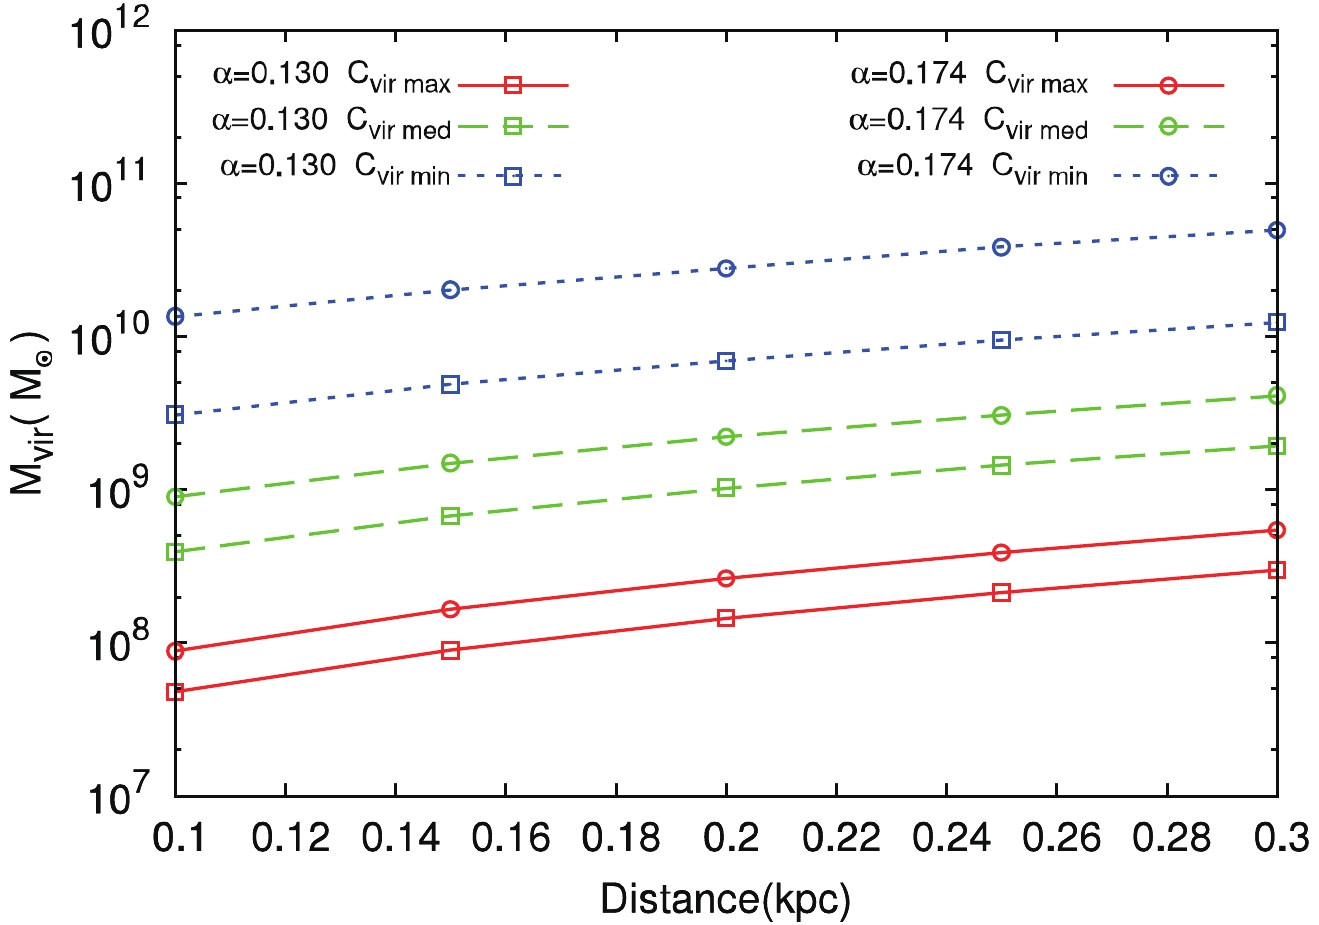
Figure 2. (color online) Relation between the distance and the virial mass of the DM subhalo that accounts for the spectral peak. The three line types represent the three concentration models:
$C_{\rm vir}^{\rm max}$ (red solid lines),$C_{\rm vir}^{\rm med}$ (green dashed lines), and$C_{\rm vir}^{\rm min}$ (blue dotted lines). The lines with square and round points are for the logarithmic slope$\alpha = 0.130$ and$\alpha = 0.174$ , respectively.The
$ e^++e^- $ spectrum from DM annihilation in the subhalo is affected by the DM annihilation cross section, which is often set to a typical value of$ 3 \times 10^{-26} \,{\rm{cm}}^{3}\,{\rm{s}}^{-1} $ . However, we tried different values of the DM annihilation cross section in this study. In Fig. 3, we show the relation between$ M_{\rm vir} $ and$ \left\langle \sigma v \right\rangle $ for three concentration models. Here, we consider two typical distances of the subhalo,$ d = 0.3 $ kpc and 0.1 kpc, that are often used in literature to interpret the DAMPE result. From Fig. 3 , we can see that for a given distance and DM annihilation cross section, the maximum concentration model$ C_{\rm vir}^{\rm max} $ and the minimum slope α lead to the smallest subhalo mass required for the spectral peak at$ \sim 1.4 $ TeV.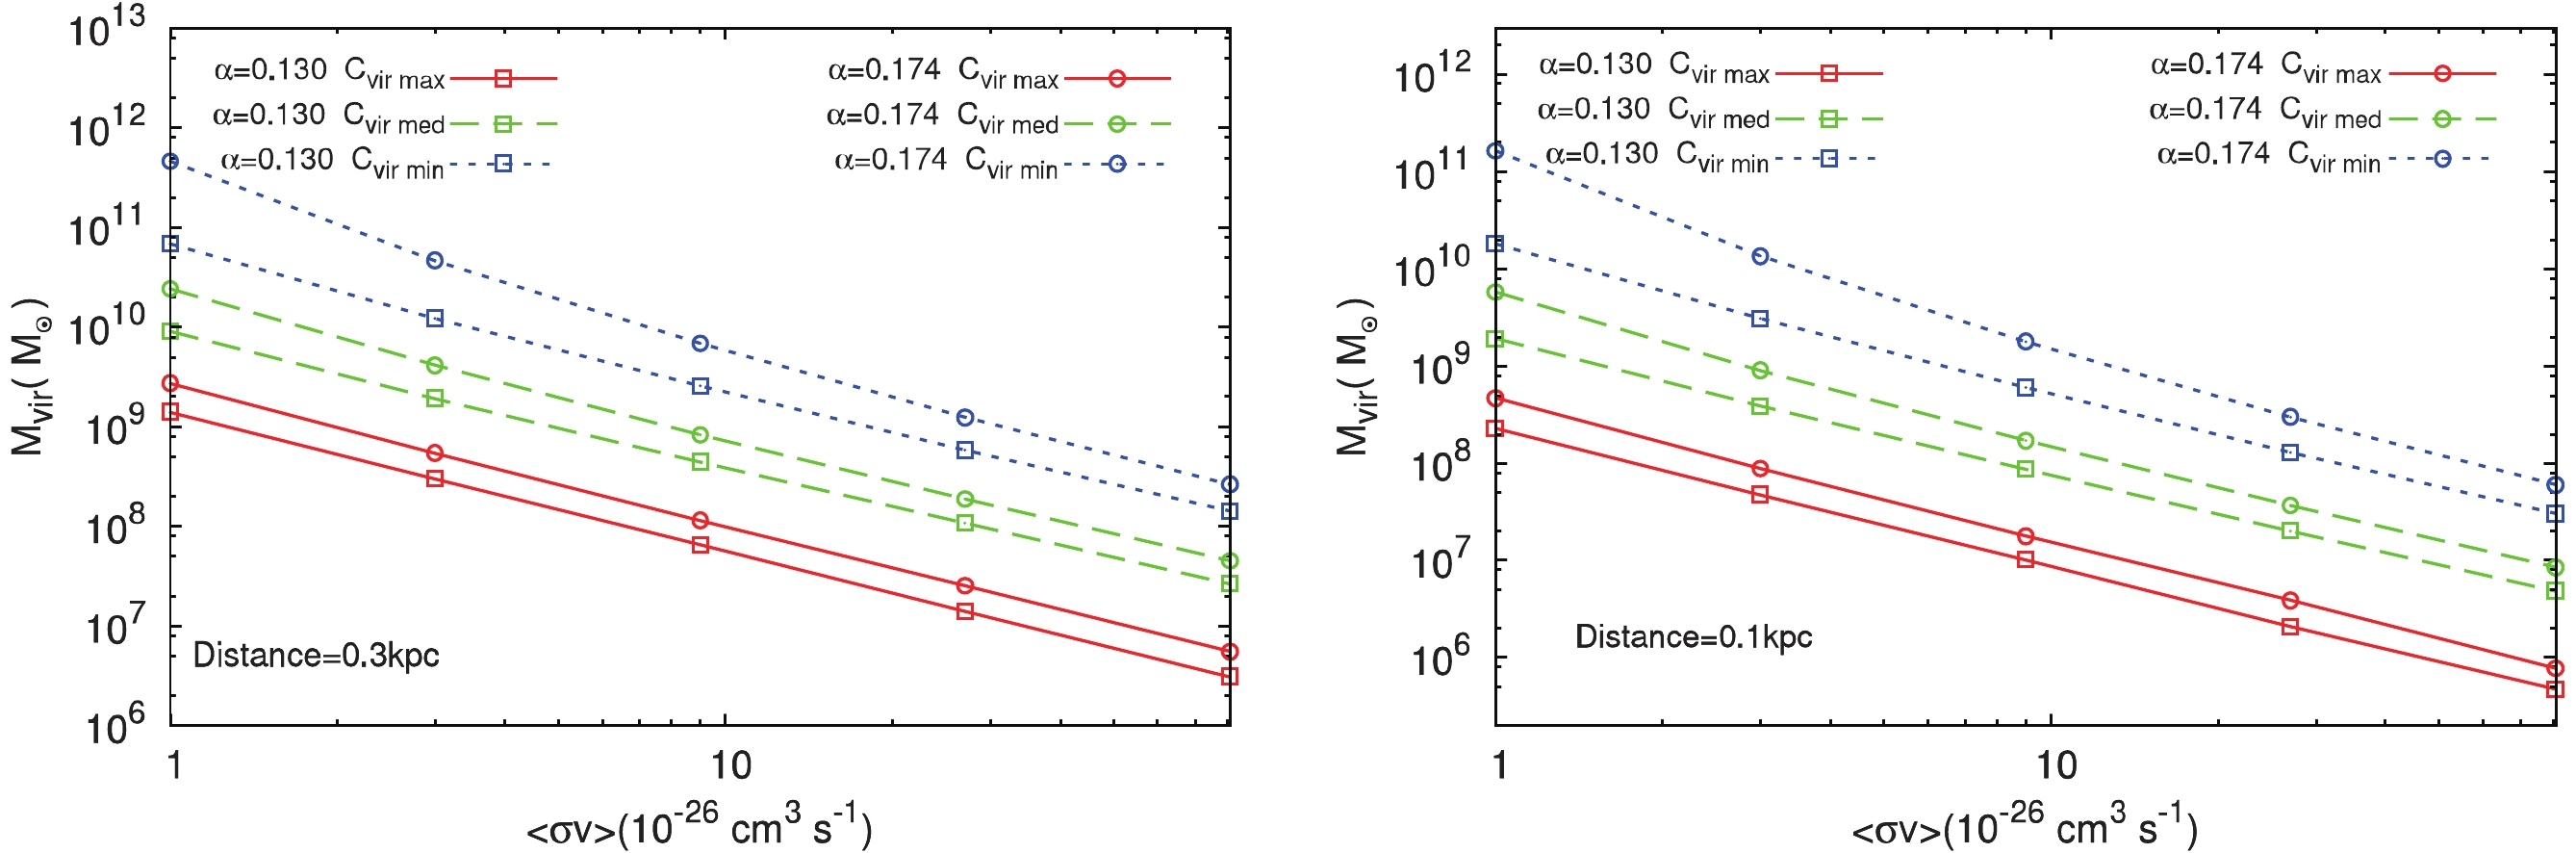
Figure 3. (color online) Similar to Fig. 2, but for the relation between the DM annihilation cross section and the subhalo viral mass, assuming the subhalo to be at 0.3 kpc (left) and 0.1 kpc (right).
-
The DM annihilation processes leading to the
$ e^\pm $ final states can also produce photons via the final state radiation or the cascade decay. The gamma-ray flux from the subhalo is given by$ \phi(E) = \frac{\left\langle \sigma v\right\rangle}{8\pi m_{\rm DM}^2} \frac{{\rm d}N_\gamma}{{\rm d}E_\gamma} J , $

(13) where the factor J is the line-of-sight integral of the DM distribution, i.e.
$ J = \int \int \rho^{2}{\rm d} l {\rm d}\Omega $ .We consider the gamma-ray flux from the final state radiation of the DM annihilation into
$ e^+e^- $ , and find that a slight gamma-ray signature can be observed only for the maximum concentration model. For example, from 1 GeV to 100 GeV, the integral gamma-ray flux is$ \sim 10^{-10} \,{\rm{cm}}^{-2} \,{\rm{s}}^{-1} $ for$ C_{\rm vir}^{\rm max} $ . Smaller distance and larger annihilation cross section lead to a larger gamma-ray flux. Even so, the concentration models$ C_{\rm vir}^{\rm med} $ and$ C_{\rm vir}^{\rm min} $ can hardly produce detectable gamma-ray signatures, compared with$ C_{\rm vir}^{\rm max} $ .We have tried to find a gamma-ray source which may be a candidate for the subhalo that accounts for the spectral peak. The Fermi-LAT collaboration has reported 1010 unassociated gamma-ray sources in 3FGL [35]. Among these, we find that 713 sources have an integral flux of
$ \sim \mathcal{O}(10^{-10}) \,{\rm{cm}}^{-2} \,{\rm{s}}^{-1} $ , but only a few have comparable spectral indices with the spectrum from DM annihilation. Comparing with the differential gamma-ray spectra from DM annihilation, we find that the following 10 candidates in the Fermi-LAT 3FGL have comparable spectra: J1250.2-0233, J2209.8-0450, J1549.9-3044, J2300.0+4053, J2142.6-2029, J2321.6-1619, J1155.3-1112, J2053.9+2922, J2145.5+ 1007, and J2224.4+0351. The spectra of these 10 sources, shown as dashed lines in Fig. 4, have the spectral index of$ \sim 1-1.5 $ . In Fig. 4, we also show the gamma-ray spectra from DM annihilation in the subhalo with distances d = 0.1 and 0.3 kpc, and$ \alpha = 0.13 $ and$ \left\langle \sigma v \right\rangle = 3 \times 10^{-26} \,{\rm{cm}}^{3}\,{\rm{s}}^{-1} $ .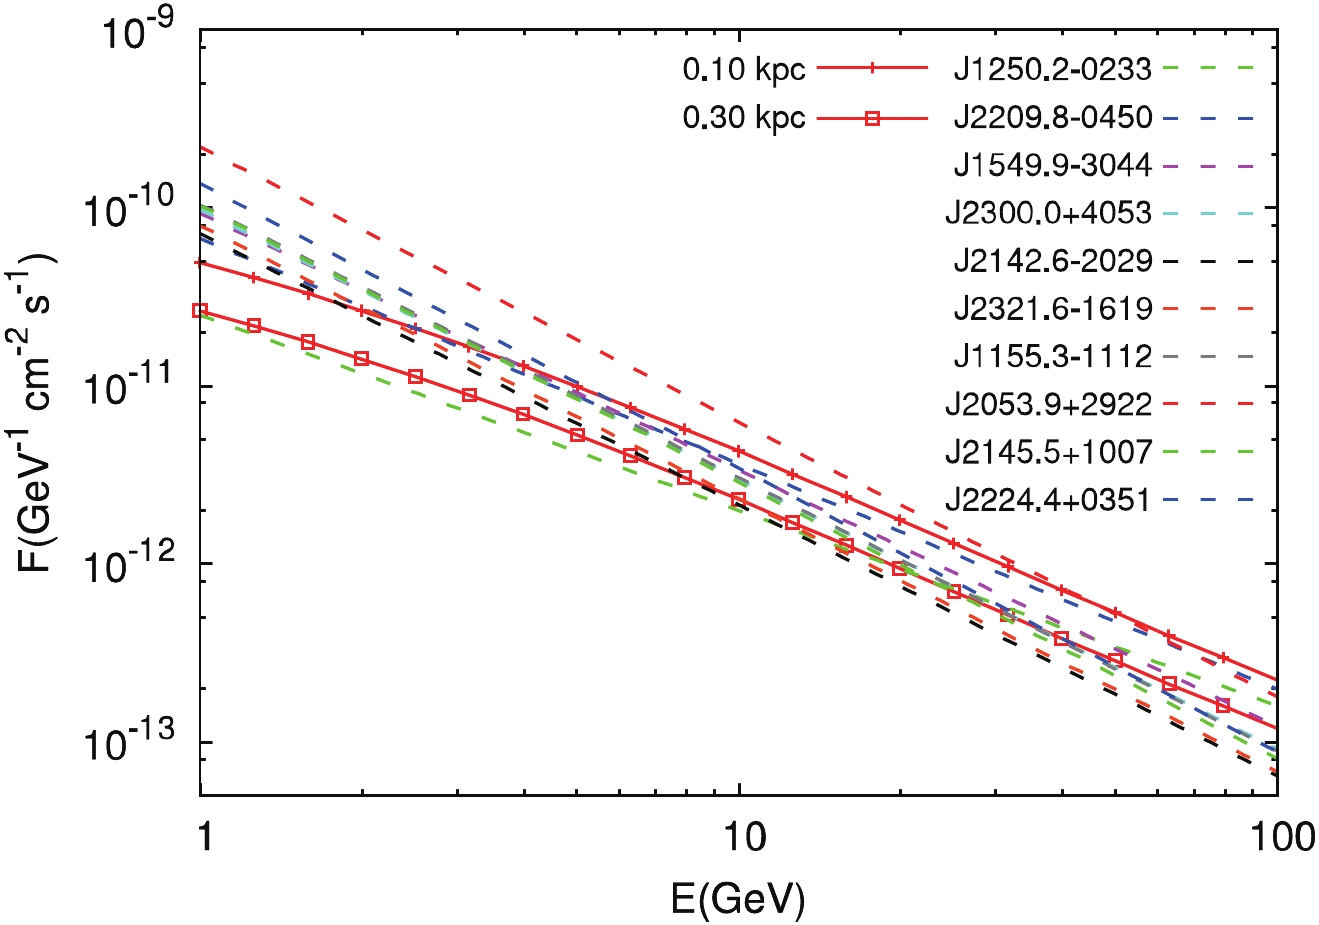
Figure 4. (color online) Gamma-ray spectra from DM annihilation in the subhalo with a distance of d = 0.1 (solid line) or 0.3 kpc (solid line with square points), and
$\alpha = 0.13$ ,$\left\langle \sigma v \right\rangle = 3 \times 10^{-26} \,{\rm{cm}}^{3}\,{\rm{s}}^{-1}$ . The ten dashed lines represent the comparable spectra of sources from 3FGL [35]. -
In this subsection, we discuss the probability that a large subhalo is close enough to Earth. In Ref. [45], the probability distributions have been provided for finding a subhalo with a given annihilation luminosity within a given distance from Earth. This result is inferred from the Via Lactea II simulations [30]. The annihilation luminosity of the subhalo is defined as
$ \mathcal{L} = \int\rho^2 {\rm d}V $ . We transform it into the viral mass of the subhalo for different concentration models, and show the probability as a function of$ M_{\rm vir} $ represented by red lines in Fig. 5.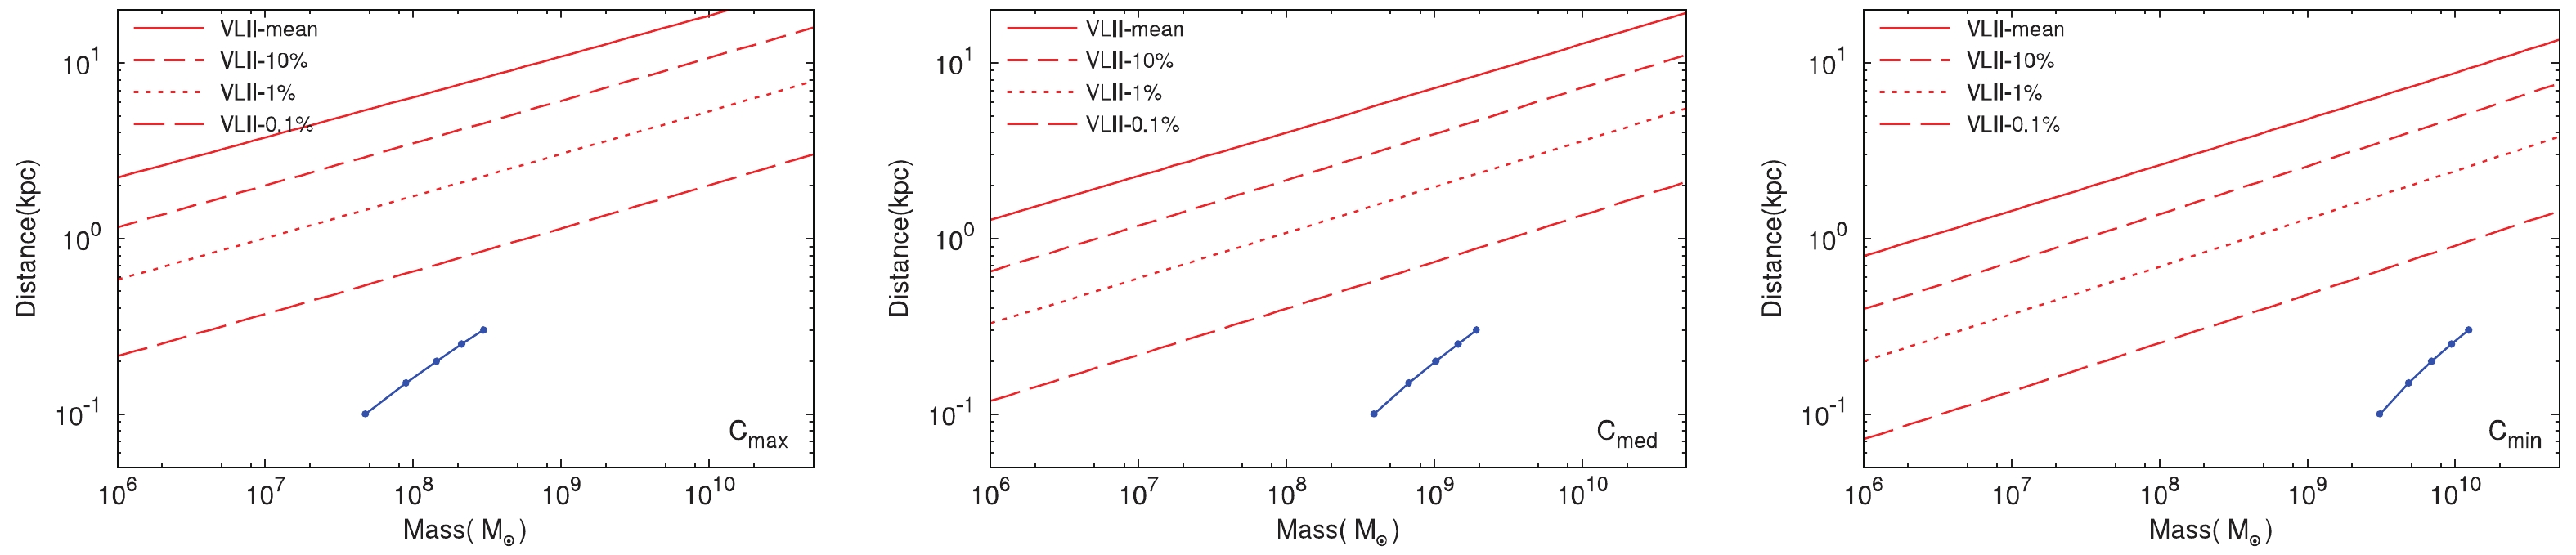
Figure 5. (color online) Probability distributions (red lines) of finding a subhalo within a distance from Earth, inferred from the VLII simulations [45], for maximum (left), median (center) and minimum (right) concentration models. The blue points represent the mass and distance of the subhalo that accounts for the spectral peak, with
$ \alpha = 0.13 $ and$ \left\langle \sigma v \right\rangle = 3 \times 10^{-26} \,{\rm{cm}}^{3}\,{\rm{s}}^{-1} $ .Considering the subhalo for
$ C_{\rm vir}^{\rm max} $ (left),$ C_{\rm vir}^{\rm med} $ (center), and$ C_{\rm vir}^{\rm min} $ (right) , the blue points in Fig. 5 represent the mass and distance of the subhalo that could account for the spectral peak. The density profile slope$ \alpha $ and DM annihilation cross section$ \left\langle \sigma v \right\rangle $ are$ 0.13 $ and$ 3 \times 10^{-26} \,{\rm{cm}}^{3}\,{\rm{s}}^{-1} $ , respectively. We can see that the subhalo with a smaller viral mass has a larger probability to be close enough to Earth. However, the probability of finding a candidate that accounts for the DAMPE result is less than 0.1%. -
The DAMPE
$ e^++e^- $ spectrum displays a tentative peak at$ \sim 1.4 $ TeV, which may be explained by a nearby$ e^\pm $ sources with a quasi-monochromatic injection spectrum. In this work, we assumed that a nearby DM subhalo is the source that accounts for the DAMPE spectral peak, and investigated the required mass and distance of the subhalo, and the required DM annihilation cross section into$ e^+e^- $ . For a certain distance from Earth, or a certain annihilation cross section, the required subhalo mass for the maximum concentration model and the minimum logarithmic slope of the Einasto profile has the smallest value$ \sim \mathcal{O}(10^{7}) M_\odot $ to account for the spectral peak structure.We also studied the gamma-ray flux generated from the corresponding subhalo, and found that only the maximum concentration model could lead to a potentially detectable signature. We have tried to find gamma-ray sources in 3FGL that could be the subhalo accounting for the spectral peak. On the basis of their gamma-ray spectra, there are only 10 sources with spectral index
$ \sim 1-1.5 $ that might be candidates.We found that the probability of finding such a large subhalo close enough to Earth is less than 0.1%. In the future, increasing the statistics of DAMPE observations and searching for nearby gamma-ray source are necessary to understand the nature of the spectral structure above TeV.
In this work, we only considered the DM annihilation channel to
$ e^+e^- $ , which induces a sharp spectrum after propagation. The annihilation channel to$ \mu^+\mu^- $ or$ \tau^+\tau^- $ cannot explain the observed spectral peak due to the soft initial spectrum. A mixed annihilation channel to all leptons can fit the data, but the contribution of the$ e^+e^- $ channel is dominant. Therefore, our results are not significantly changed in this case.Finally, we give a brief discussion of the decaying DM scenario. We found that a decaying DM with a mass of
$ \sim 3 $ TeV can explain the spectral peak. For the subhalo with the same mass as the annihilating DM scenario at 0.1 kpc and 0.3 kpc, assuming the concentration model$ C_{\rm vir}^{\rm max} $ and logarithmic slope$ \alpha = 0.13 $ , the required DM lifetimes are$ \sim 3.5\times 10^{27} $ s and$ \sim 5.5\times 10^{27} $ s, respectively. Note that the lifetime of decaying DM is constrained by the Fermi-LAT isotropic gamma-ray background measurement [46]. If we take the most stringent constraint$ \tau\sim10^{28} $ s in Ref. [47], the required subhalo mass would be increased by a factor of$ \mathcal{O}(1) $ . Consequently, the probability of finding such a subhalo would be reduced.
Nearby dark matter subhalo that accounts for the DAMPE excess
- Received Date: 2019-04-10
- Available Online: 2019-08-01
Abstract: The precise spectrum of electrons and positrons at high energies plays an important role in understanding their origin. DArk Matter Particle Explorer has reported their first measurement of the


 DownLoad: