


 Abstract
 HTML
HTML Reference
 Related
 PDF
PDF


-
Being the most massive elementary particle in the Standard Model (SM), the top quark is generally considered to be an excellent probe for New Physics (NP) Beyond the SM (BSM) [1]. In particular, its Flavour Changing Neutral Current (FCNC) interactions are forbidden in the SM at tree-level and are strongly suppressed at loop-level by the Glashow-Iliopoulos-Maiani (GIM) mechanism [2, 3]. For instance, the Branching Ratios (BRs) of
$ t\to qZ $ ($ q = u,c $ ) are predicted to be at the level of$ 10^{-14} $ in the SM [4], which is notably out of range of the current Large Hadron Collider (LHC) sensitivities. In contrast, several NP scenarios predict the maximum values for$ {\rm{BR}}(t\to qZ) $ $ (q = u,c) $ to be at the level of$ 10^{-7}-10^{-4} $ , such as the quark-singlet model [5], the 2-Higgs Doublet Model (2HDM) with or without flavor conservation [6], the Minimal Supersymmetric Standard Model (MSSM) [7], the MSSM with R-parity violation [8], models with warped extra dimensions [9], or extended mirror fermion models [10]. Thus, searches for such FCNC processes are critical because they would be considered as a clear signal for BSM physics [11].Using data collected at the center-of-mass (c.m.) energy of 13 TeV, the latest experimental limits on the top quark FCNC
$ {\rm{BR}}(t\to qZ) $ were established by the CMS and ATLAS collaborations from Run 2 data [12, 13]. The 95% Confidence Level (CL) upper limits are summarised in Table 1. As a more promising prospect, it is also worth mentioning here the scope of the approved High-Luminosity LHC (HL-LHC), which is expected to reach the level of 4 to$ 5\times 10^{-5} $ with an integrated luminosity$ L_{\rm{int}} $ = 3 ab$ ^{-1} $ at$ \sqrt{s} = 14 $ TeV, using a full simulation of the upgraded ATLAS detector, in which the three charged lepton (trilepton) final state of top quark pair events is considered, i.e.,$ pp\to t\bar{t}\to bW^+qZ\to b\ell \nu q \ell \ell $ , where$ \ell = e,\mu $ [14].Table 1. Current experimental upper limits on BR
$ (t \rightarrow qZ) $ at 95% CL.At present, there is no experimental evidence of such top quark FCNC anomalous couplings. One can, however, improve these limits or indeed make discoveries at future higher luminosity and/or higher energy hadron colliders [15], such as the aforementioned HL-LHC and/or the proposed High-Energy LHC (HE-LHC), with 27 TeV of c.m. energy and 15 ab
$ ^{-1} $ of integrated luminosity [16] as well as the Future Circular Collider in hadron-hadron mode (FCC-hh), with 100 TeV of c.m. energy and 30 ab$ ^{-1} $ of integrated luminosity [17].The aim of this study was to investigate the limits on the discussed
$ tqZ $ anomalous couplings that can be placed at these future hadron colliders using a trilepton signature. In fact, in addition to the latter being generated via$ t\bar{t} $ production followed by the FCNC$ t\to qZ $ decay mode (hereafter,$ t\bar{t} $ -FCNC), single top quark production in association with a Z boson (hereafter,$ tZ $ -FCNC) leads to a trilepton signature [18, 19], albeit with no hard jets stemming from the hard scattering, as shown in Fig. 1. Following the approach described in Ref. [20] for the case of FCNC$ tqh $ ($ q = u,c $ ) anomalous couplings (wherein h is the SM-like Higgs boson discovered at the LHC in 2012), we also searched in this study for FCNC$ tqZ $ anomalous couplings by combining the above two processes in the trilepton final state, where both the$ W^\pm $ boson from the top quark and the Z boson decay into either electrons or muons. Thus, we considered two different trilepton signal selections, one where at least two jets with at least one b-tag are required (corresponding to the$ t\bar{t} $ -FCNC channel) and another where exactly one b-tagged jet is required (corresponding to the$ tZ $ -FCNC channel). Realistic detector effects are included in both signal and background processes, so that the emerging results can be compared to experimental predictions.
Figure 1. Representative Feynman diagrams for
$ t\bar{t}\to t \bar{q} Z $ production and decay (a)-(b) and$ tZ $ associated production (c)(d), both of which proceed via FCNC$ tZq $ anomalous couplings ($ q = u,c $ ).This paper is organized as follows. In Sec. II, the cross sections of the two signal processes are calculated at the discussed hadron colliders. Then, Sec. III includes estimates for the signal and background event rates alongside 95% CL limits on the advocated trilepton signals. Finally, we summarize our main results and conclude in Sec. IV.
-
In this section, we describe the structure of the
$ tqZ $ interactions and quantify the cross sections of the production and decay processes of interest. -
In the search for FCNC
$ tqZ $ anomalous interactions, the top quark FCNC coupling is explored in a model-independent way by considering the most general effective Lagrangian approach [21]. The Lagrangian involving FCNC$ tqZ $ interactions can be written as [21]$ \begin{aligned}[b] {\cal L}_{\rm{eff}}=& \sum\limits_{q = u,c} \Bigg[\frac{g}{4c_{\rm W}m_{Z}}\kappa_{tqZ} \bar{q}\sigma^{\mu\nu}(\kappa_{\rm L}P_{\rm L}+\kappa_{\rm R}P_{\rm R})tZ_{\mu\nu} \\& + \frac{g}{2c_{\rm W}}\lambda_{tqZ} \bar{q}\gamma^{\mu}(\lambda_{\rm L}P_{\rm L}+\lambda_{\rm R}P_{\rm R})tZ_{\mu}\Bigg] + {\rm h.c.}, \end{aligned} $

(1) where
$ c_{\rm W} = \cos\theta_{\rm W} $ and$ \theta_{\rm W} $ is the Weinberg angle,$ P_{\rm L,R} $ are the left- and right-handed chirality projector operators, and$ \kappa_{tqZ} $ and$ \lambda_{tqZ} $ are effective couplings for the corresponding vertices. The Electro-Weak (EW) interaction is parameterized by the coupling constant g and the mixing angle$ \theta_{\rm W} $ . The complex chiral parameters$ \kappa_{\rm L,R} $ and$ \lambda_{\rm L,R} $ are normalized as$ |\kappa_{\rm L}|^2 + |\kappa_{\rm R}|^2 = |\lambda_{\rm L}|^2 + |\lambda_{\rm R}|^2 = 1 $ .The partial widths for the FCNC decays, wherein we separate the contributions of the two tensor structures entering the above equation, are given by
$ \begin{align} \Gamma(t\to qZ)\; (\sigma^{\mu\nu})& =\frac{\alpha}{128s_{\rm W}^{2}c_{\rm W}^{2}}|\kappa_{tqZ}|^2\frac{m_{t}^{3}}{m_{Z}^{2}}\left[1-\frac{m_{Z}^{2}}{m_{t}^{2}}\right]^{2}\left[2+\frac{m_{Z}^{2}}{m_{t}^{2}}\right], \\ \Gamma(t\to qZ)\; (\gamma^{\mu})& = \frac{\alpha}{32s_{\rm W}^{2}c_{\rm W}^{2}}|\lambda_{tqZ}|^2\frac{m_{t}^{3}}{m_{Z}^{2}}\left[1-\frac{m_{Z}^{2}}{m_{t}^{2}}\right]^{2}\left[1+2\frac{m_{Z}^{2}}{m_{t}^{2}}\right]. \end{align} $

(2) After neglecting all the light quark masses and assuming the dominant top decay partial width to be that of
$ t \to bW $ [22]$ \Gamma(t\to bW^{+}) = \frac{\alpha}{16s_{\rm W}^{2}}|V_{tb}|^2\frac{m_{t}^{3}}{m_{\rm W}^{2}}\left[1-3\frac{m_{\rm W}^{4}}{m_{t}^{4}}+2\frac{m_{\rm W}^{6}}{m_{t}^{6}}\right],$

(3) then the BR(
$ t \to qZ $ ) can be approximated by [2]$ \begin{aligned}[b] {\rm{BR}}(t \to qZ)\; (\sigma^{\mu\nu})& = 0.172|\kappa_{tqZ}|^2,\\ {\rm{BR}}(t \to qZ)\; (\gamma^{\mu})& = 0.471|\lambda_{tqZ}|^2. \end{aligned} $

(4) Here, the Next-to-Leading Order (NLO) QCD corrections to the top quark decay via model-independent FCNC couplings are also included and the k-factor is taken as 1.02 [23, 24].
-
For the simulations of the ensuing collider phenomenology, we first used the FeynRules package [25] to generate the Universal FeynRules Output (UFO) files [26]. The LO cross sections are obtained by using MadGraph5-aMC@NLO [27] with NNPDF23L01 Parton Distribution Functions (PDFs) [28] taking the renormalization and factorization scales to be
$ \mu_R = \mu_F = \mu_0/2 = (m_t + m_Z)/2 $ . The numerical values of the input parameters are taken as follows [29]:$ \begin{aligned}[b]& m_t = 173.1\;{\rm{GeV}},\quad m_Z = 91.1876\;{\rm{GeV}}, \\& m_W = 80.379\;{\rm{GeV}},\quad \alpha_{s}(m_Z) = 0.1181, \\&G_F = 1.16637\times 10^{-5}\ {{\rm{GeV}}^{-2}}. \end{aligned} $

(5) In Fig. 2, we show the total cross sections
$ \sigma $ in pb versus the two types of coupling parameters,$ \kappa_{tqZ} $ and$ \lambda_{tqZ} $ , at LO. Note that the dipole$ \sigma^{\mu\nu} $ terms lead to larger cross sections with the same coupling values. For the two types of couplings, the cross sections of$ \bar{u}g\to \bar{t}Z $ are overwhelmed by$ ug\to tZ $ owing to the difference between the u-quark and$ \bar{u} $ -quark PDF of the proton. Thus, if we consider the leptonic top decay modes, more leptons than anti-leptons will be observed for a given c.m. energy and integrated luminosity. Owing to the similarly small PDFs of the c-quark and$ \bar{c} $ -quark, the cross section of$ \bar{c}g\to \bar{t}Z $ is essentially the same as that of$ cg\to tZ $ and much smaller than the cross section of$ ug\to tZ $ for the same values of the coupling parameter. This implies that the sensitivity to the FCNC coupling parameter$ \kappa_{tuZ}\; (\lambda_{tuZ}) $ will be better than that to$ \kappa_{tcZ}\; (\lambda_{tcZ}) $ .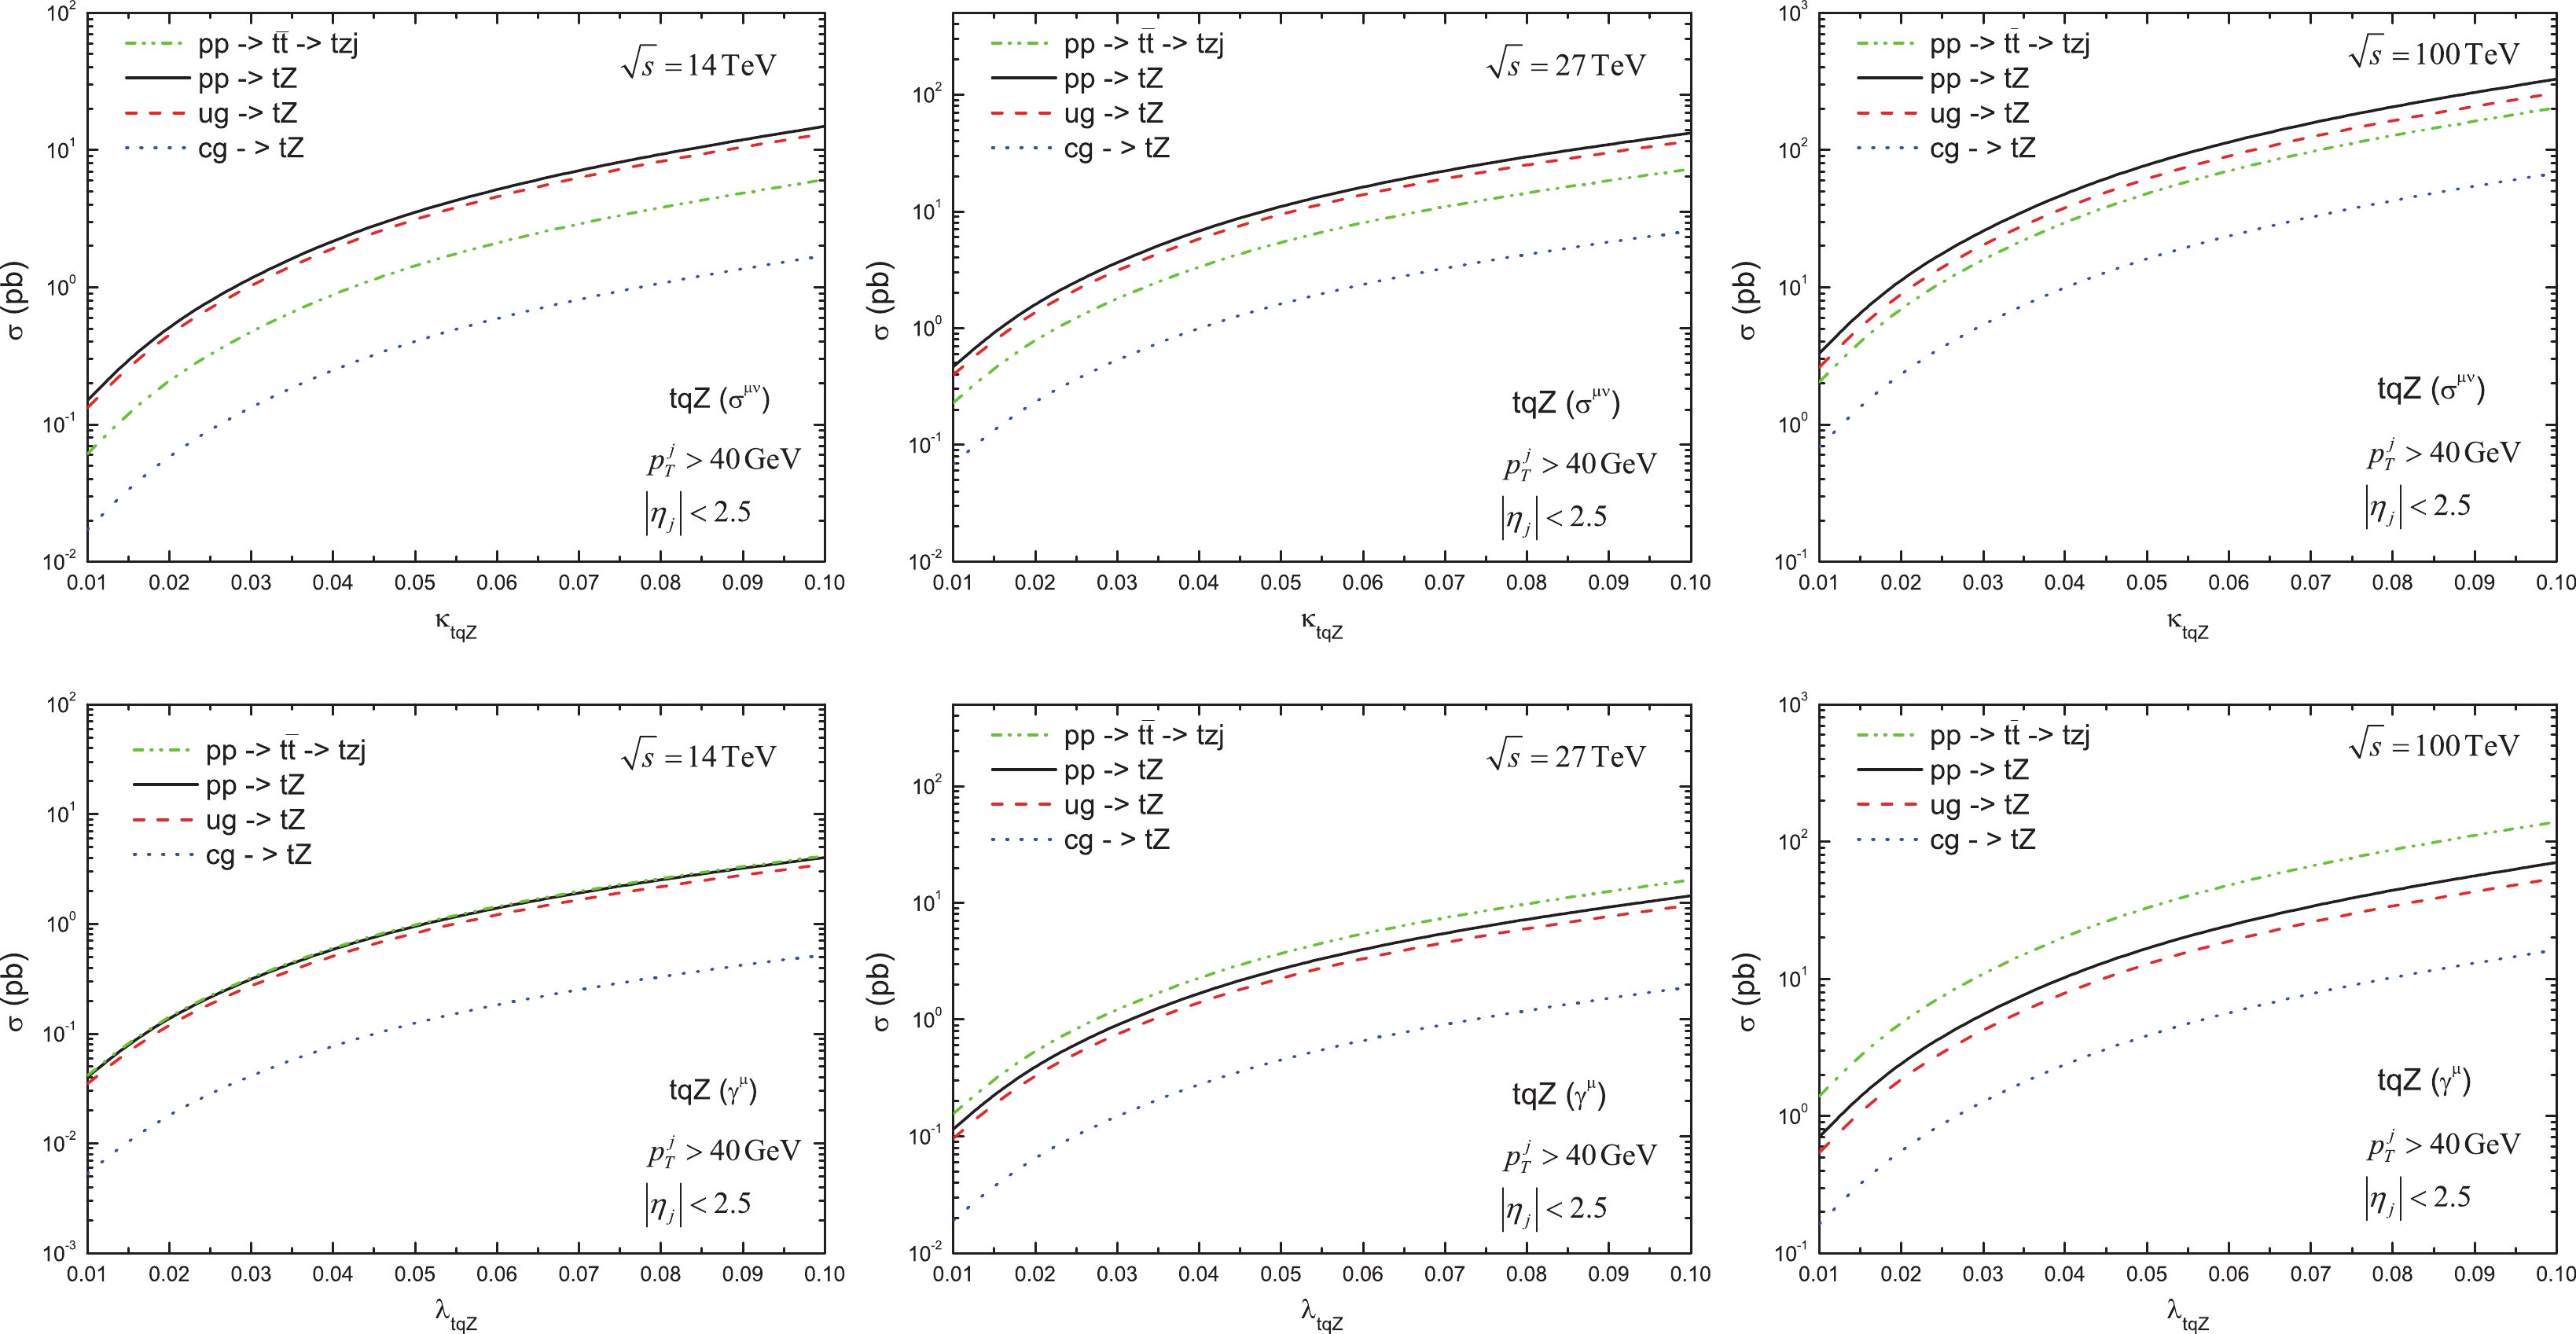
Figure 2. (color online) Dependence of the cross section
$ \sigma $ on the FCNC coupling parameters$ \kappa_{tqZ} $ (upper) and$ \lambda_{tqZ} $ (lower) at the HL-LHC (left), HE-LHC (middle), and FCC-hh (right) with the basic cuts:$ p_T^j>40 $ GeV and$ |\eta_j|< 2.5 $ . Note that the charge conjugated processes are also included in the calculation. -
In this section, we describe the numerical treatment of our signal and background events.
-
The signal is produced through the following processes (herein, all charge conjugated channels are included)
$ pp \to t(\to b W^{+}\to b\ell^{+}\nu)Z(\to \ell^{+}\ell^{-}), $

(6) $ pp \to t(\to b W^{+}\to b \ell^{+}\nu)\bar t(\to \bar q Z(\to \ell^{+}\ell^{-})), $

(7) where
$ \ell = e, \mu $ and$ q = u,c $ , the latter eventually generating a jet j.The final state for the signal is characterized by three leptons (electrons and/or muons) and one b-tagged jet plus missing transverse energy from the escaping undetected neutrino in the
$ tZ $ -FCNC case. In the final state from the$ t\bar{t} $ -FCNC process, there is an additional jet arising from the hadronization of the quark q. Furthermore, note that the interference between the$ tZ $ -FCNC (with an additional q emission) and$ t\bar{t} $ -FCNC processes can be neglected [30].The main backgrounds that yield identical final states to the signal ones are
$ W^\pm Z $ production in association with jets,$ t\bar{t}V $ ($ V = W^\pm , Z $ ), and the irreducible$ tZj $ process, where j denotes a non-b-quark jet. Besides, in the top pair production case (where the top quark pairs decay semi-leptonically), a third lepton can come from a semi-leptonic B-hadron decay inside the b-jet. Here, we do not consider multijet backgrounds where jets can fake electrons, given that they are generally negligible in multilepton analyses [31]. Other processes, such as the$ t\bar{t}h $ , tri-boson events, or$ W^\pm $ + jets are not included in the analysis owing to the very small cross sections resulting from applying the cuts.The signal and background samples are generated at LO by interfacing MadGraph5-aMC@NLO to the the Monte Carlo (MC) event generator Pythia 8.20 [32] for the parton showering. All produced jets were forced to be clustered using FASTJET 3.2 [33] assuming the anti-
$ k_{t} $ algorithm with a cone radius of$ R = 0.4 $ [34]. All event samples were fed into the Delphes 3.4.2 package [35] with the default HL-LHC, HE-LHC, and FCC-hh detector cards. Finally, the event analysis was performed by using MadAnalysis5 [36]. To take into account inclusive QCD contributions, we generated the hard scatterings of signal and backgrounds with up to one additional jet in the final state, followed by matrix element and parton shower merging with the MLM matching scheme [37]. Furthermore, we renormalized the LO cross sections for the signals to the corresponding higher order QCD results of Refs. [38-40]. For the SM backgrounds, we generated LO samples renormalized to the NLO or next-NLO (NNLO) order cross sections, where available, taken from Refs. [41-50]. For instance, the LO cross section for the$ W^{\pm}Z $ + jets background (one of the most relevant ones overall) was renormalized to the NLO one through a k-factor of 1.3 [45] at 14 TeV LHC and, as an estimate, we assumed the same correction factor at the HE-LHC and FCC-hh. The LO cross section for the$ t\bar{t} $ process was renormalized to the NNLO one by a k-factor of 1.6 [50] at the HL-LHC and HE-LHC and 1.43 [44] at the FCC-hh.To identify objects, we impose the following basic or generation (parton level) cuts for the signals and SM backgrounds:
$\begin{aligned}[b]& p_{T}^{\ell}>25\; {\rm{GeV}},\quad p_{T}^{j/b}>30\; {\rm{GeV}},\quad |\eta_{i}|<2.5,\\& \Delta R_{ij}>0.4 \; \; (i,j = \ell, b, j), \end{aligned} $

(8) where j and b denote light-flavour jets and a b-tagged jet, respectively. Here,
$ \Delta R = \sqrt{\Delta\Phi^{2}+\Delta\eta^{2}} $ denotes the separation in the rapidity-azimuth plane. Next, we discuss the selection of events by focusing on two cases: the$ pp \to t\bar{t}\to tZj $ (henceforth referred to as ‘Case A’) process and the$ pp \to tZ $ (henceforth referred to as ‘Case B’) process, respectively. As previously mentioned, the main difference is whether there is a light jet in the final state. We first discuss the selection cuts for Case A and then for Case B. -
For Case A, the trilepton analysis aimed to select
$ t\bar{t} $ events where one of the top quarks decays via the FCNC process ($ t\to qZ\to q\ell_{1}\ell_{2} $ ) while the other top quark decays leptonically ($ t\to Wb\to \ell_{3}\nu b $ ). Here, the leptons$ \ell_{1} $ and$ \ell_{2} $ are the two Opposite-Sign and Same-Flavour (OSSF) leptons that are assumed to be the product of the Z-boson decay, whereas the third lepton,$ \ell_{3} $ , is assumed to originate from the leptonically decaying top quark, with the b-tagged jet emerging from the$ t\to b W^+ $ decay and the light jet j being the non-b-tagged one. Therefore, the following preselection was used for Case A (Cut 1):● exactly three isolated leptons with
$ p_{T}>30\;{\rm{GeV}} $ , in which at least one OSSF lepton pair is present;● at least two jets with
$ p_{T}>40\;{\rm{GeV}} $ , with exactly one of them being b-tagged;● the missing transverse energy
$ E_{T}^{\rm{miss}}>30 \;{\rm{GeV}}$ .In Fig. 3, we plot some differential distributions for signals and SM backgrounds at the HL-LHC, such as the invariant mass distributions of the two leptons,
$ M_{\ell_{1}\ell_{2}} $ , the transverse mass distribution for$ M_{T}(\ell_{3}) $ and$ M_{T}( b\ell_{3}) $ , and the triple invariant mass,$ M_{\ell_{1}\ell_{2} j} $ . Furthermore, the top quark transverse cluster mass can be defined as [51]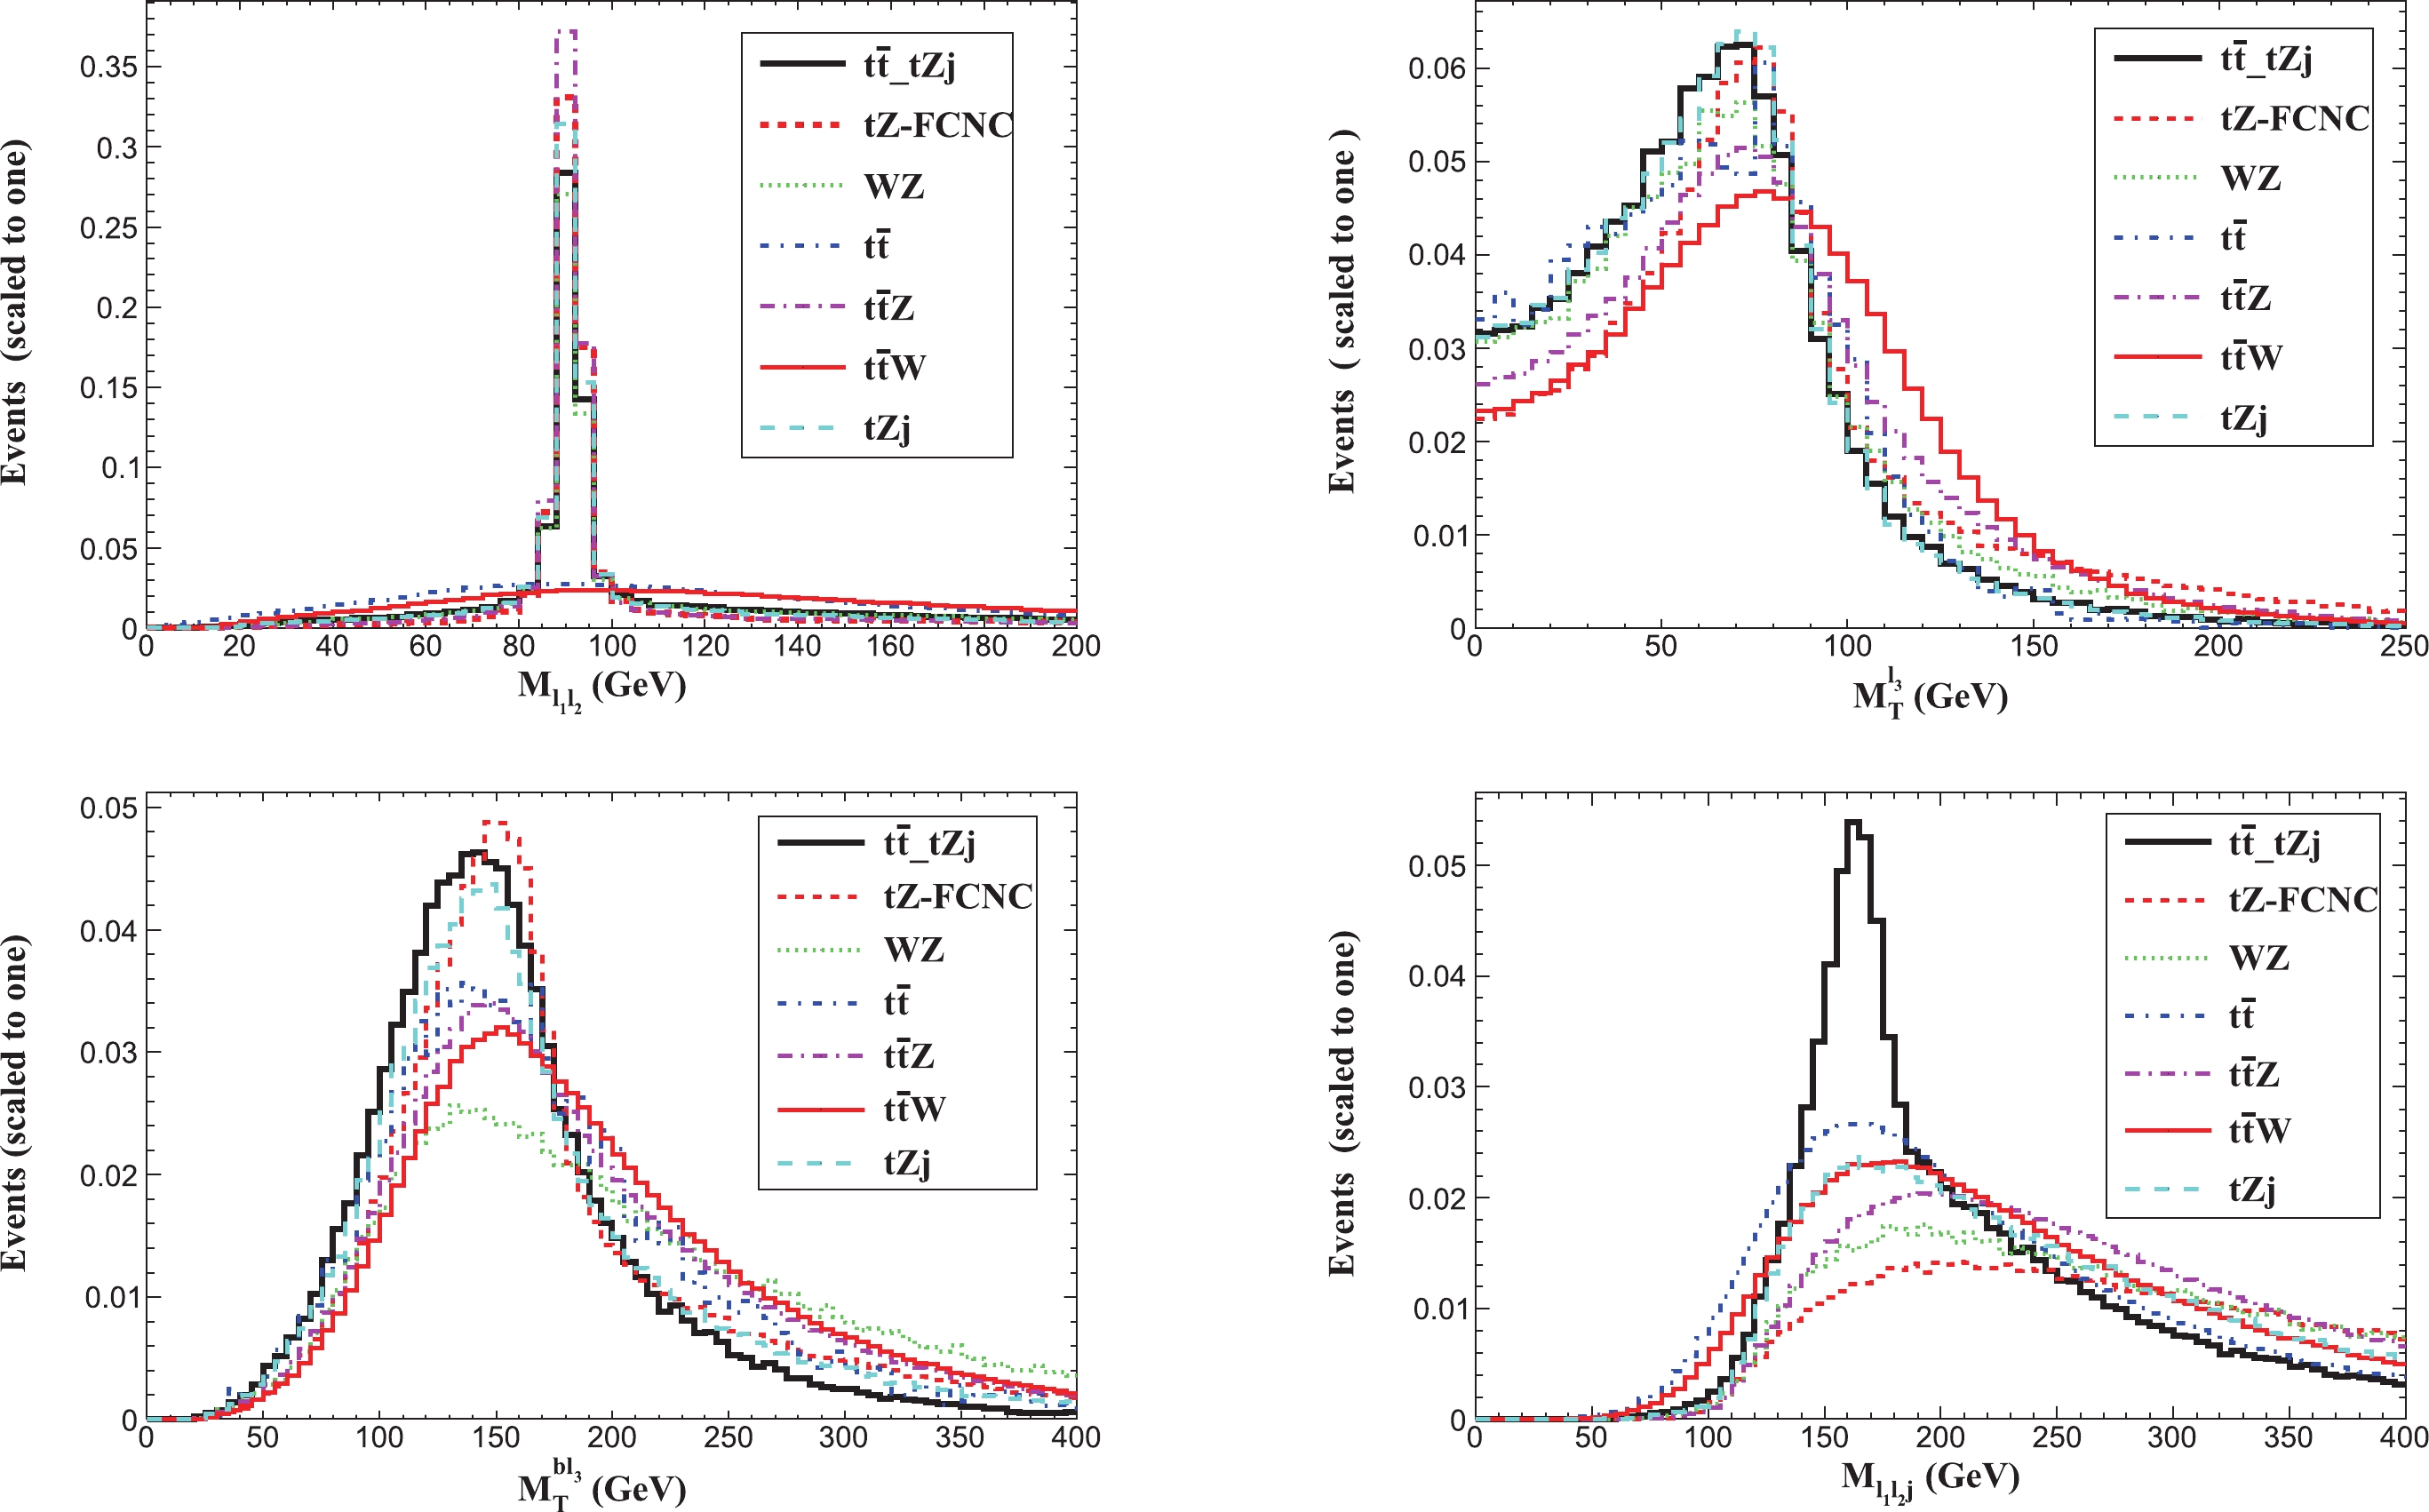
Figure 3. (color online) Normalized (to 1) distributions for the signals and SM backgrounds at the HL-LHC for Case A.
$\begin{aligned}[b]M_T^{2}\equiv &\Big(\sqrt{(p_{\ell_{3}}+p_{b})^{2}+|\vec{p}_{T,\ell_{3}}+\vec{p}_{T,b}|^{2}}+|\vec{\notp}_T| \Big)^{2}-|\vec{p}_{T,\ell_{3}}\\&+\vec{p}_{T,b}+\vec{\notp}_T|^{2},\end{aligned} $

(9) where
$ \vec{p}_{T,\ell_{3}} $ and$ \vec{p}_{T,b} $ are the transverse momenta of the third charged lepton and b-quark, respectively, and$ \vec{\notp}_T $ is the missing transverse momentum determined by the negative sum of the visible momenta in the transverse direction.According to the above analysis, we can impose the following set of cuts:
● (Cut 2) Two of the same-flavour leptons in each event are required to have opposite electric charge and an invariant mass,
$ M_{\ell_{1}\ell_{2}} $ , compatible with the Z boson mass, i.e.,$ |M(\ell_{1}\ell_{2})-m_{Z}|< 15\;{\rm{GeV}} $ .● (Cut 3) The transverse mass of the
$ W^\pm $ candidate is required to be$ 50\; {\rm{GeV}} < M_T^{\ell_{3}} < 100\; {\rm{GeV}} $ , whereas the transverse mass of the top quark is required to be$ 100 \; {\rm{GeV}} < M_T^{b\ell_{3}} < 200\; {\rm{GeV}} $ .● (Cut 4) The triple invariant mass
$ M_{\ell_{1}\ell_{2} j} $ cut is such that$ 140 \; {\rm{GeV}} < M_{\ell_{1}\ell_{2} j} < 200 \; {\rm{GeV}} $ .We used the same selection cuts for the HE-LHC and FCC-hh analysis because the distributions are very similar to the case of the HL-LHC. The effects of the described cuts on the signal and SM background processes are illustrated in Tables 2-4. Owing to the different b-tagging rates for u- and c-quarks, we give the events separately for
$ q = u, c $ for the signals. Note that, at the end of the cut flow, the largest SM background is the$ pp\to tZj $ process, which is approximately 0.048 fb, 0.144 fb, and 1.45 fb at the HL-LHC, HE-LHC, and FCC-hh, respectively. Moreover, the$ W^\pm Z $ + jets and$ t\bar{t}Z $ processes can also generate significant contributions to the SM background. Evidently, the dominant signal contribution comes from the$ t\bar{t} $ -FCNC process, but the contribution from the$ tZ $ -FCNC production process cannot be ignored, especially for the$ tuZ $ couplings.Cuts Signals Backgrounds $ t\bar{t}\to tZj $ 

$ pp\to tZ $ 

$ WZ $ 

$ t\bar{t} $ 

$ t\bar{t}Z $ 

$ t\bar{t}W $ 

$ tZj $ 

$ tZq\; (\sigma^{\mu\nu}) $ 

$ tZq\; (\gamma^{\mu}) $ 

$ tZq\; (\sigma^{\mu\nu}) $ 

$ tZq\; (\gamma^{\mu}) $ 

Basic 31.8 (33.4) 23.1 (24.3) 44 (7.6) 10.1 (2.2) 5.22 24618 8.32 1.36 4.23 Cut 1 5.9 (5.6) 4.3 (4.2) 7.18 (1.15) 1.34 (0.28) 0.86 1.36 0.49 0.097 0.55 Cut 2 4.5 (4.3) 3.41 (3.25) 5.94 (0.95) 1.09 (0.23) 0.64 0.25 0.37 0.012 0.43 Cut 3 1.93 (1.8) 1.46 (1.36) 2.39 (0.41) 0.47 (0.1) 0.14 0.085 0.12 0.0034 0.18 Cut 4 0.91 (0.81) 0.68 (0.61) 0.2 (0.046) 0.077 (0.018) 0.031 0.027 0.028 0.0015 0.048 Table 2. Cut flow of the cross sections (in fb) for the signals and SM backgrounds at the HL-LHC with
$ \kappa_{tuZ} = \lambda_{tuZ} = 0.1 $ and$ \kappa_{tcZ} = \lambda_{tcZ} = 0.1 $ (in the brackets) for Case A.Cuts Signals Backgrounds $ t\bar{t}\to tZj $ 

$ pp\to tZ $ 

$ WZ $ 

$ t\bar{t} $ 

$ t\bar{t}Z $ 

$ t\bar{t}W $ 

$ tZj $ 

$ tZq (\sigma^{\mu\nu}) $ 

$ tZq (\gamma^{\mu}) $ 

$ tZq (\sigma^{\mu\nu}) $ 

$ tZq (\gamma^{\mu}) $ 

Basic 179 (188) 129 (135) 170 (39) 35 (10) 13.5 71187 42 4.8 15.4 Cut 1 29 (28) 22 (21) 27 (5.8) 4.6 (1.26) 2.73 4.88 2.67 0.35 1.93 Cut 2 22 (21) 17 (16) 22.5 (4.8) 3.7 (1.0) 2.04 0.92 1.97 0.038 1.51 Cut 3 9.1 (8.64) 7.0 (6.5) 8.16 (1.86) 1.49 (0.42) 0.41 0.31 0.58 0.011 0.59 Cut 4 4.1 (3.9) 3.11 (2.75) 0.63 (0.18) 0.21 (0.072) 0.087 0.043 0.12 0.0048 0.144 Table 3. Cut flow of the cross sections (in fb) for the signals and SM backgrounds at the HE-LHC with
$ \kappa_{tuZ}=\lambda_{tuZ}=0.1 $ and$ \kappa_{tcZ}=\lambda_{tcZ}=0.1 $ (in the brackets) for Case A.Cuts Signals Backgrounds $ t\bar{t}\to tZj $ 

$ pp\to tZ $ 

$ WZ $ 

$ t\bar{t} $ 

$ t\bar{t}Z $ 

$ t\bar{t}W $ 

$ tZj $ 

$ tZq (\sigma^{\mu\nu}) $ 

$ tZq (\gamma^{\mu}) $ 

$ tZq (\sigma^{\mu\nu}) $ 

$ tZq (\gamma^{\mu}) $ 

Basic 2135 (2315) 1532 (1662) 1122 (455) 290 (127) 267 764935 351 46 155 Cut 1 440 (377) 335 (279) 276 (98) 56 (21) 61 60 22 5.6 31 Cut 2 330 (280) 102 (86) 224 (80) 44 (17) 45 9.5 17 0.53 24 Cut 3 134 (109) 102 (86) 85.2 (31.2) 17.6 (7.3) 8.7 3.7 4.9 0.14 8.7 Cut 4 70 (57) 54.4 (43.5) 9.03 (4.01) 3.32 (1.53) 2.01 1.07 0.82 0.07 1.83 Table 4. Cut flow of the cross sections (in fb) for the signals and SM backgrounds at the FCC-hh with
$ \kappa_{tuZ}=\lambda_{tuZ}=0.1 $ and$ \kappa_{tcZ}=\lambda_{tcZ}=0.1 $ (in the brackets) for Case A. -
For this case, we mainly focused on the signal from the
$ ug\to tZ $ process owing to the relative large cross section. Extra jets are vetoed in the following analysis. However, the final signals for Case A could also be considered as a source for Case B if the light quark is missed by the detector. Hence, we combine these processes into the complete signal events.The process
$ ug\to tZ $ should include two leptons with positive charge, one coming from the decay$ Z\to \ell^{+}\ell^{-} $ and the other from the top quark decay$ t\to W^{+}b\to \ell^{+}\nu b $ . Given that the distributions for the signal and backgrounds are similar for the invariant mass$ M_{\ell_1\ell_2} $ as well as the transverse masses$ M_{T}(\ell_{3}) $ and$ M_{T}( b\ell_{3}) $ , we only plot the distributions for the distance of the OSSF lepton pair,$ \Delta R(\ell_{1},\ell_{2}) $ , and the rapidity of the OSSF lepton pair,$ y_{\ell_{1}\ell_{2}} $ , in Fig. 4 (here, the distributions are obtained at the HL-LHC, but the pattern is very similar to those at the HE-LHC and FCC-hh). Note that, for Case B, the Z boson from the$ ug\to tZ $ process concentrates in the forward and backward regions given that the partonic c.m. frame is highly boosted along the direction of the u-quark.
Figure 4. (color online) Normalized (to 1) distributions for the signals and SM backgrounds at the HL-LHC for Case B.
Thus, we can impose the following set of cuts for Case B:
● (Cut 1) There are three leptons, among which at least two have positive charge and
$ p_{T}>30\;{\rm{GeV}} $ , and there is exactly one b-tagged jet with$ p_{T}>40\;{\rm{GeV}} $ ; the event is rejected if the$ p_{T} $ of the subleading jet is greater than 25 GeV.● (Cut 2) The distance between the OSSF lepton pair should lie within
$ \Delta R(\ell_{1},\ell_{2})\in [0.4, 1.2] $ while the corresponding invariant mass is required to be$ |M(\ell_{1}\ell_{2})-m_{Z}|< 15\;{\rm{GeV}} $ .● (Cut 3) The transverse masses of the reconstructed
$ W^\pm $ boson and top quark masses are required to satisfy$ 50 \; {\rm{GeV}} < M_T^{\ell_{3}} < 100 \; {\rm{GeV}} $ and$ 100 \; {\rm{GeV}} < M_T^{b\ell_{3}} < 200 \; {\rm{GeV}} $ , respectively.● (Cut 4) The rapidity of the OSSF lepton pair is required to be
$ |y_{\ell_{1}\ell_{2}}| > 1.0 $ .The effects of these cuts on the signal and background processes for Case B are illustrated in Tables 5-7. Note that all the backgrounds can be suppressed efficiently after imposing such a selection. At the end of the cut flow, the
$ W^\pm Z $ + jets and$ t\bar{t} $ production processes are the dominant SM backgrounds mainly owing to the initially large cross sections.Cuts Signals Backgrounds $ ug\to tZ $ 

$ t\bar{t}\to tZj $ 

$ WZ $ 

$ t\bar{t} $ 

$ t\bar{t}Z $ 

$ t\bar{t}W $ 

$ tZj $ 

Basic 3365 (856) 2664 (1926) 474 $ 2.2\times 10^{6} $ 

602 233 367 Cut 1 319 (61) 23 (18) 14 38 1.2 4.5 1.3 Cut 2 184 (23) 5.6 (4.3) 3.5 1.0 0.29 0.005 0.26 Cut 3 108 (13.2) 3 (2.66) 0.9 0.43 0.07 0.01 0.14 Cut 4 57 (7.2) 1.2 (1.1) 0.39 0.19 0.02 0.005 0.073 Table 5. Cut flow of the cross sections (in
$ \times 10^{-2} $ fb) for the signals and SM backgrounds at the HL-LHC with$ \kappa_{tuZ} = 0.1 $ and$ \lambda_{tuZ} = 0.1 $ (in the brackets) for Case B.Cuts Signals Backgrounds $ ug\to tZ $ 

$ t\bar{t}\to tZj $ 

$ WZ $ 

$ t\bar{t} $ 

$ t\bar{t}Z $ 

$ t\bar{t}W $ 

$ tZj $ 

Basic 123 (30) 153 (11) 14.2 64628 31.6 7.7 13.5 Cut 1 7.9 (1.38) 1.0 (0.075) 0.31 1.05 0.04 0.12 0.043 Cut 2 4.63 (0.54) 0.27 (0.018) 0.075 0.043 0.009 0.0014 0.0087 Cut 3 2.68 (0.32) 0.18 (0.01) 0.016 0.037 0.0021 0.0004 0.0046 Cut 4 1.68 (0.203) 0.07 (0.003) 0.0064 0.018 0.0007 0.0002 0.0024 Table 6. Cut flow of the cross sections (in fb) for the signals and SM backgrounds at the HE-LHC with
$ \kappa_{tuZ}=0.1 $ and$ \lambda_{tuZ}=0.1 $ (in the brackets) for Case B.Cuts Signals Backgrounds $ ug\to tZ $ 

$ t\bar{t}\to tZj $ 

$ WZ $ 

$ t\bar{t} $ 

$ t\bar{t}Z $ 

$ t\bar{t}W $ 

$ tZj $ 

Basic 727 (224) 1518 (1219) 313 697297 242 43 132 Cut 1 24 (5.1) 2.4 (2.0) 4.1 4.3 0.035 0.33 0.144 Cut 2 13.5 (1.67) 0.66 (0.39) 0.85 0.098 0.007 0.003 0.025 Cut 3 8.12 (1.0) 0.35 (0.27) 0.12 0.049 0.0006 0.0007 0.011 Cut 4 5.94 (0.73) 0.23 (0.13) 0.071 0.025 0.0003 0.0004 0.0077 Table 7. Cut flow of the cross sections (in fb) for the signals and SM backgrounds at the FCC-hh with
$ \kappa_{tuZ}=0.1 $ and$ \lambda_{tuZ}=0.1 $ (in the brackets) for Case B. -
To estimate the exclusion significance, we use the following expression [52]:
$ Z_{\rm{excl}} = \sqrt{2\left[S-B\ln\left(\frac{B+S+x}{2B}\right) - \frac{1}{\delta^2 }\ln\left(\frac{B-S+x}{2B}\right)\right] - \left(B+S-x\right)\left(1+\frac{1}{\delta^2 B}\right)}, $

(10) with
$ x = \sqrt{(S+B)^2- 4 \delta^2 S B^2/(1+\delta^2 B)}. $

(11) Here, S and B represent the total signal and SM background events, respectively. Furthermore,
$ \delta $ is the percentage systematic error on the SM background estimate. Following Refs. [52, 53], we define the regions with$ Z_{\rm{excl}} \leqslant 1.645 $ as those that can be excluded at 95% CL. In the case of$ \delta \to 0 $ , the above expressions are simplified as$ Z_{\rm{excl}} = \sqrt{2[S-B\ln(1+S/B)]}. $

(12) Using the results from Case A and Case B, we combine the significance for
$ {\rm BR}(t\to uZ) $ with two types of couplings,$ Z_{\rm{comb}} = \sqrt{Z_{\rm{A}}^2+Z_{\rm{B}}^2 } $

(13) while, for
$ {\rm BR}(t\to cZ) $ , we only use the results from Case A.In Figs. 5 and 6, the 90% CL lines are plotted as a function of the integrated luminosity and BR
$ (t\to qZ) $ for the two types of couplings with three typical values of systematic uncertainties:$ \delta = 0 $ , 5%, and 10%. Note from Fig. 5 that, for the tensor (vector) terms, the combined 90% CL limits without systematic error on$ {\rm{BR}}(t\to uZ) $ are$ 2.3\; (5.3)\times 10^{-6} $ and$ 0.76\; (1.2)\times 10^{-6} $ at the HE-LHC and FCC-hh, respectively, with an integrated luminosity of 10 ab$ ^{-1} $ . For this value of integrated luminosity and assuming a 5% systematic error, the obtained limits are approximately$ 0.34\; (1.47)\times 10^{-5} $ and$ 0.27\; (1.21)\times 10^{-5} $ , respectively, while, for the case$ \delta = 10 $ %, the 90% CL limits on$ {\rm{BR}}(t\to uZ) $ change to$ 0.51\; (2.53)\times 10^{-5} $ and$ 0.48\; (2.2)\times 10^{-5} $ , respectively. Note from Fig. 6 that, for Case A, the 90% CL limits without systematic error on$ {\rm{BR}}(t\to cZ) $ are$ 0.45\; (0.64)\times 10^{-5} $ and$ 1.13\; (1.54)\times 10^{-6} $ at the HE-LHC and FCC-hh, respectively, with an integrated luminosity of 10 ab$ ^{-1} $ . Assuming a 5% systematic error, the obtained limits are approximately$ 1.43\; (2.06)\times 10^{-5} $ and$ 1.35\; (1.82)\times 10^{-5} $ , respectively.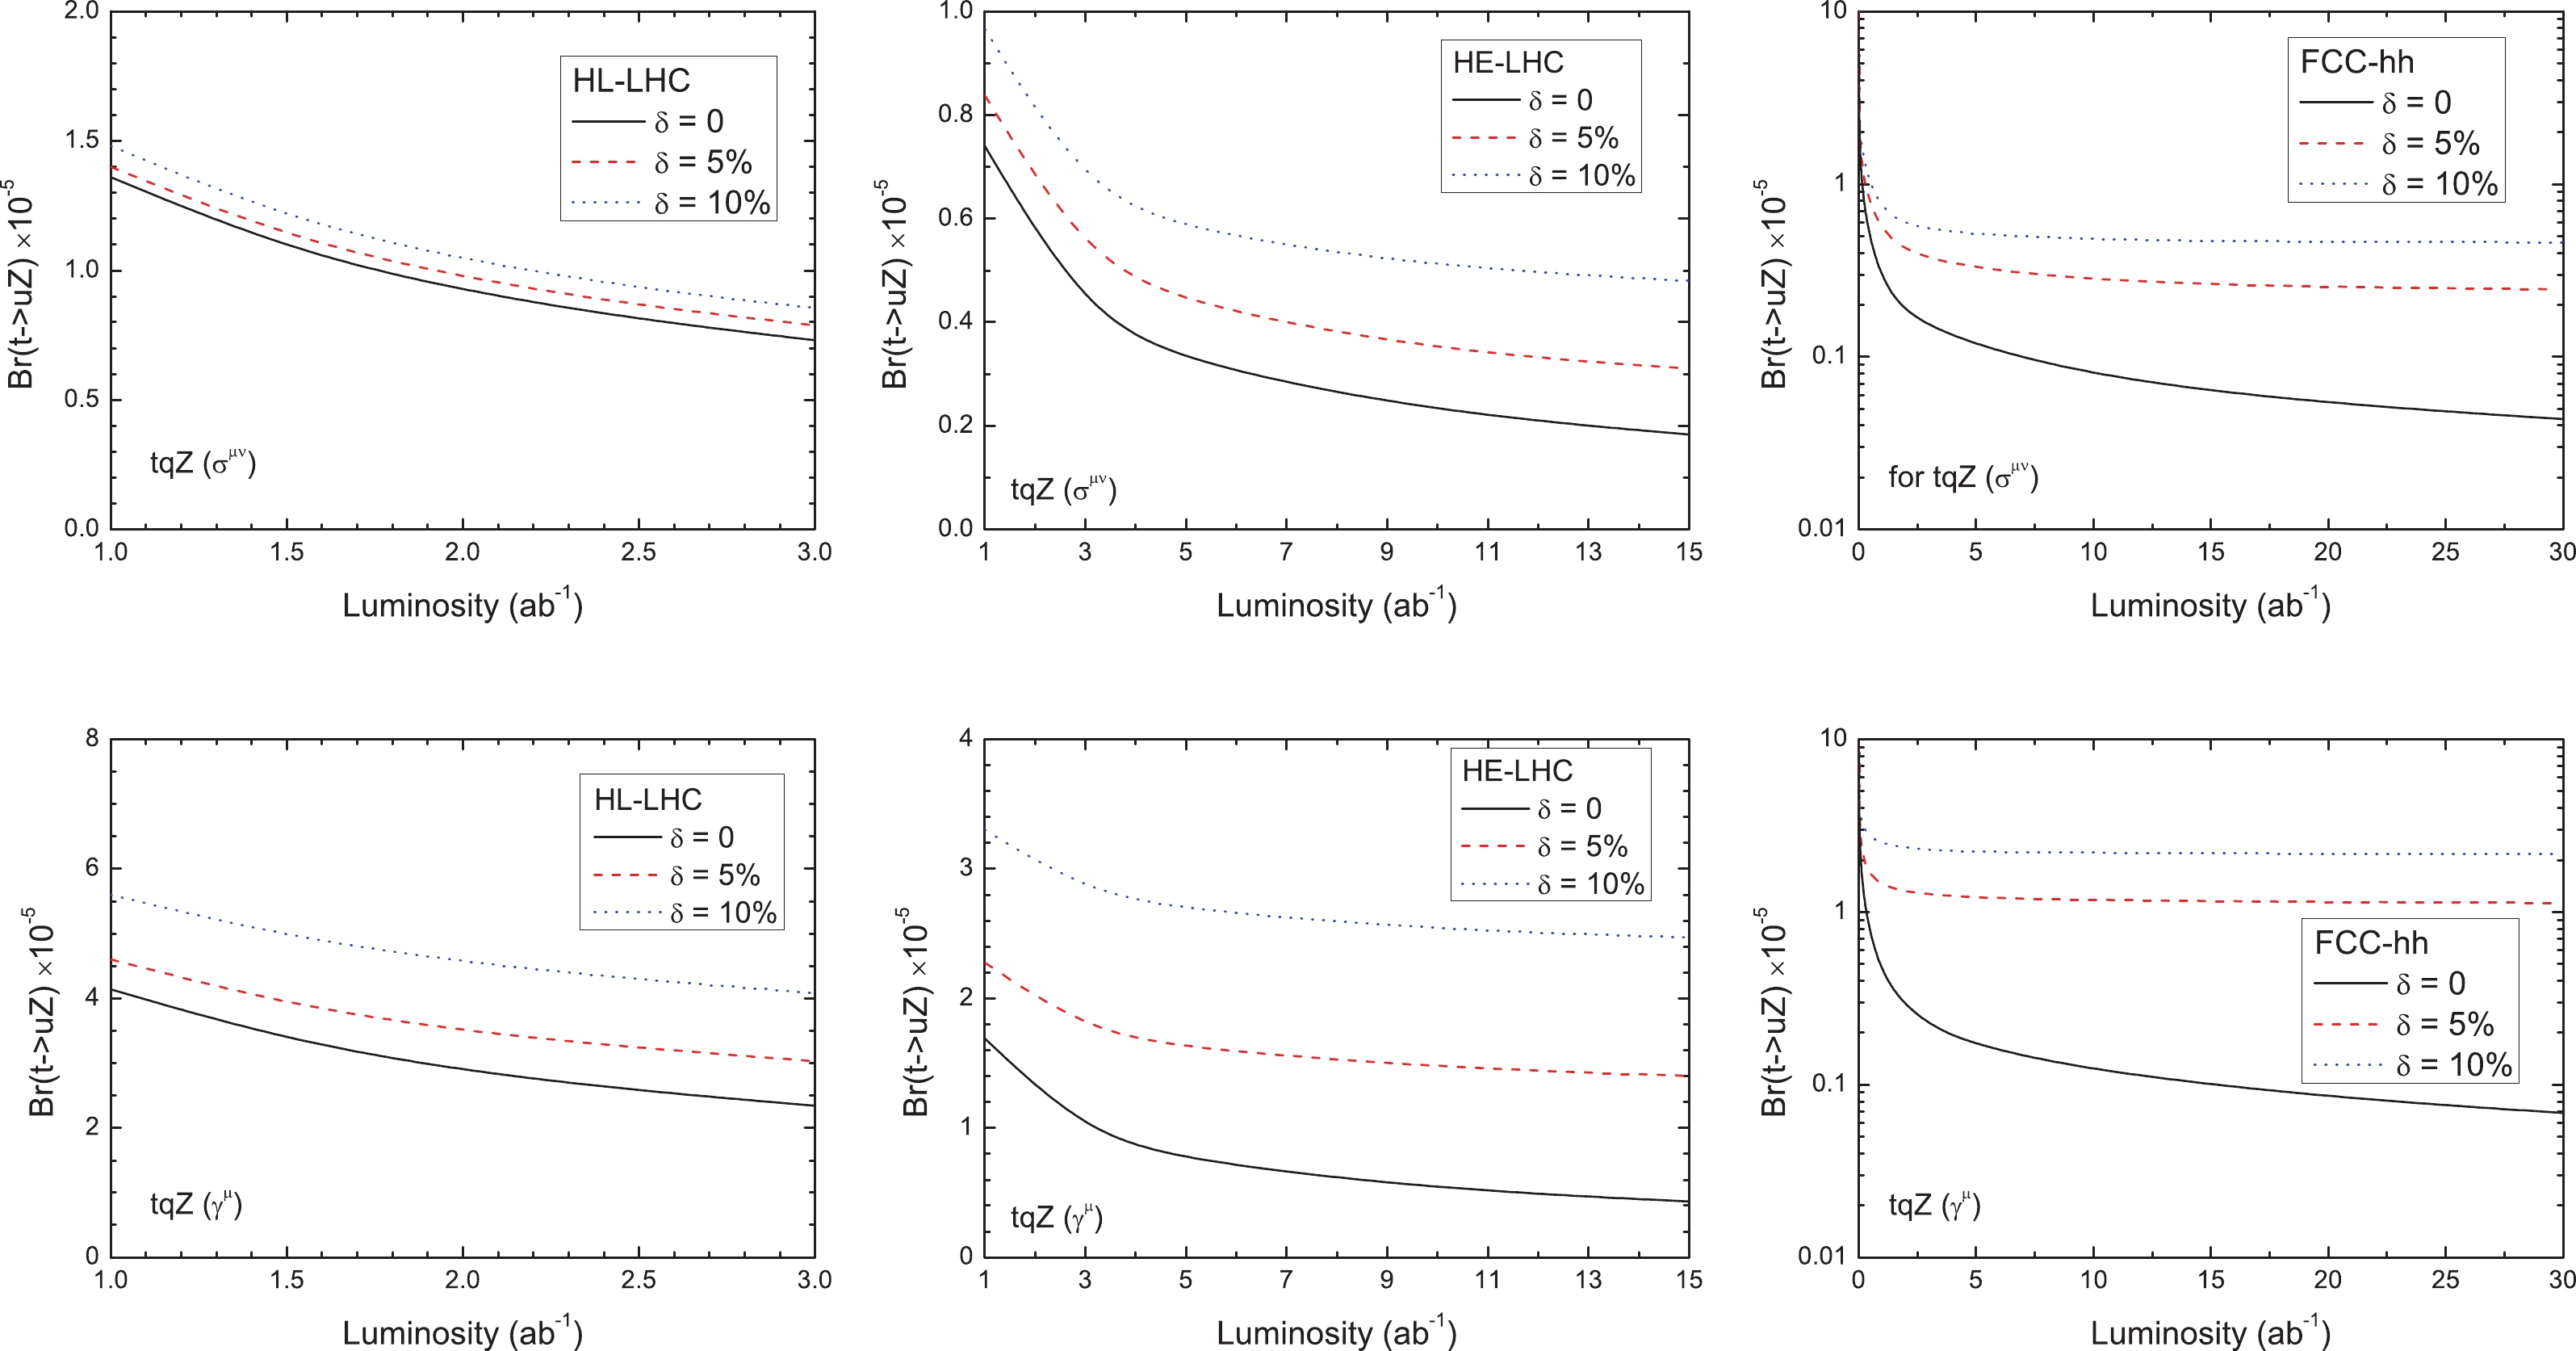
Figure 5. (color online) Combined 95% CL contour plots in
$ L_{\rm{int}}-{\rm{BR}}(t\to uZ) $ planes for the tensor terms (upper) and the vector terms (below) at the HL-LHC (left), HE-LHC (middle), and FCC-hh (right). Three typical values for the systematic uncertainties, i.e.,$ \delta = 0 $ , 5%, 10%, are set.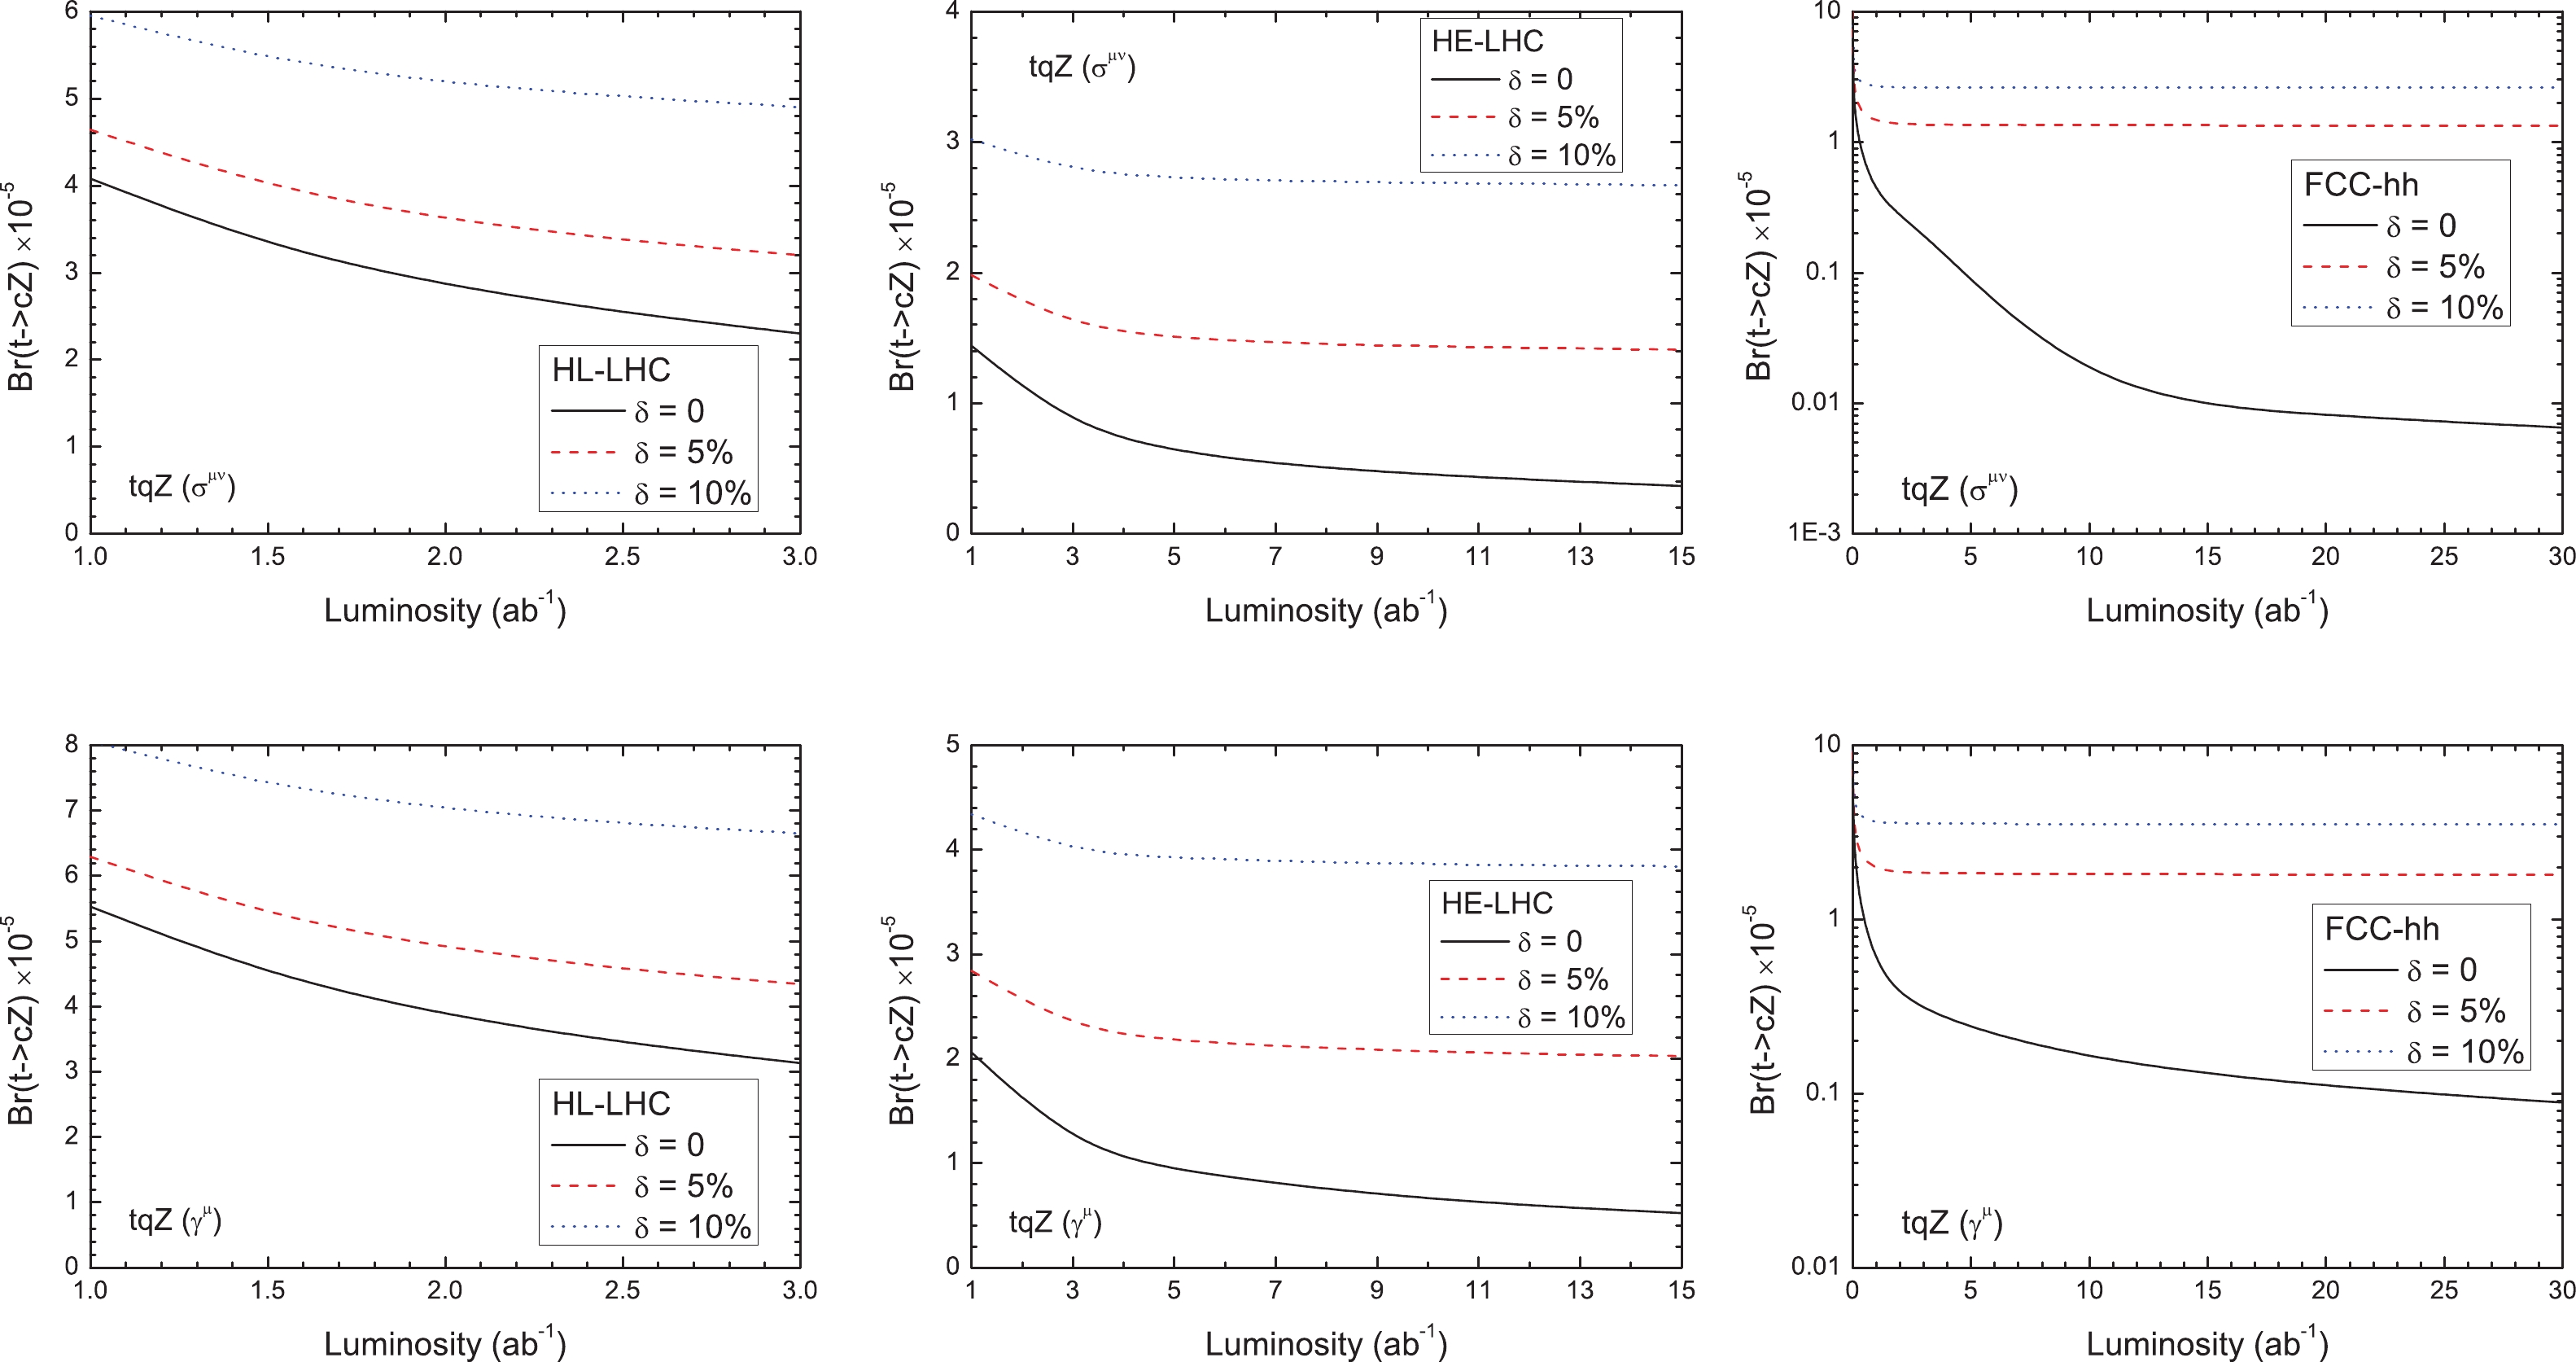
Figure 6. (color online) For Case A, 95% CL contour plots in
$ L_{\rm{int}}-{\rm{BR}}(t\to cZ) $ planes for the tensor terms (upper) and the vector terms (below) at the HL-LHC (left), HE-LHC (middle), and FCC-hh (right). Three typical values for the systematic uncertainties, i.e.,$ \delta = 0 $ , 5%, 10%, are set.In Table 8, we list the exclusion limits at 95% CL at the future HL-LHC with 3 ab
$ ^{-1} $ , at the HE-LHC with 15 ab$ ^{-1} $ , and at the FCC-hh with 30 ab$ ^{-1} $ , respectively, with two systematic errors:$ \delta = 0 $ % and$ \delta = 10 $ %. From Table 8, the following observations can be made:Branching fraction HL-LHC, 3 ab−1 HE-LHC, 15 ab−1 FCC-hh, 30 ab−1 $\delta=0$ 

$\delta=10$ %

$\delta=0$ 

$\delta=10$ %

$\delta=0$ 

$\delta=10$ %

BR $(t \to u Z)\;(\sigma^{\mu\nu})$ 

$0.73 \times 10^{-5}$ 

$0.85\times 10^{-5}$ 

$1.83 \times 10^{-6}$ 

$4.8 \times 10^{-6}$ 

$4.35\times 10^{-7}$ 

$4.6 \times 10^{-6}$ 

BR $(t \to c Z)\;(\sigma^{\mu\nu})$ 

$2.3 \times 10^{-5}$ 

$4.9 \times 10^{-5}$ 

$3.64 \times 10^{-6}$ 

$2.67 \times 10^{-5}$ 

$6.54 \times 10^{-7}$ 

$2.61\times 10^{-5}$ 

BR $(t \to u Z)\;(\gamma^{\mu})$ 

$2.34 \times 10^{-5}$ 

$4.08\times 10^{-5}$ 

$4.28 \times 10^{-6}$ 

$2.47 \times 10^{-5}$ 

$6.86\times 10^{-7}$ 

$2.17 \times 10^{-5}$ 

BR $(t \to c Z)\;(\gamma^{\mu})$ 

$3.13 \times 10^{-5}$ 

$6.65 \times 10^{-5}$ 

$5.22 \times 10^{-6}$ 

$3.84 \times 10^{-5}$ 

$8.87 \times 10^{-7}$ 

$3.54\times 10^{-5}$ 

Table 8. Upper limits on BR
$(t\to u(c)Z)$ at 95% CL obtained at the HL-LHC, HE-LHC, and FCC-hh. We consider systematic errors of 0% and 10% on the SM background events.● More stringent limits are obtained on the
$ tuZ $ coupling compared to the$ tcZ $ coupling owing to the larger cross section in the corresponding signal.● For the
$ tuZ $ coupling, the sensitivities of the tensor couplings are smaller than those of the vector terms, being of the order of$ 10^{-6} $ at the 95% CL assuming a 10% systematic uncertainty.● For both channels, the sensitivities are weaker than those without any systematic error. This means that those searches will be dominated by systematic uncertainties and will not benefit further from the energy and luminosity upgrades.
Many recent phenomenological studies available in literature extensively investigated the top FCNC anomalous couplings at various future high energy colliders, including
$ e^+e^- $ and$ e^-p $ machines: see Refs. [54-61] as examples of the most recent reviews. Besides, the expected limits of the four-fermion coefficients at the LHeC and CEPC are obtained in Refs. [62, 63]. Therefore, it is worth comparing the limits on$ {\rm{BR}}(t\to qZ) $ obtained in this study with those obtained by other groups, which are summarised in Table 9. Note that the limits on the BRs are expected to be of$ {\cal O}(10^{-4}-10^{-6}) $ . Therefore, we expect our advocated signatures to provide competitive complementary information to that from the above studies in detecting$ tqZ $ ($ q = u,c $ ) anomalous couplings at future hadronic colliders.Channels Data set Limits $ tZ\to W(\to \ell \nu)bZ(\to \ell^{+}\ell^{-}) $ [54]

HL-LHC, 100 fb $ ^{-1} $ 

$ {\rm{BR}}(t\to uZ)<1.6\times 10^{-4} $ (

$ \sigma^{\mu\nu} $ )

@ 14 TeV $ {\rm{BR}}(t\to cZ)< 1.0\times10^{-3} $ (

$ \sigma^{\mu\nu} $ )

Ultra-boosted $ tZ $ production [55]

HL-LHC, 3 ab $ ^{-1} $ 

$ {\rm{BR}}(t\to uZ)<4.1\times 10^{-5} $ (

$ \sigma^{\mu\nu} $ )

@ 14 TeV $ {\rm{BR}}(t\to cZ)< 1.6\times10^{-3} $ (

$ \sigma^{\mu\nu} $ )

FCC-hh, 10 ab $ ^{-1} $ 

$ {\rm{BR}}(t\to uZ)< 2.7\times 10^{-6} $ (

$ \sigma^{\mu\nu} $ )

@ 100 TeV $ {\rm{BR}}(t\to cZ)< 5.0\times10^{-5} $ (

$ \sigma^{\mu\nu} $ )

$ pp\to tt\bar{t}(\bar{t}\bar{t}t) $ [56]

HE-LHC, 15 ab $ ^{-1} $ 

@ 27 TeV$ {\rm{BR}}(t\to uZ)< 2.4\times10^{-4} $ (

$ \sigma^{\mu\nu} $ )

$ {\rm{BR}}(t\to cZ)< 1.56\times 10^{-3} $ (

$ \sigma^{\mu\nu} $ )

$ {\rm{BR}}(t\to uZ)< 8.36\times10^{-4} $ (

$ \gamma^{\mu} $ )

$ {\rm{BR}}(t\to cZ)< 4.19\times 10^{-3} $ (

$ \gamma^{\mu} $ )

FCC-hh, 10 ab $ ^{-1} $ 

@ 100 TeV$ {\rm{BR}}(t\to uZ)< 8.65\times10^{-5} $ (

$ \sigma^{\mu\nu} $ )

$ {\rm{BR}}(t\to cZ)< 2.33\times 10^{-4} $ (

$ \sigma^{\mu\nu} $ )

$ {\rm{BR}}(t\to uZ)< 2.76\times10^{-4} $ (

$ \gamma^{\mu} $ )

$ {\rm{BR}}(t\to cZ)< 6.52\times 10^{-4} $ (

$ \gamma^{\mu} $ )

$ e^{-}p\to e^{-}t $ [57]

LHeC, 2 ab $ ^{-1} $ 

@ 60 GeV$ \oplus $ 7 TeV

$ {\rm{BR}}(t\to uZ)<4\times 10^{-5} $ (

$ \sigma^{\mu\nu} $ )

$ {\rm{BR}}(t\to cZ)< 6.8\times10^{-4} $ (

$ \sigma^{\mu\nu} $ )

$ {\rm{BR}}(t\to uZ)<9\times 10^{-5} $ (

$ \gamma^{\mu} $ )

$ {\rm{BR}}(t\to cZ)< 9.5\times10^{-4} $ (

$ \gamma^{\mu} $ )

$ e^{-}p\to e^{-}Wq $ + X [58]

LHeC, 3 ab $ ^{-1} $ ,

$ 2\sigma $ 

$ {\rm{BR}}(t\to qZ)<3.3\times 10^{-5} $ (

$ \sigma^{\mu\nu} $ )

FCC-he, 3 ab $ ^{-1} $ ,

$ 2\sigma $ 

$ {\rm{BR}}(t\to qZ)<4.5\times 10^{-6} $ (

$ \sigma^{\mu\nu} $ )

$ e^{+}e^{-}\to tq $ [59]

FCC-ee, 300 fb $ ^{-1} $ 

$ {\rm{BR}}(t\to qZ)< 3.12\times 10^{-5} $ (

$ \sigma^{\mu\nu} $ )

@ 350 GeV $ {\rm{BR}}(t\to qZ)< 1.22\times 10^{-4} $ (

$ \gamma^{\mu} $ )

$ e^{+}e^{-}\to tq $ [60]

ILC, 300 fb $ ^{-1} $ 

$ {\rm{BR}}(t\to qZ)< 1.9\times 10^{-3} $ (

$ \sigma^{\mu\nu} $ )

@ 500 GeV $ {\rm{BR}}(t\to qZ)< 1.8\times 10^{-3} $ (

$ \gamma^{\mu} $ )

Table 9. Projected 95% CL limits on
$ {\rm{BR}}(t\to qZ) $ ($ q = u,c $ ) from different channels at various future colliders. -
In this study, we analyzed FCNC
$ tZq $ anomalous couplings ($ q = u,c $ ) at the future HL-LHC, HE-LHC, and FCC-hh by performing a full simulation via two processes yielding trilepton signals: top quark pair production$ pp\to t\bar{t} $ with$ t\to qZ $ and the associated$ tZ $ production process$ pp\to tZ $ . We performed a full simulation for the signals and the relevant SM backgrounds based on two separate cut selections, obtaining 95% CL limits on$ {\rm{BR}}(t\to qZ) $ $ (q = u,c) $ , by exploiting trilepton final states obtained via the decay modes$ t\to b W^{+}\to b\ell^{+}\nu_{\ell} $ and$ Z\to \ell^{+}\ell^{-} $ . Altogether, these limits are nearly one or two orders of magnitude better than the current experimental results obtained from the LHC runs at 13 TeV. We therefore expect that the signatures studied here will provide competitive complementary information for detecting such FCNC$ tqZ $ anomalous couplings in future hadronic colliders at CERN.
Probing tqZ anomalous couplings in the trilepton signal at the HL-LHC, HE-LHC, and FCC-hh
- Received Date: 2020-10-13
- Available Online: 2021-04-15
Abstract: We investigate the prospect of discovering the Flavour Changing Neutral Current (FCNC)


 DownLoad: