


 Abstract
 HTML
HTML Reference
 Related
 PDF
PDF


-
The cluster radioactivity of heavy nuclei was first predicted by Sandulescu, Poenaru, and Greiner in 1980 [1]. It is usually called heavy-ion radioactivity because the emitted clusters are heavier than the
$ \alpha $ -particle and lighter than fission fragments. In 1984, cluster radioactivity was first observed by Rose and Jones through the decay of$ ^{223} $ Ra by emitting$ ^{14} $ C [2]. Since then, many clusters heavier than$ ^{14} $ C have been experimentally observed in many parent nuclei from$ ^{221} $ Fr to$ ^{242} $ Cm, such as$ ^{20} $ O,$ ^{23} $ F,$ ^{22,24-26} $ Ne,$ ^{28,30} $ Mg, and$ ^{32,34} $ Si, and the daughter nuclei are the doubly magic nucleus$ ^{208} $ Pb or its neighbors [3-7]. This implies that the shell effect plays a crucial role in cluster emitting for heavy nuclei.To describe the cluster radioactivity, various theoretical models were proposed [8-32]. Generally, these models can be divided into two categories: cluster-like model [8-16] and fission-like model [17-32]. For the cluster-like model, the cluster is assumed to be preformed in the parent nucleus before it penetrates the barrier. Concerning the fission-like model, the nucleus deforms continuously as it penetrates the nuclear barrier and reaches the scission configuration after running down the Coulomb barrier. Experimental half-lives can be approximately reproduced in a satisfactory manner by both types of models [8-32]. In addition, many scaling laws and semi-empirical relationships were developed for systematic calculations of the cluster decay half-lives [33-41].
Recently, a semi-empirical relationship for charged particles and exotic cluster radioactivity was developed by Sahu et al. based on the basic phenomenon of resonances occurring in quantum scattering process under Coulomb-nuclear potential [42]. It is usually called the Sahu formula and its form is similar to the universal decay law (UDL) proposed by Qi et al. [33, 34]. Although the coefficients are obtained naturally and the angular momentum dependence is included in the Sahu formula, there exist some deviations between the calculated half-lives of the charged particles of the parent nuclei and the experimental values. For example, the calculated
$ \alpha $ -decay half-life of$ ^{257} $ Md is 10$ ^{3} $ times as short as its corresponding experimental value. Consequently, it is necessary to improve the accuracy of the Sahu relationship by taking into account some physical factors. Recently, we proposed an improved Sahu (ImSahu) semi-empirical relationship for$ \alpha $ -decay half-lives by introducing a precise charge radius formula and an analytic expression for preformation probability [43, 44]. It is shown that the 421 experimental$ \alpha $ -decay half-lives can be reproduced accurately with the ImSahu relationship. In this study, we continued to improve the Sahu relationship for the analysis of cluster radioactivity on the basis of a recent work of ours.This article is organized as follows. Sec. II describes the theoretical approaches. In Sec. III, numerical results and discussions are presented. In the last section, some conclusions are drawn.
-
The Sahu relationship is derived by considering the metastable parent nucleus as a two-body quantum system composed of the emitted particle and the daughter nucleus exhibiting resonance scattering phenomena under the combined effect of nuclear, Coulomb, and centrifugal forces [42].
In a series of papers by Sahu [45-48], the cluster+nucleus system was considered as a Coulomb-nuclear potential scattering problem and the resonance energy of the quasibound state was taken as the
$Q _{c} $ -value (released energy) of the decaying system. The width or life-time of the resonance state accounts for the decay half-life. The normalized regular solution u(r) of the modified Schrödinger equation is matched at radius r = R with the outside Coulomb-Hankel outgoing spherical wave f(r) =$G _{l}(\eta ,kr) $ +${\rm i} F _{l}(\eta ,kr)$ such that$ u(r) = N_{0}\left[ G_{l}\left( \eta ,kR\right) + {\rm i} F_{l}\left( \eta ,kR\right) \right], $

(1) where R is the radial position outside the range of the nuclear field.
For a typical cluster – daughter system, the cluster particle serves as the projectile and the daughter nucleus as the target. The mean life T (or width
$ {\varGamma } $ ) of the decay is expressed in terms of the amplitude$N _{0} $ as$ T = \frac{\hbar }{\Gamma } = \frac{1}{\left\vert N_{0}\right\vert ^{2}}\frac{\mu }{\hbar k}, $

(2) where
$ \mu $ represents the reduced mass of the system, and k and$ \eta $ denote the wave number and Coulomb parameter, respectively.Given that the wave function u(r) decreases rapidly with the radius outside the daughter nucleus, it can be normalized by requiring that
$\displaystyle\int_{0}^{R}\left\vert u(r)\right\vert ^{2}{\rm d}r = 1$ . Furthermore, using the fact that for a sufficiently large value of radial distance, the value of$G _{l} $ (l,kR) could be several orders of magnitude larger than that of$F _{l} $ (l,kR), Eq. (2) can be expressed as$ T = \frac{\mu }{\hbar k}\frac{\left\vert G_{l}(\eta ,kR)\right\vert ^{2}}{ \left\vert u(R)\right\vert ^{2}}. $

(3) Eq. (3) gives the mean life T or half-life
$T _{1/2} $ = 0.693T of the charged particle decay. This formulation is valid for the emission of all types of positively charged particles.In the derivation of the Sahu relationship, the function
$G _{l} $ was consulted from a handbook of mathematical functions [49]. The derived details can be found in Ref. [42]. We will not present it here. The obtained expression of the Sahu relationship is written as$ \log_{10}[T_{1/2}({\texttt{s}})] = aZ_{c}Z_d\sqrt{\frac{{\cal{A}}}{Q_{c}}}+b\sqrt{{\cal{A}}Z_{c}Z_d}+c+d, $

(4) where
$ Z_{c} $ and$ Z_{d} $ are the proton numbers of the emitted cluster and daughter nucleus, respectively, and${\cal{A}} = A_{c}A_d/ (A_{c}+A_d)$ , where$ A_{c}(A_{d}) $ denotes the mass number of the emitted cluster (daughter nucleus). The coefficients a, b, c, and d in Eq. (4) are derived naturally and are different from those of the UDL formula. These parameters are expressed as follows [42]:$ a = \frac{2a_0e^2\sqrt{2m}}{\hbar \ln 10}, $

(5) $ b = \frac{-b_f\sqrt{2me^2R}}{\hbar \ln 10}, $

(6) $ c= \dfrac{\ln\left[\left(0.231\times10^{-23}\right)\sqrt{ \dfrac{mR{\cal{A}}}{ 2e^2Z_{c}Z_{d}}} \dfrac{1}{P}\right]}{\ln 10}, $

(7) $ d = \frac{{\ln M_l-\displaystyle\sum\limits_{l = 0}^lln(\eta_l)}}{\ln 10}, $

(8) where
$ \begin{aligned}[b] b_{f} =& 2+a_{0}-2a_{1}+\left(\frac{a_{0}}{4}+a_{1}-2a_{2}\right)t^{1/2} \\ & +\left(\frac{a_{0}}{8}+\frac{a_{1}}{4}+a_{2}-2a_{3}-1\right)t \\ & +\left(\frac{5a_{0}}{64}+\frac{a_{1}}{8}+\frac{a_{2}}{4}+a_{3}\right)t^{3/2}\\ &+\left(\frac{5a_{1}}{64}+\frac{a_{2}}{8}+\frac{a_{3}}{4}-\frac{1}{4}\right)t^{2} \\ & +\left(\frac{5a_{2}}{64}+ \frac{a_{3}}{8}\right)t^{5/2} \\& +\left(\frac{5a_{3}}{64}-\frac{1}{8}\right)t^{3}, \end{aligned} $

(9) $ \begin{aligned}[b] \sqrt{M_{l}} = &1+\frac{4(2l+1)^{2}-1}{16(2me^{2}RZ_{c }Z_{d}{\cal{A}} /\hbar ^{2})^{1/2}} \\ &+\frac{[4(2l+1)^{2}-1][4(2l+1)^{2}-9]}{2[16^{2}(2me^{2}RZ_{c }Z_{d} {\cal{A}}/\hbar ^{2})]} \\ &+[4(2l+1)^{2}-1][4(2l+1)^{2}-9] \\ &\times \frac{\lbrack 4(2l+1)^{2}-25]}{2[16^{3}(2me^{2}RZ_{c }Z_{d} {\cal{A}}/\hbar ^{2})^{3/2}]}, \end{aligned} $

(10) $ \eta _{l} = 1+\frac{l^{2}}{(e^{2}Z_{c }Z_{d}/\hbar )^{2}m{\cal{A}} /2Q_{c }}. $

(11) In the expression for
$ b_{f} $ ,$ t = Q_{c}R/(e^{2}Z_{c }Z_{d}) $ . Here, the nucleon mass$ m = 931.5 $ MeV,$ e^{2} = 1.4398 $ MeV fm,$ \hbar = 197.329 $ MeV fm,$ a_{0} = 1.5707288 $ ,$ a_{1} = -0.2121144 $ ,$ a_{2} = 0.074240 $ , and$ a_{3} = -0.018729 $ [49]. The parameter d is l-dependent, where l is the orbital angular momentum carried by the emitted particles. In the calculations, R is approximated as R =$r _{0}(A_{d}^{1/3}+A_{c}^{1/3})\approx $ 9.5 fm, and P is taken as$ 10^{-3} $ [42].We pointed out in previous studies that the accuracy of the Sahu formula was low because R and P are treated simply as constants [43, 44]. In a recent study of ours, R and P were assumed as the charged radius and preformation probability, respectively. Moreover, an accurate charge radius formula on R and an analytic expression for the preformation probability on P were introduced for improving the accuracy of the Sahu formula [43, 44]. Based on these recent studies [43, 44], concerning cluster radioactivity, the accurate charge radius formula and analytic preformation probability for clusters inside the parent nuclei are also introduced.
For P, an analytic expression proposed by Blendowske and Walliser, i.e., P =
$P _{\alpha }^{(A_{c}-1)/3} $ [50], is usually adopted. Considering the model dependence, the analytic expression of P is slightly modified as$ \log _{10}P = \left( \frac{A_{c}-1}{3}\right) \log _{10}P_{\alpha }+c^{\prime }, $

(12) where
$P _{\alpha } $ is the$ \alpha $ -particle preformation factor inside the parent nucleus. The second term$c ^{\prime } $ of Eq. (12) is a constant.Concerning R, it is defined as
$ R = R_d+R_c, $

(13) where
$ R_d $ and$ R_c $ are the root-mean-square charge radii of the daughter nucleus and the cluster, respectively. The form of$ R_d $ or$ R_c $ is [51]$ R_{d(c)} = r_{0}\left(1-r_{1}\frac{N_{d(c)}-Z_{d(c)}}{A_{d(c)}}+{r}_{2}\frac{ 1}{A_{d(c)}}\right){A}_{d(c)}{}^{1/3}, $

(14) where
$N _{d(c)} $ is the neutron number of the daughter nucleus or the emitted cluster, and$ r_0 $ = 1.2331 fm,$ r_1 $ = 0.1461 and$ r_2 $ = 2.3310 [51].In addition to Eq. (14), some other charged radius formulas were proposed [51-54]. To analyze the influence on the cluster radioactivity half-lives from a different radius formula, another charge radius formula that includes the Casten factor was also used in this study [51]:
$ R_{d(c)} = r_{0}\left(1-r_{1}\frac{N_{d(c)}-Z_{d(c)}}{A_{d(c)}}+{r}_{2}\frac{ 1}{A_{d(c)}}+r_{3}\frac{C}{A_{d(c)}}\right){A}_{d(c)}{}^{1/3}, $

(15) where C is the Casten factor, whose form is C =
$N _{p} $ $N _{n} $ /($N _{p} $ +$N _{n} $ ). Here$N _{p} $ and$N _{n} $ represent the valence proton number and valence neutron number, respectively. The parameters are$ r_0 $ = 1.2262 fm,$ r_1 $ = 0.1473,$ r_2 $ = 1.9876, and$ r_2 $ = 0.3993. In this study, the ImSahu formula along with Eq. (14) (Eq. (15)) is named as ImSahuA (ImSahuB) relationship. -
First, the empirical preformation factors P of clusters in nuclei were obtained from Eqs. (1-14) or Eqs. (1-13, 15) by inputting the experimental
$Q _{c} $ and half-life values. The resulting P values are listed in columns 6 and 7 of Table 1, respectively. In Table 1, columns 1 and 2 contain the parent nuclei and the emitted clusters, respectively. The l value is shown in column 3, and its effect is taken into account in the calculations. Columns 4 and 5 represent the experimental values of$Q _{c} $ and${\rm{log}} _{10}T_{1/2} $ , respectively. Note that the experimental values of$Q _{c} $ are obtained from the following expression:Parent nuclei Emitted clusters l $Q _{c} $ /MeV

${\rm{log}} _{10}T_{1/2} $ (s)

P P ${\rm{log}} _{10}T_{1/2} $ (s)

${\rm{log}} _{10}T_{1/2} $ (s)

${\rm{log}} _{10}T_{1/2} $ (s)

Expt. Expt. ImSahuA ImSahuB Sahu ImSahuA ImSahuB Even-even nuclei 212Po 4He 0 8.950 −6.52 1.63 $ \times 10^{-4} $ 

3.43 $ \times 10^{-4} $ 

−6.25 −6.21 −6.23 214Po 4He 0 7.833 −3.78 1.90 $ \times 10^{-4} $ 

4.15 $ \times 10^{-4} $ 

−3.38 −3.40 −3.41 238Pu 4He 0 5.590 9.59 6.36 $ \times 10^{-5} $ 

1.16 $ \times 10^{-4} $ 

10.14 9.49 9.41 222Ra 14C 0 33.05 11.00 1.62 $ \times 10^{-8} $ 

5.70 $ \times 10^{-8} $ 

10.42 11.32 11.70 224Ra 14C 0 30.54 15.92 3.51 $ \times 10^{-9} $ 

1.32 $ \times 10^{-8} $ 

14.92 15.58 15.99 226Ra 14C 0 28.20 21.34 5.63 $ \times 10^{-10} $ 

2.23 $ \times 10^{-9} $ 

19.78 20.20 20.64 228Th 20O 0 44.72 20.72 4.51 $ \times 10^{-11} $ 

7.38 $ \times 10^{-11} $ 

20.22 20.90 21.05 230U 22Ne 0 61.40 19.57 2.40 $ \times 10^{-12} $ 

2.52 $ \times 10^{-12} $ 

19.12 19.28 19.28 $ ^{230} $ Th

$ ^{24} $ Ne

0 57.57 24.64 1.34 $ \times 10^{-13} $ 

6.76 $ \times 10^{-13} $ 

23.46 23.90 24.61 232U 24Ne 0 62.31 20.40 3.06 $ \times 10^{-13} $ 

1.44 $ \times 10^{-12} $ 

19.50 20.02 20.70 234U 24Ne 0 58.84 25.92 1.82 $ \times 10^{-14} $ 

9.31 $ \times 10^{-14} $ 

24.28 24.31 25.03 234U 26Ne 0 59.47 25.07 2.26 $ \times 10^{-13} $ 

4.37 $ \times 10^{-13} $ 

24.93 25.36 25.69 234U 28Mg 0 74.11 25.74 7.66 $ \times 10^{-16} $ 

1.37 $ \times 10^{-15} $ 

24.22 24.36 24.70 236U 28Mg 0 71.69 27.58 5.90 $ \times 10^{-15} $ 

7.47 $ \times 10^{-15} $ 

27.35 27.09 27.27 236Pu 28Mg 0 79.67 21.67 2.25 $ \times 10^{-15} $ 

3.91 $ \times 10^{-15} $ 

20.46 20.76 21.08 238Pu 28Mg 0 75.91 25.70 1.38 $ \times 10^{-15} $ 

2.48 $ \times 10^{-15} $ 

24.88 24.57 24.91 238Pu 32Si 0 91.19 25.28 2.49 $ \times 10^{-16} $ 

1.38 $ \times 10^{-15} $ 

25.13 25.02 25.92 236U 30Mg 0 72.51 27.58 5.17 $ \times 10^{-15} $ 

5.11 $ \times 10^{-15} $ 

27.67 27.83 27.95 238Pu 30Mg 0 77.00 25.67 6.80 $ \times 10^{-16} $ 

6.73 $ \times 10^{-16} $ 

24.87 25.04 25.16 242Cm 34Si 0 96.51 23.15 4.04 $ \times 10^{-16} $ 

2.13 $ \times 10^{-15} $ 

23.69 23.90 24.81 Odd-A nuclei 213Po 4He 0 8.540 −5.37 1.04 $ \times 10^{-4} $ 

2.21 $ \times 10^{-4} $ 

−5.27 −5.06 −5.14 215At 4He 0 8.178 −4.00 7.59 $ \times 10^{-5} $ 

1.60 $ \times 10^{-4} $ 

−3.98 −3.82 −3.91 221Fr 14C 3 31.32 14.52 8.93 $ \times 10^{-10} $ 

3.24 $ \times 10^{-9} $ 

12.70 14.46 14.53 221Ra 14C 3 32.40 13.39 1.10 $ \times 10^{-9} $ 

3.95 $ \times 10^{-9} $ 

11.67 13.42 13.48 223Ra 14C 4 31.83 15.20 1.74 $ \times 10^{-10} $ 

6.35 $ \times 10^{-10} $ 

12.78 14.43 14.50 225Ac 14C 4 30.48 17.34 1.97 $ \times 10^{-9} $ 

6.92 $ \times 10^{-9} $ 

16.23 17.62 17.68 231Pa 23F 1 51.84 26.02 5.72 $ \times 10^{-15} $ 

2.77 $ \times 10^{-14} $ 

22.96 24.99 25.11 231Pa 24Ne 1 60.42 23.38 6.12 $ \times 10^{-15} $ 

2.94 $ \times 10^{-14} $ 

20.77 22.84 22.96 233U 24Ne 2 60.49 24.82 1.97 $ \times 10^{-15} $ 

9.96 $ \times 10^{-15} $ 

21.98 23.79 23.91 235U 24Ne 1 57.36 27.42 6.01 $ \times 10^{-14} $ 

3.19 $ \times 10^{-13} $ 

26.51 27.88 28.03 233U 25Ne 2 60.78 24.83 2.77 $ \times 10^{-15} $ 

7.60 $ \times 10^{-15} $ 

22.34 24.42 24.28 235U 25Ne 3 57.76 27.42 7.58 $ \times 10^{-14} $ 

2.19 $ \times 10^{-13} $ 

26.82 28.45 28.33 235U 26Ne 3 58.11 27.45 8.20 $ \times 10^{-14} $ 

1.61 $ \times 10^{-13} $ 

27.09 28.98 28.68 Table 1. Preformation factors P of the cluster radioactivity obtained in the calculations of the present study and calculated cluster radioactivity half-lives within the Sahu, ImSahuA, and ImSahuB relationships. The P values and half-lives of
$ \alpha $ -decay are calculated by a method used in a recent study of ours on the Sahu formula [43, 44].$Q _{c} $ and${\rm{log}} _{10}T_{1/2} $ are measured in MeV and second, respectively.$ Q_{c} = M-(M_{d}+M_{c}), $

(16) where M,
$M _{d} $ , and$M _{c} $ represent the mass excesses of the parent nucleus, daughter nucleus, and emitted particle, respectively. The experimental nuclear mass excesses were taken from Ref. [55]. The experimental half-lives were taken from NUBASE2016 Table [56] and NNDC [57].Note in Table 1 that the P values obtained from the ImSahuA relationship and those obtained from the ImSahuB relationship are different because of the differences in the input of the charge radius formulas. It indicates that the P values are dependent on the charge radius to a certain extent, which is consistent with the calculations performed by Qian et al. [58]. Furthermore, it is necessary to point out that the P values strongly depend on the theoretical models. Relevant studies suggested that the P value differences from different models amount to several orders of magnitude [14, 15, 58-61].
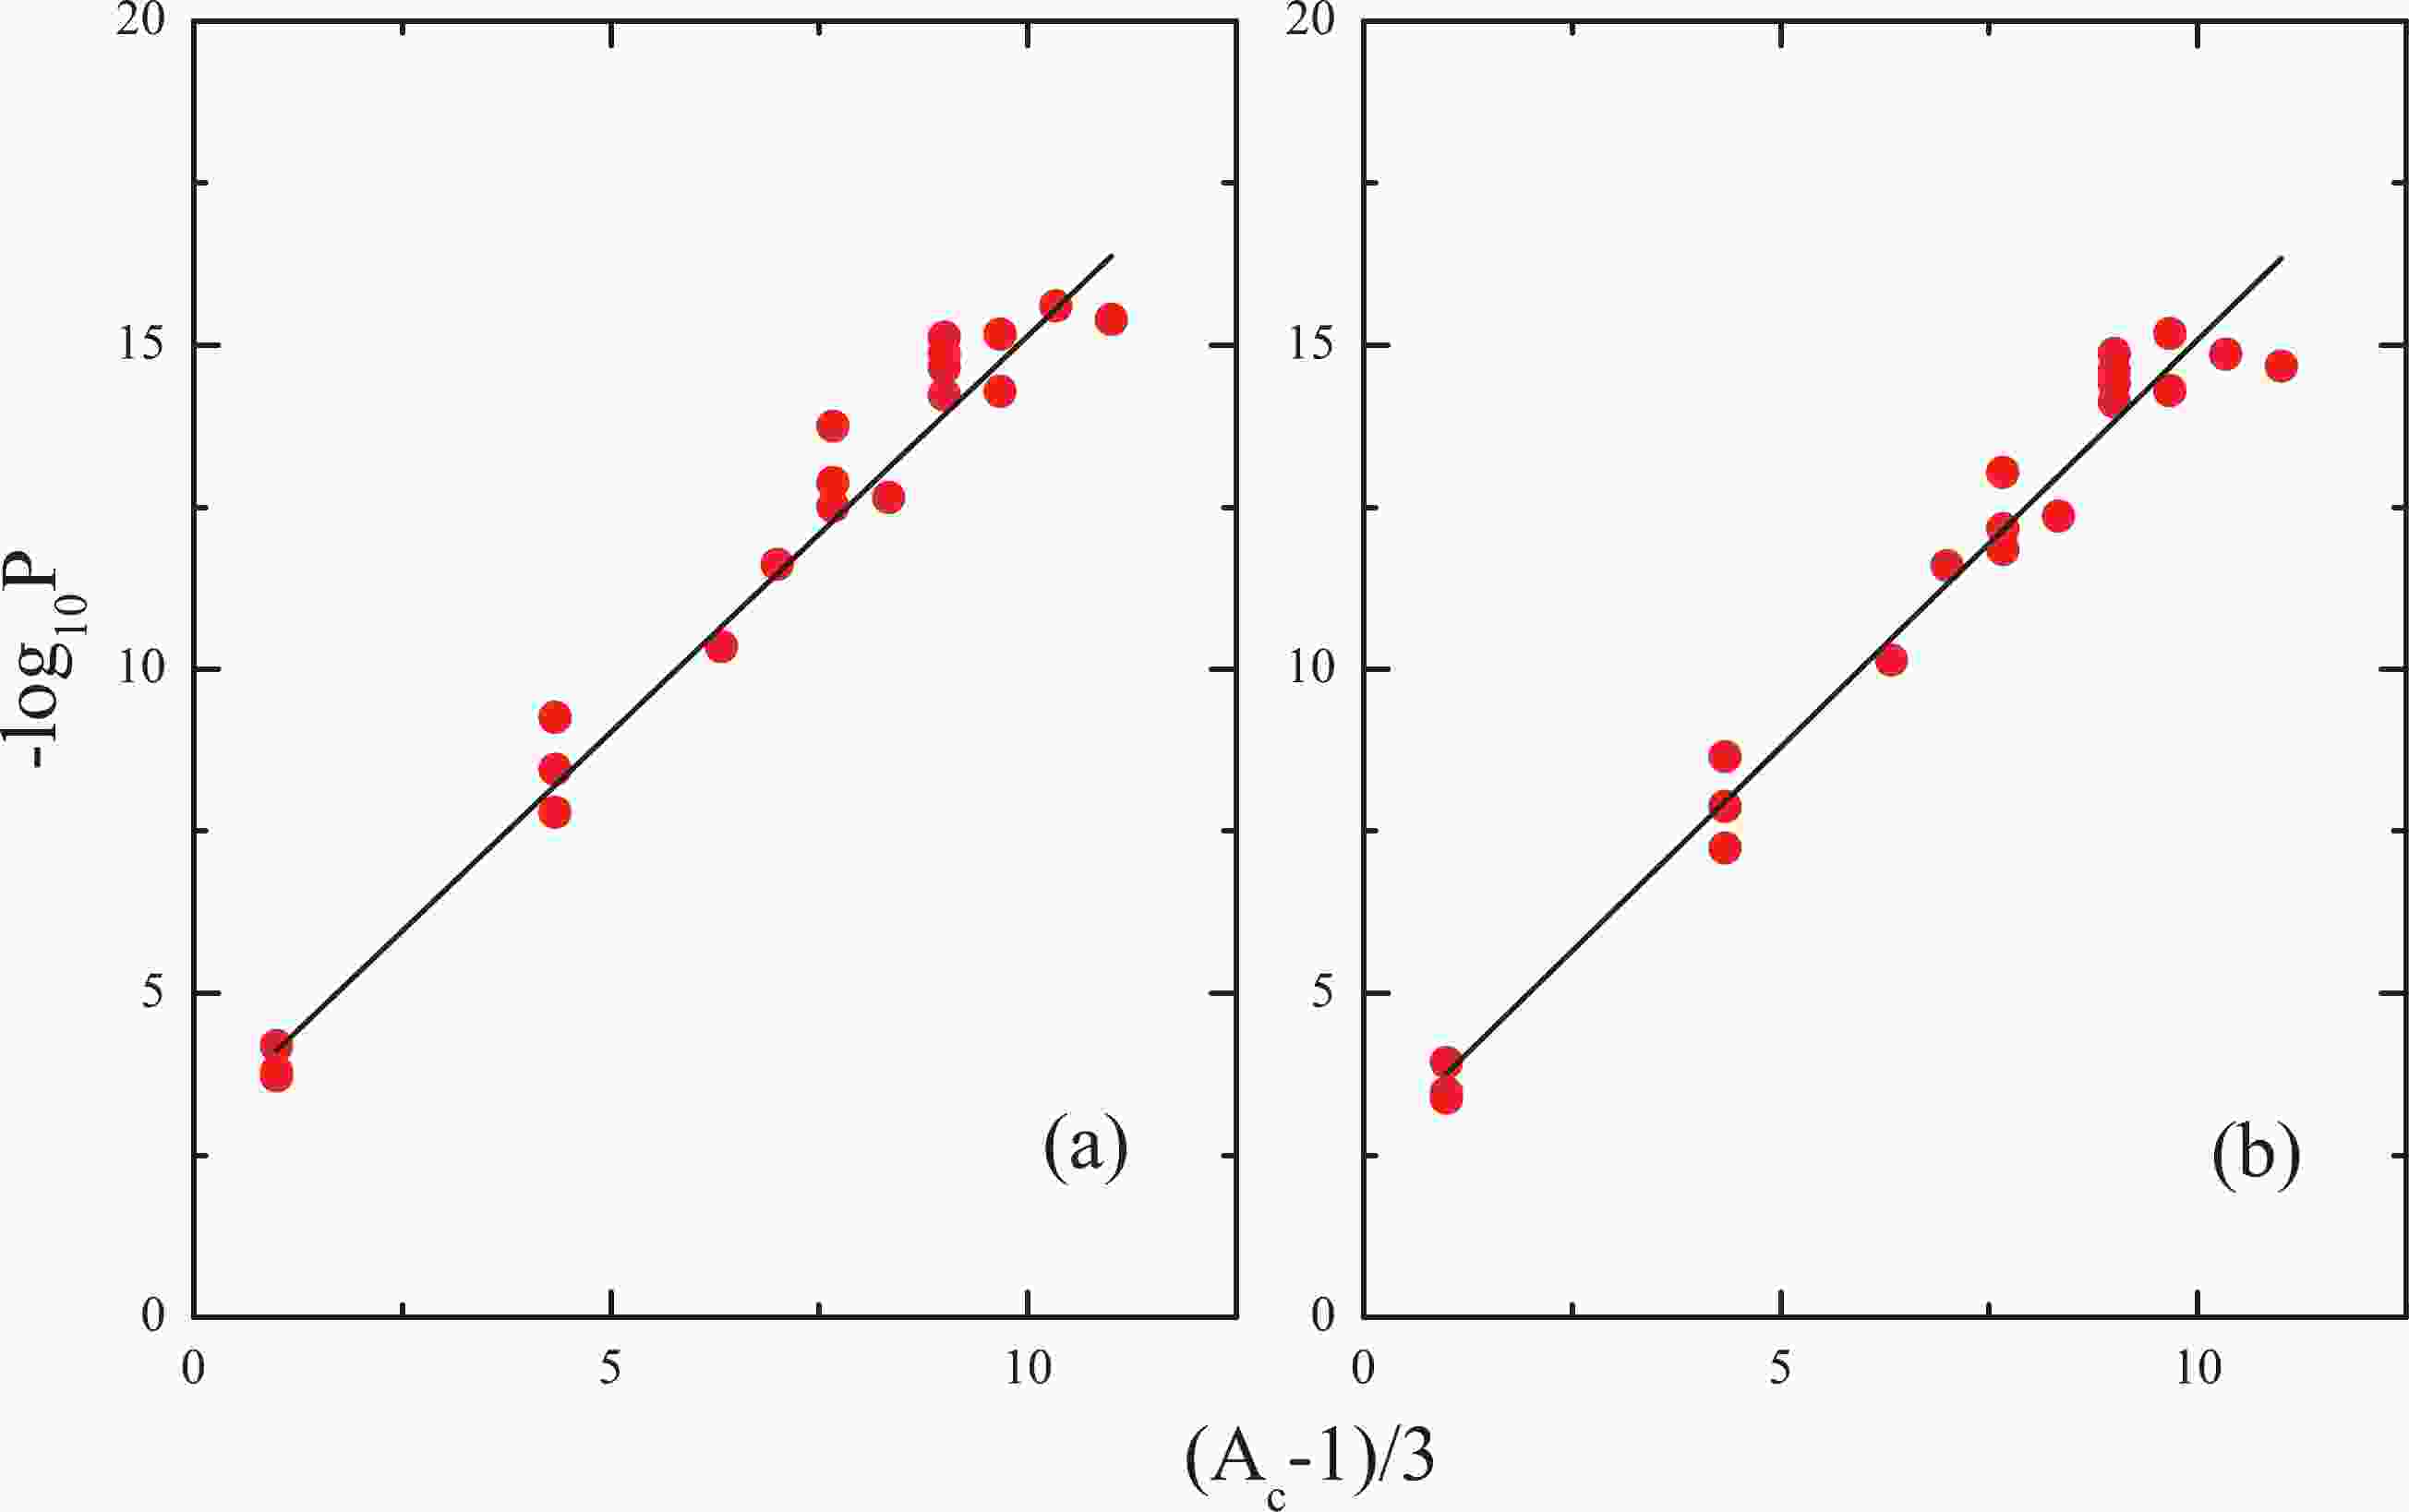
As can be observed from Eq. (12),
${\rm{log}} _{10} P$ will be linear with ($A _{c} $ -1)/3 if${\rm{log}} _{10} $ $P _{\alpha } $ is assumed to be a constant.$P _{\alpha } $ may be the average preformation probability of$ \alpha $ -particle for different nuclei. In Fig. 1, we plot -${\rm{log}} _{10} P$ versus ($A _{c} $ -1)/3 for even-even (e-e) parent nuclei. According to Eq. (12), a best fitting line with$P _{\alpha } $ = 0.0624, depicted in Fig. 1 (a), is obtained. For Fig. 1 (b), the obtained$P _{\alpha } $ value is 0.0552. The$P _{\alpha } $ values were determined in previous relevant studies [14, 15, 60, 61]. The$P _{\alpha } $ values within a generalized liquid drop model (GLDM) and a unified fission model (UFM) were 0.0290 [14] and 0.0338 [15], respectively. Following a systematic study on the correlation between the$ \alpha $ -decay and cluster radioactivity, the resulting$P _{\alpha } $ value, reported by Poenaru et al., was 0.0161 [60]. Bhattacharya and Gangopadhyay determined the$P _{\alpha } $ within the DDM3Y1 model combining the relativistic mean field model, whose value was 0.0193 [61]. Therefore, the obtained$P _{\alpha } $ values of our study are comparable to those of the other models.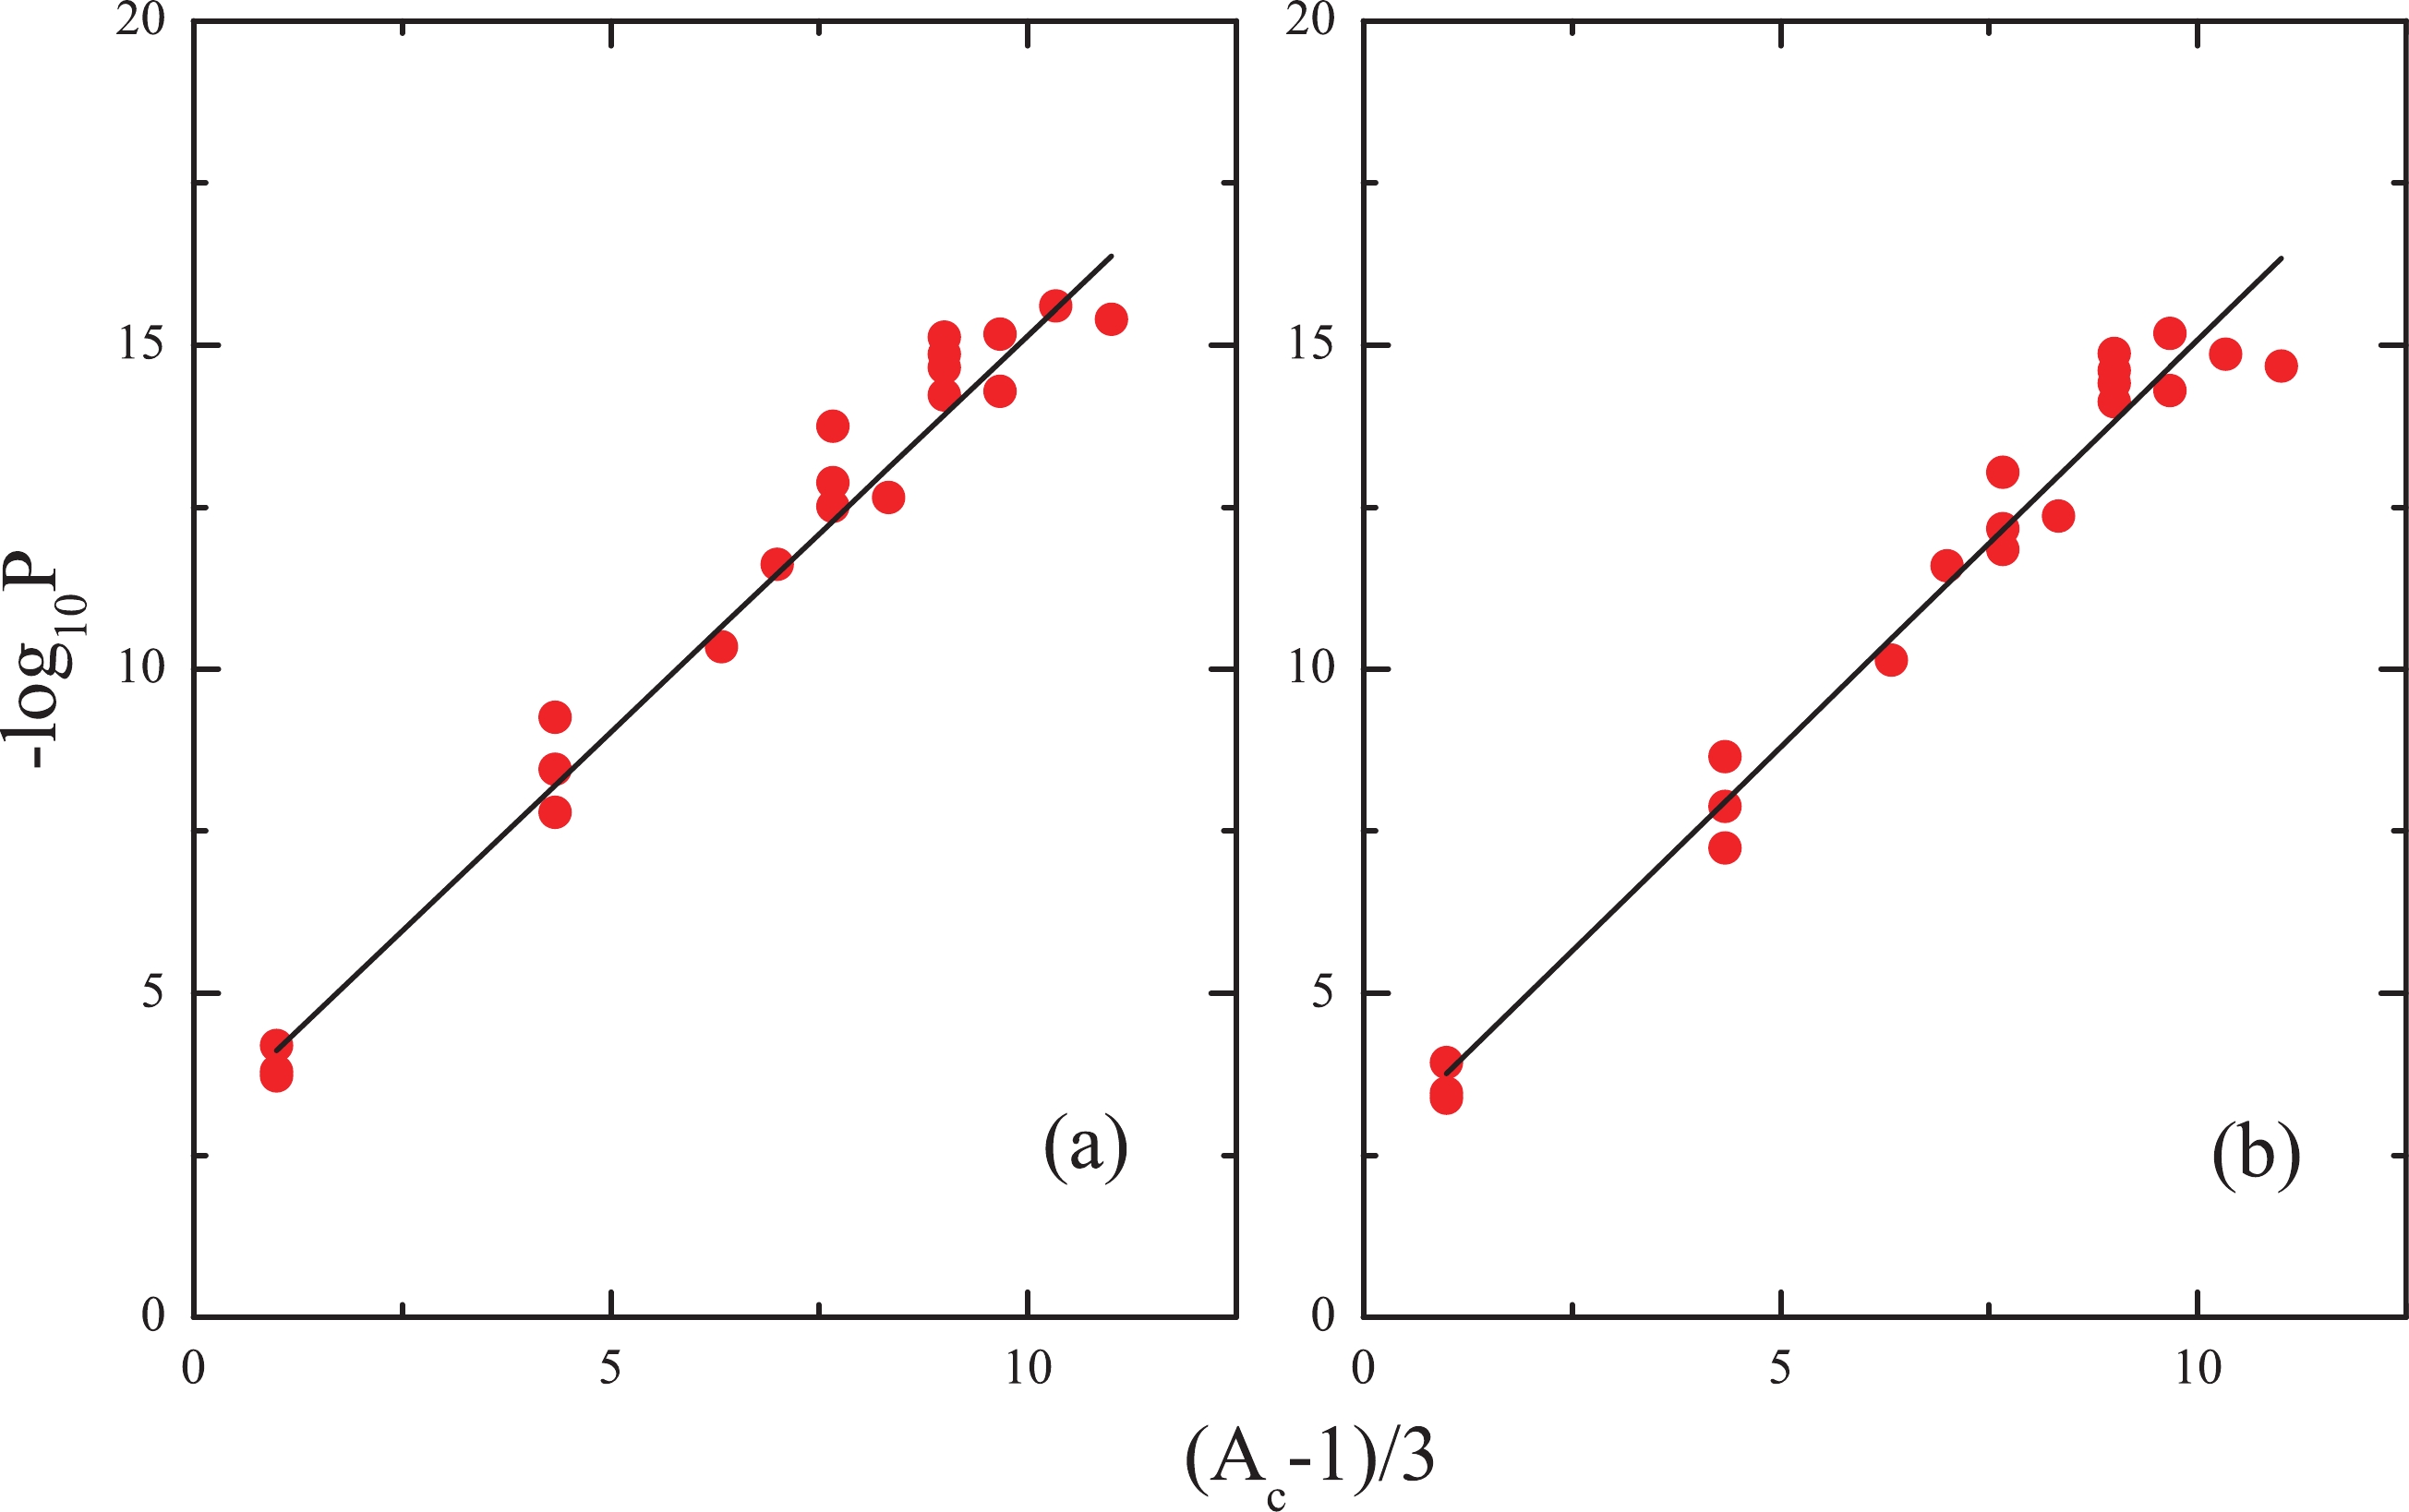
Figure 1. (color online) Negative of the logarithm of the preformation factor (-
${\rm{log}} _{10} P$ ) for e-e parent nuclei as a function of ($A _{c} $ -1)/3. The left and right panels refer to the cases of the ImSahuA and ImSahuB relationships, respectively.Using the same method, our study can be extended to the case of odd-A parent nuclei. The empirical
${-\rm{log}} _{10} P$ values as functions of ($A _{c} $ -1)/3 for the odd-A parent nuclei and the best fitting lines are shown in Fig. 2. The obtained$P _{\alpha } $ values by the ImSahuA and ImSahuB relationships are 0.0392 and 0.0414, respectively. The two values are close to the corresponding$P _{\alpha } $ values within the GLDM, i.e., 0.0214 [14], within the UFM, i.e., 0.0262 [15], and from Ref. [61], i.e., 0.0135.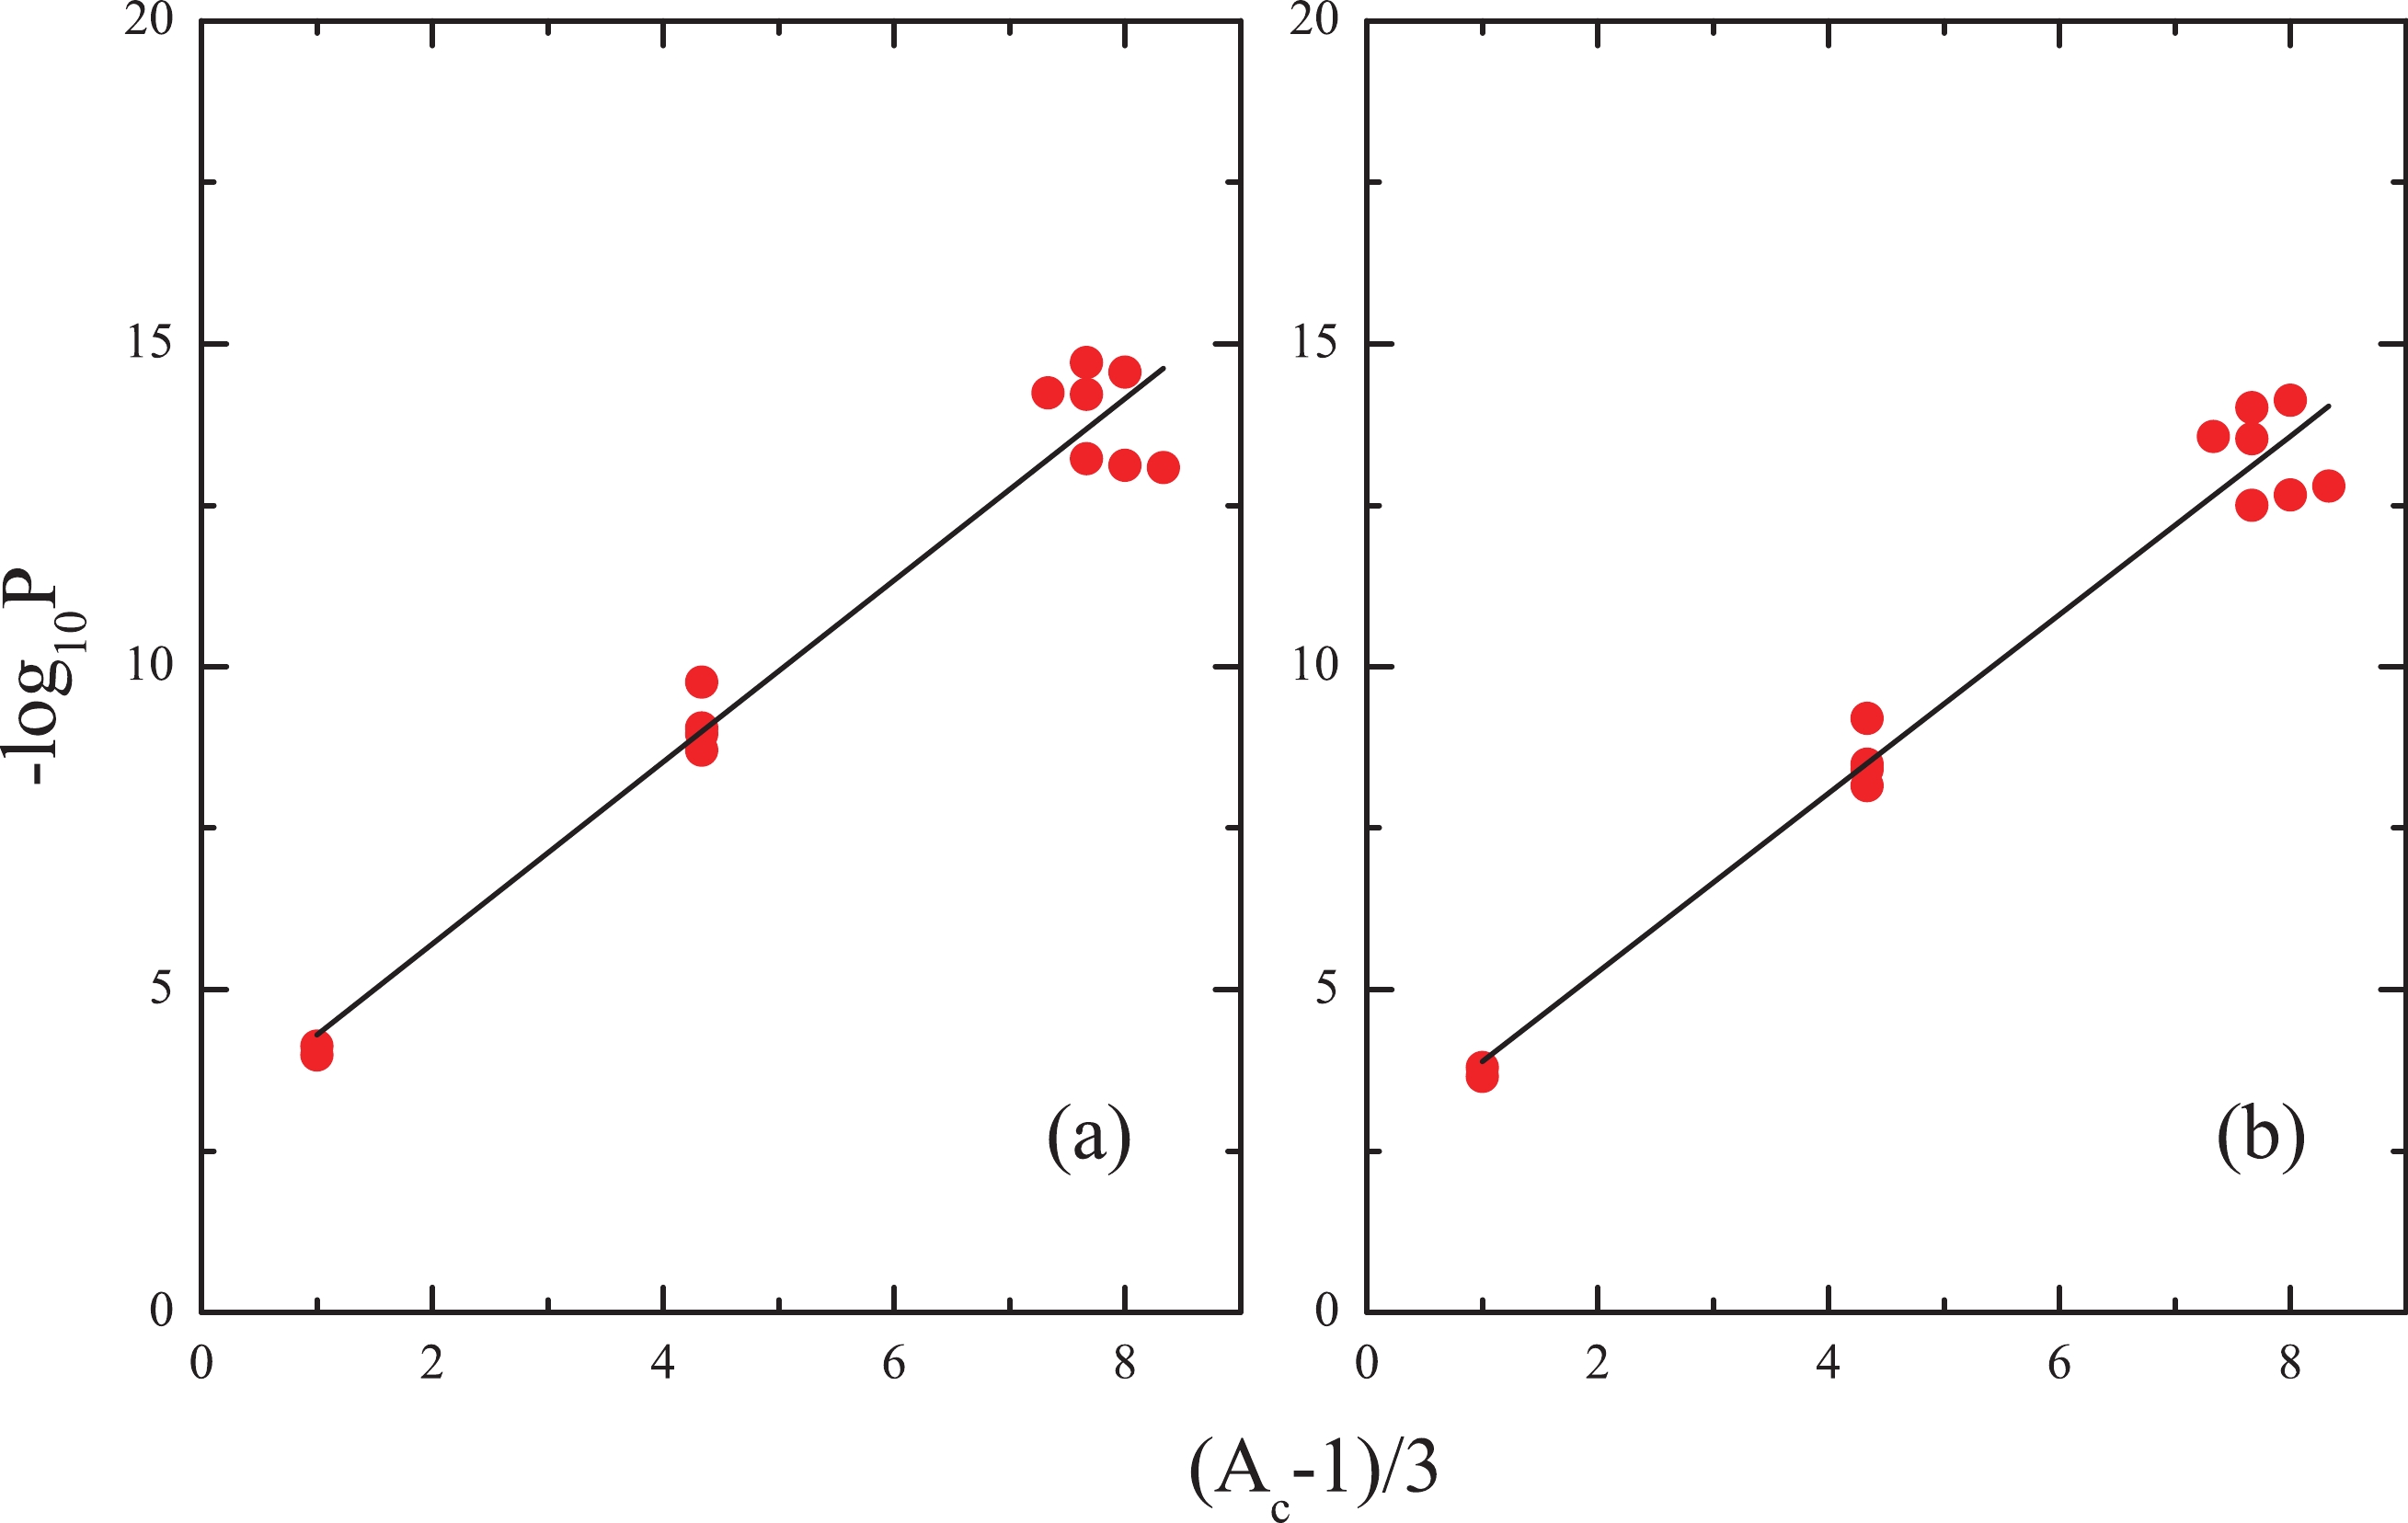
Figure 2. (color online) Same plots as in Fig. 1, but for the odd-A parent nuclei.
Using Eqs. (1-14) and Eqs. (1-13, 15) by inputting the fitting
$P _{\alpha } $ values, the cluster radioactivity half-lives for the nuclei in the trans-lead region were calculated. The calculated half-lives are listed in the last two columns of Table 1. For comparison with the values provided by the Sahu formula, the half-lives obtained from the Sahu formula are also given in column 8. Compared with the half-lives provided by the Sahu formula, note that the half-lives calculated from the ImSahuA and ImSahuB relationships are closer to the experimental ones. This indicates that the accuracy of the Sahu relationship is improved by using the accurate charge radius formulas and fitting expressions of the cluster preformation probability.To analyze the global deviation between the experimental and calculated half-lives intuitively, the
${\rm{log}} _{10} $ HF (${\rm{log}} _{10} $ HF =${\rm{log}} _{10}\dfrac{T_{\rm Cal.}}{T_{\rm Expt.}} = \log _{10}T_{\rm cal.}-\log_{10}T_{\rm Expt.}$ ) values as a function of the neutron number N for 28 parent nuclei, 17 e-e nuclei, and 11 odd-A nuclei are plotted in Fig. 3. Generally, it is assumed that if the${\rm{log}} _{10} $ HF value is within a factor of 1.0, the calculated half-lives will be in agreement with the experimental data [62-64]. Note from Fig. 3 that the accuracies of the ImSahuA and ImSahuB relationships are improved evidently. To show the global deviation quantitatively, the average deviation$ \bar{\delta} $ and standard deviation$ \sqrt{\bar{\delta^2}} $ were calculated. The$ \bar{\delta} $ and$ \sqrt{\bar{\delta^2}} $ values for 28 (n = 28; n denotes the numbers of nuclei) heavy nuclei as well as e-e and odd-A subsets of the full data set using the three empirical formulas are listed in Table 2. Note from Table 2 that the$ \bar{\delta} $ and$ \sqrt{\bar{\delta^2}} $ values of the total, e-e, and odd-A nuclei within the ImSahuA and ImSahuB formulas are much smaller than those within the Sahu formula. It suggests that the accuracies of the ImSahuA and ImSahuB formulas become higher, which is consistent with the conclusions from Fig. 3. Therefore, the reasonableness of Eq. (12) was tested by the high accuracies of the two new relationships and the calculated$P _{\alpha } $ values. In addition, by comparing the${\rm{log}} _{10} $ HF distributions ($ \bar{\delta} $ values or$ \sqrt{\bar{\delta^2}} $ values) between the ImSahuA and the ImSahuB relationships in Fig. 3 (Table 2), it is easy to conclude that the accuracy of the ImSahuB formula is higher than that of the ImSahuA formula given that Eq. (15) is more precise than Eq. (14). This indicates that an accurate charge radius formula is important for estimating the cluster decay half-lives.
Figure 3. (color online) The
${\rm{log}} _{10} $ HF values as a function of N for (a) 28 parent nuclei, (b) e-e nuclei, and (c) odd-A nuclei.Formulas $ \bar{\delta} $ 

$ \sqrt{\bar{\delta^2}} $ 

Total (n = 28) e-e (n = 17) odd-A (n = 11) Total (n = 28) e-e (n = 17) odd-A (n = 11) Sahu 1.048 0.726 1.543 1.351 0.870 1.863 ImSahuA 0.592 0.594 0.589 0.729 0.728 0.733 ImSahuB 0.536 0.534 0.539 0.650 0.649 0.652 Table 2. Values of
$ \bar{\delta} $ and$ \sqrt{\bar{\delta^2}} $ between the experimental and calculated cluster radioactivity half-lives for 28 heavy nuclei as well as for e-e and odd-A subsets of the full data set using the Sahu, ImSahuA, and ImSahuB relationships.For the cluster radioactivity of some heavy nuclei, only the lower limit of the half-lives were measured. Thus, the experimental cluster radioactivity half-lives with lower limit constituted the ground to test the ImSahuA and ImSahuB relationships. The experimental half-lives and the calculated ones according to the Sahu, ImSahuA, and ImSahuB formulas are listed in Table 3 (columns 5-8) . In Table 3, the parent nuclei, emitted clusters, l values, and experimental
$Q _{c} $ values are shown on the first four columns. The experimental$Q _{c} $ values and half-lives were taken from the same references as in Table 1. To analyze the agreement between the experimental half-lives and calculated ones clearly, the half-lives within the Sahu, ImSahuA, and ImSahuB relationships, and the corresponding experimental half-lives with lower limit are shown in Fig. 4. Note from Fig. 4 that the half-lives of most parent nuclei are enhanced after the modification, except for the half-lives of the$ ^{24} $ Ne emission from$ ^{236} $ U and the$ ^{28} $ Mg emission from$ ^{232} $ U. Concerning the$ ^{24} $ Ne radioactivity of$ ^{236} $ U, its half-life within the ImSahuA relationship decreases compared to the half-life within the Sahu relationship. However, the half-life within the ImSahuB relationship is lower than that within the Sahu one with respect to the$ ^{28} $ Mg radioactivity of$ ^{232} $ U. Nevertheless, the calculated half-lives are larger than the corresponding experimental lower limit. In addition, note in Fig. 4 and Table 3 that for the decays of$ ^{232} $ Th$ \longrightarrow ^{208} $ Hg+$ ^{24} $ Ne,$ ^{233} $ U$ \longrightarrow ^{205} $ Hg+$ ^{28} $ Mg, and$ ^{235} $ U$ \longrightarrow ^{207} $ Hg+$ ^{28} $ Mg, although the half-lives within the Sahu relationship are not in agreement with the experimental ones, the half-lives estimated by the ImSahuA and ImSahuB relationships are larger than, or closer to, the lower limit of the experimental half-lives. Thus, according to the above analysis, it can be concluded that the experimental half-lives in Table 3 can be better reproduced by the ImSahuA and ImSahuB relationships. The validity of the two new relationships is then tested again. Regarding the accuracies of the ImSahuA and ImSahuB relationships, it is difficult to determine which one is higher according to the current experimental data.Parent nuclei Emitted clusters l $Q _{c} $ /MeV

${\rm{log}} _{10}T_{1/2} $ (s)

${\rm{log}} _{10}T_{1/2} $ (s)

${\rm{log}} _{10}T_{1/2} $ (s)

${\rm{log}} _{10}T_{1/2} $ (s)

Expt. Expt. Sahu ImSahuA ImSahuB $ ^{226} $ Th

$ ^{14} $ C

0 30.67 >15.30 16.54 16.96 17.32 $ ^{226} $ Th

$ ^{18} $ O

0 45.73 >16.80 16.76 17.25 17.45 $ ^{232} $ Th

$ ^{24} $ Ne

0 54.50 >29.20 28.22 28.23 28.82 $ ^{230} $ U

$ ^{24} $ Ne

0 61.55 >18.20 20.47 20.98 21.67 $ ^{236} $ U

$ ^{24} $ Ne

0 55.95 >25.90 28.71 28.33 29.08 $ ^{232} $ Th

$ ^{26} $ Ne

0 55.97 >29.20 30.38 30.47 30.82 $ ^{236} $ U

$ ^{26} $ Ne

0 56.75 >25.90 29.16 29.17 29.51 $ ^{232} $ U

$ ^{28} $ Mg

0 74.32 >22.26 23.92 24.19 23.09 $ ^{233} $ U

$ ^{28} $ Mg

3 74.23 >27.59 24.14 26.15 24.36 $ ^{235} $ U

$ ^{28} $ Mg

1 72.20 >28.10 26.68 28.34 27.92 $ ^{237} $ Np

$ ^{30} $ Mg

2 74.82 >27.60 26.19 28.31 27.69 $ ^{240} $ Pu

$ ^{34} $ Si

0 91.03 >25.52 26.51 26.61 27.55 $ ^{241} $ Am

$ ^{34} $ Si

3 93.93 >24.41 24.96 27.35 27.44 Table 3. Calculated cluster radioactivity half-lives within the Sahu, ImSahuA, and ImSahuB relationships, for those cases in which the experimental half-lives with lower limit were measured.
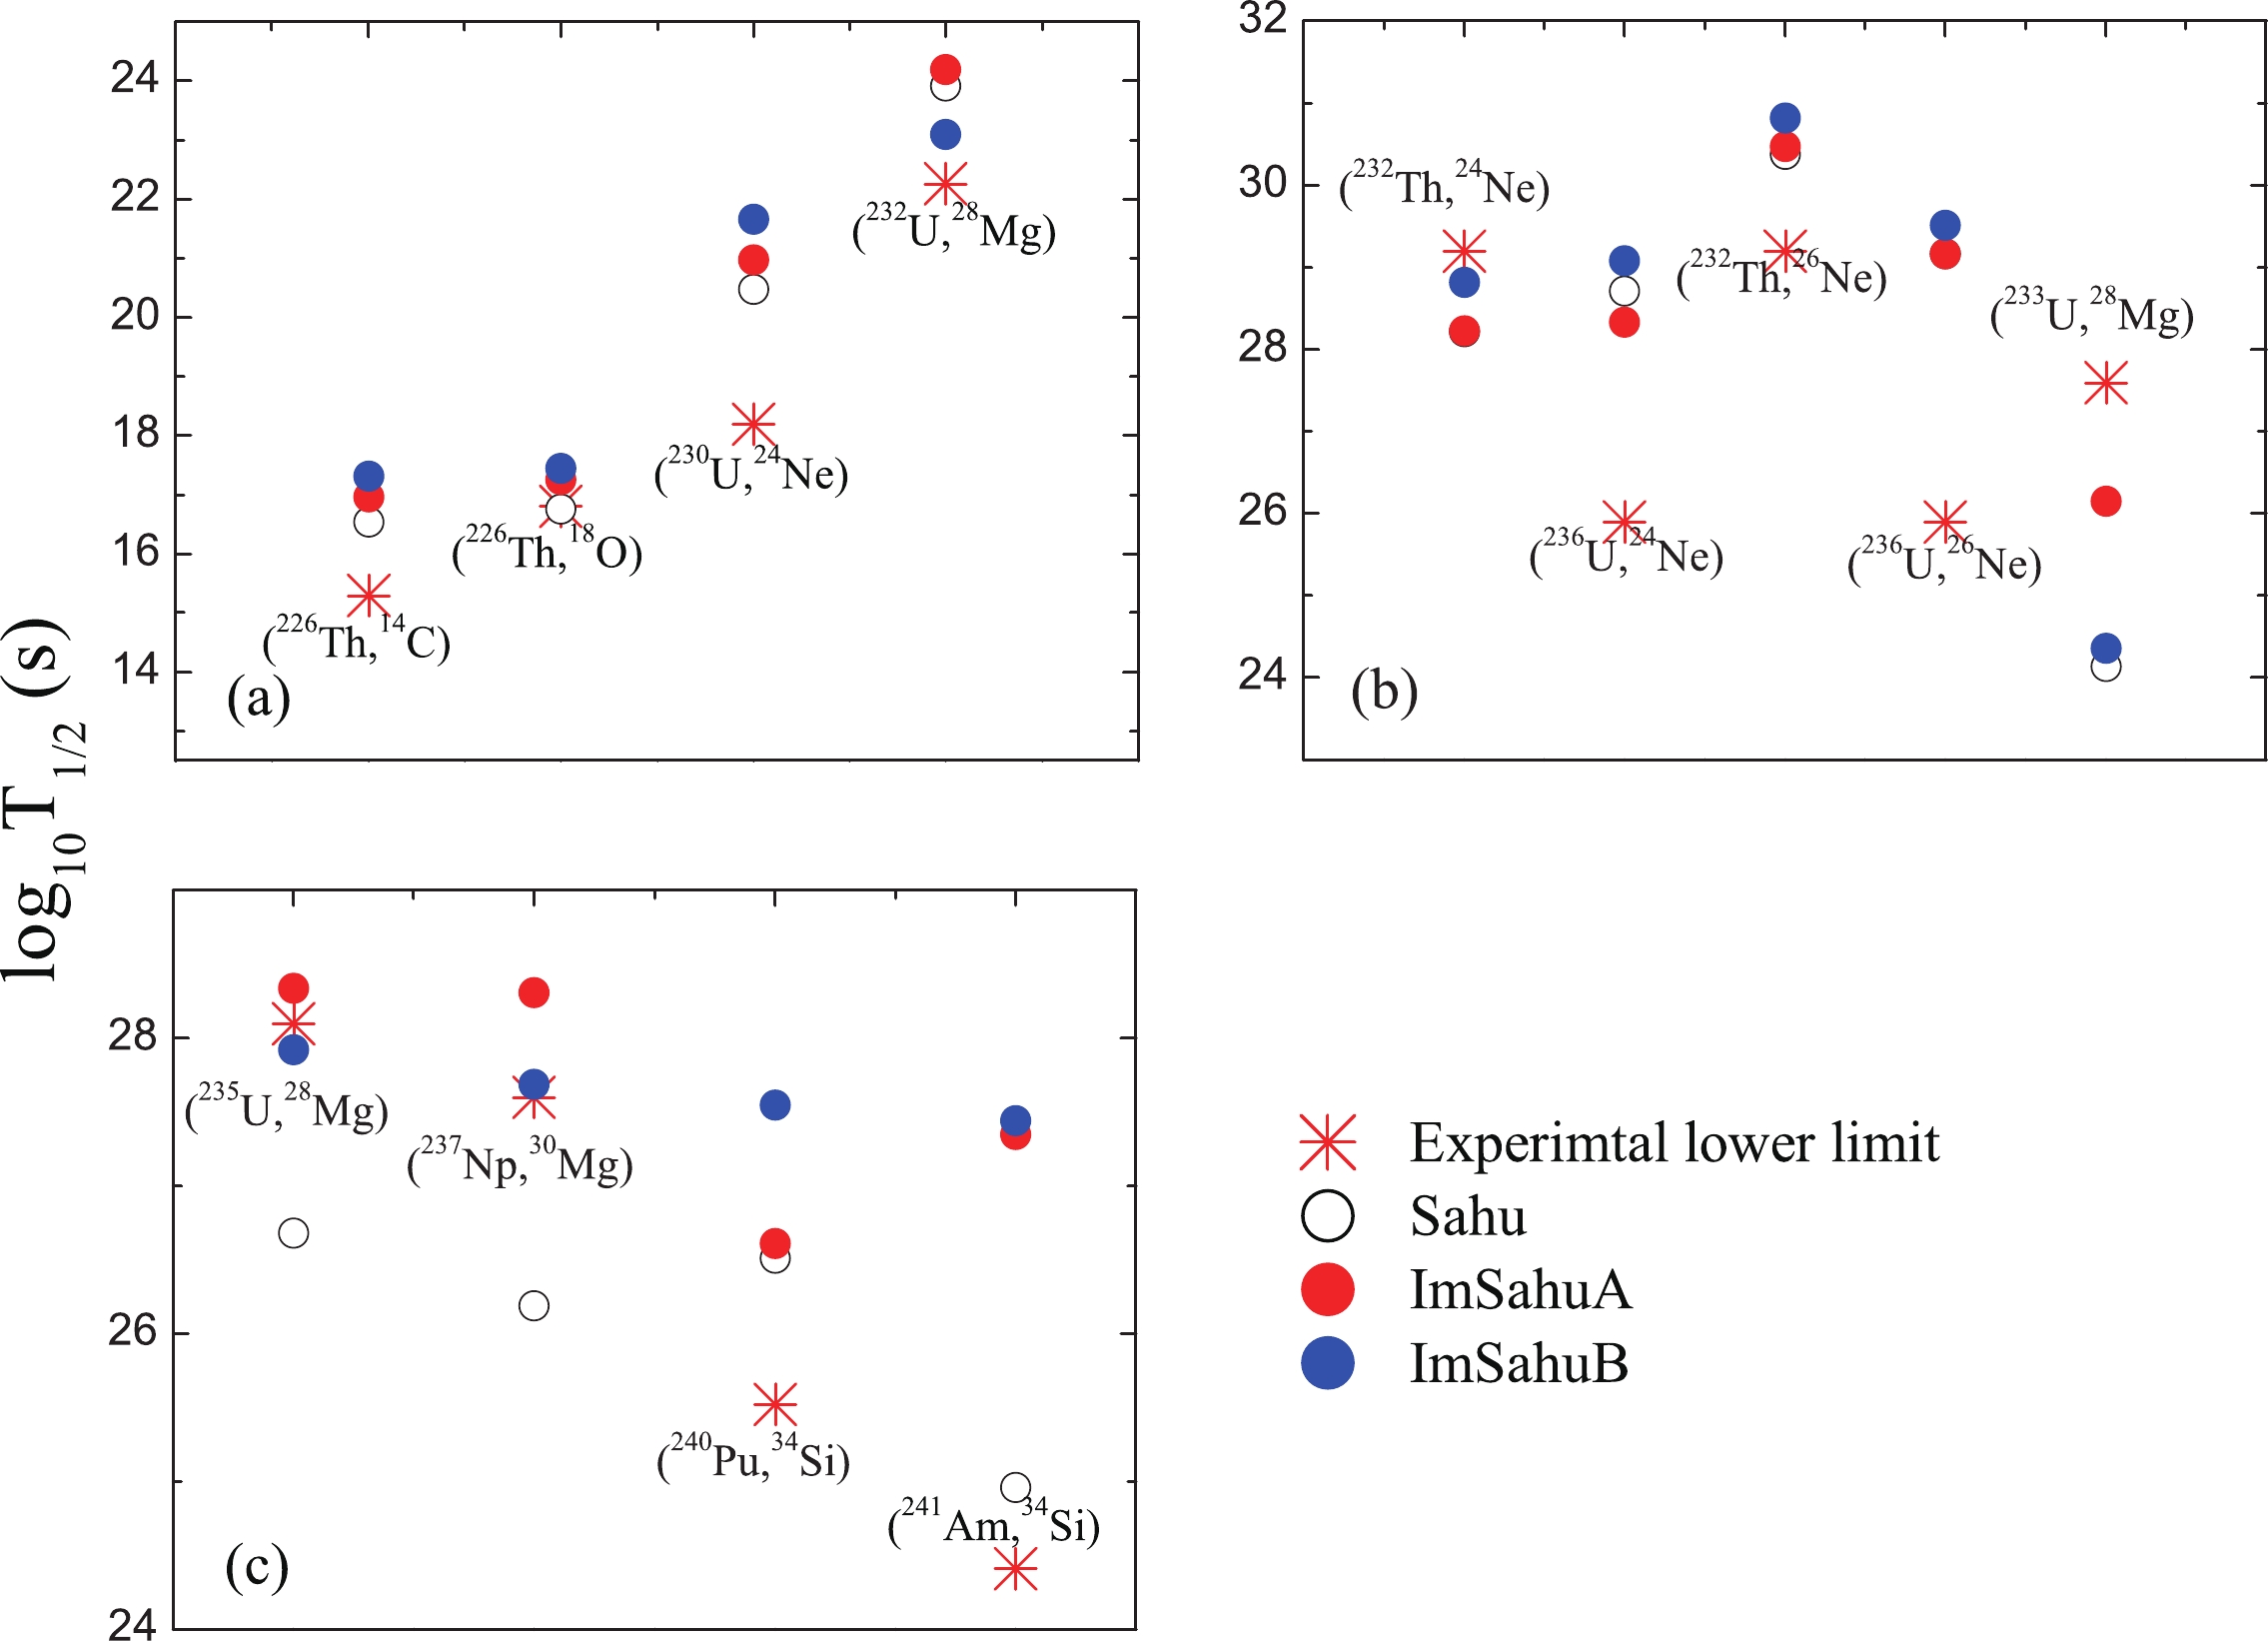
Figure 4. (color online) Comparison between the cluster radioactivity half-lives within the Sahu, ImSahuA, and ImSahuB relationships and the corresponding experimental lower limit.
Encouraged by the good agreement between the experimental half-lives and the calculations within the ImSahuA and ImSahuB formulas, we attempted to predict the cluster radioactivity half-lives that have not been measured yet for the nuclei in the trans-lead region. A relevant prior study suggested that the l effect on the cluster decay half-life is very small because the centrifugal potential is much smaller than that of the Coulomb potential [15]. To show the influence on the cluster emission half-life visibly, and taking the decays of
$ ^{221} $ Fr$ \longrightarrow ^{207} $ Tl+$ ^{14} $ C and$ ^{233} $ U$ \longrightarrow ^{209} $ Pb+$ ^{24} $ Ne as examples, the logarithms of half-lives within the ImSahuA and ImSahuB relationships as functions of l are plotted in Fig. 5. Note from Fig. 5 that it is easy to conclude that the l effect is not so important for the cluster decay half-life. Thus, the l contribution was not taken into account in the subsequent predictions. From the ImSahuA and ImSahuB formulas, the predicted half-lives of$ ^{8} $ Be,$ ^{12,14} $ C,$ ^{15} $ N,$ ^{16-20} $ O,$ ^{20-26} $ Ne,$ ^{24-28} $ Mg and,$ ^{30-34} $ Si radioactivity are shown in Table 4; these values are helpful for searching for new cluster emitters in future experiments.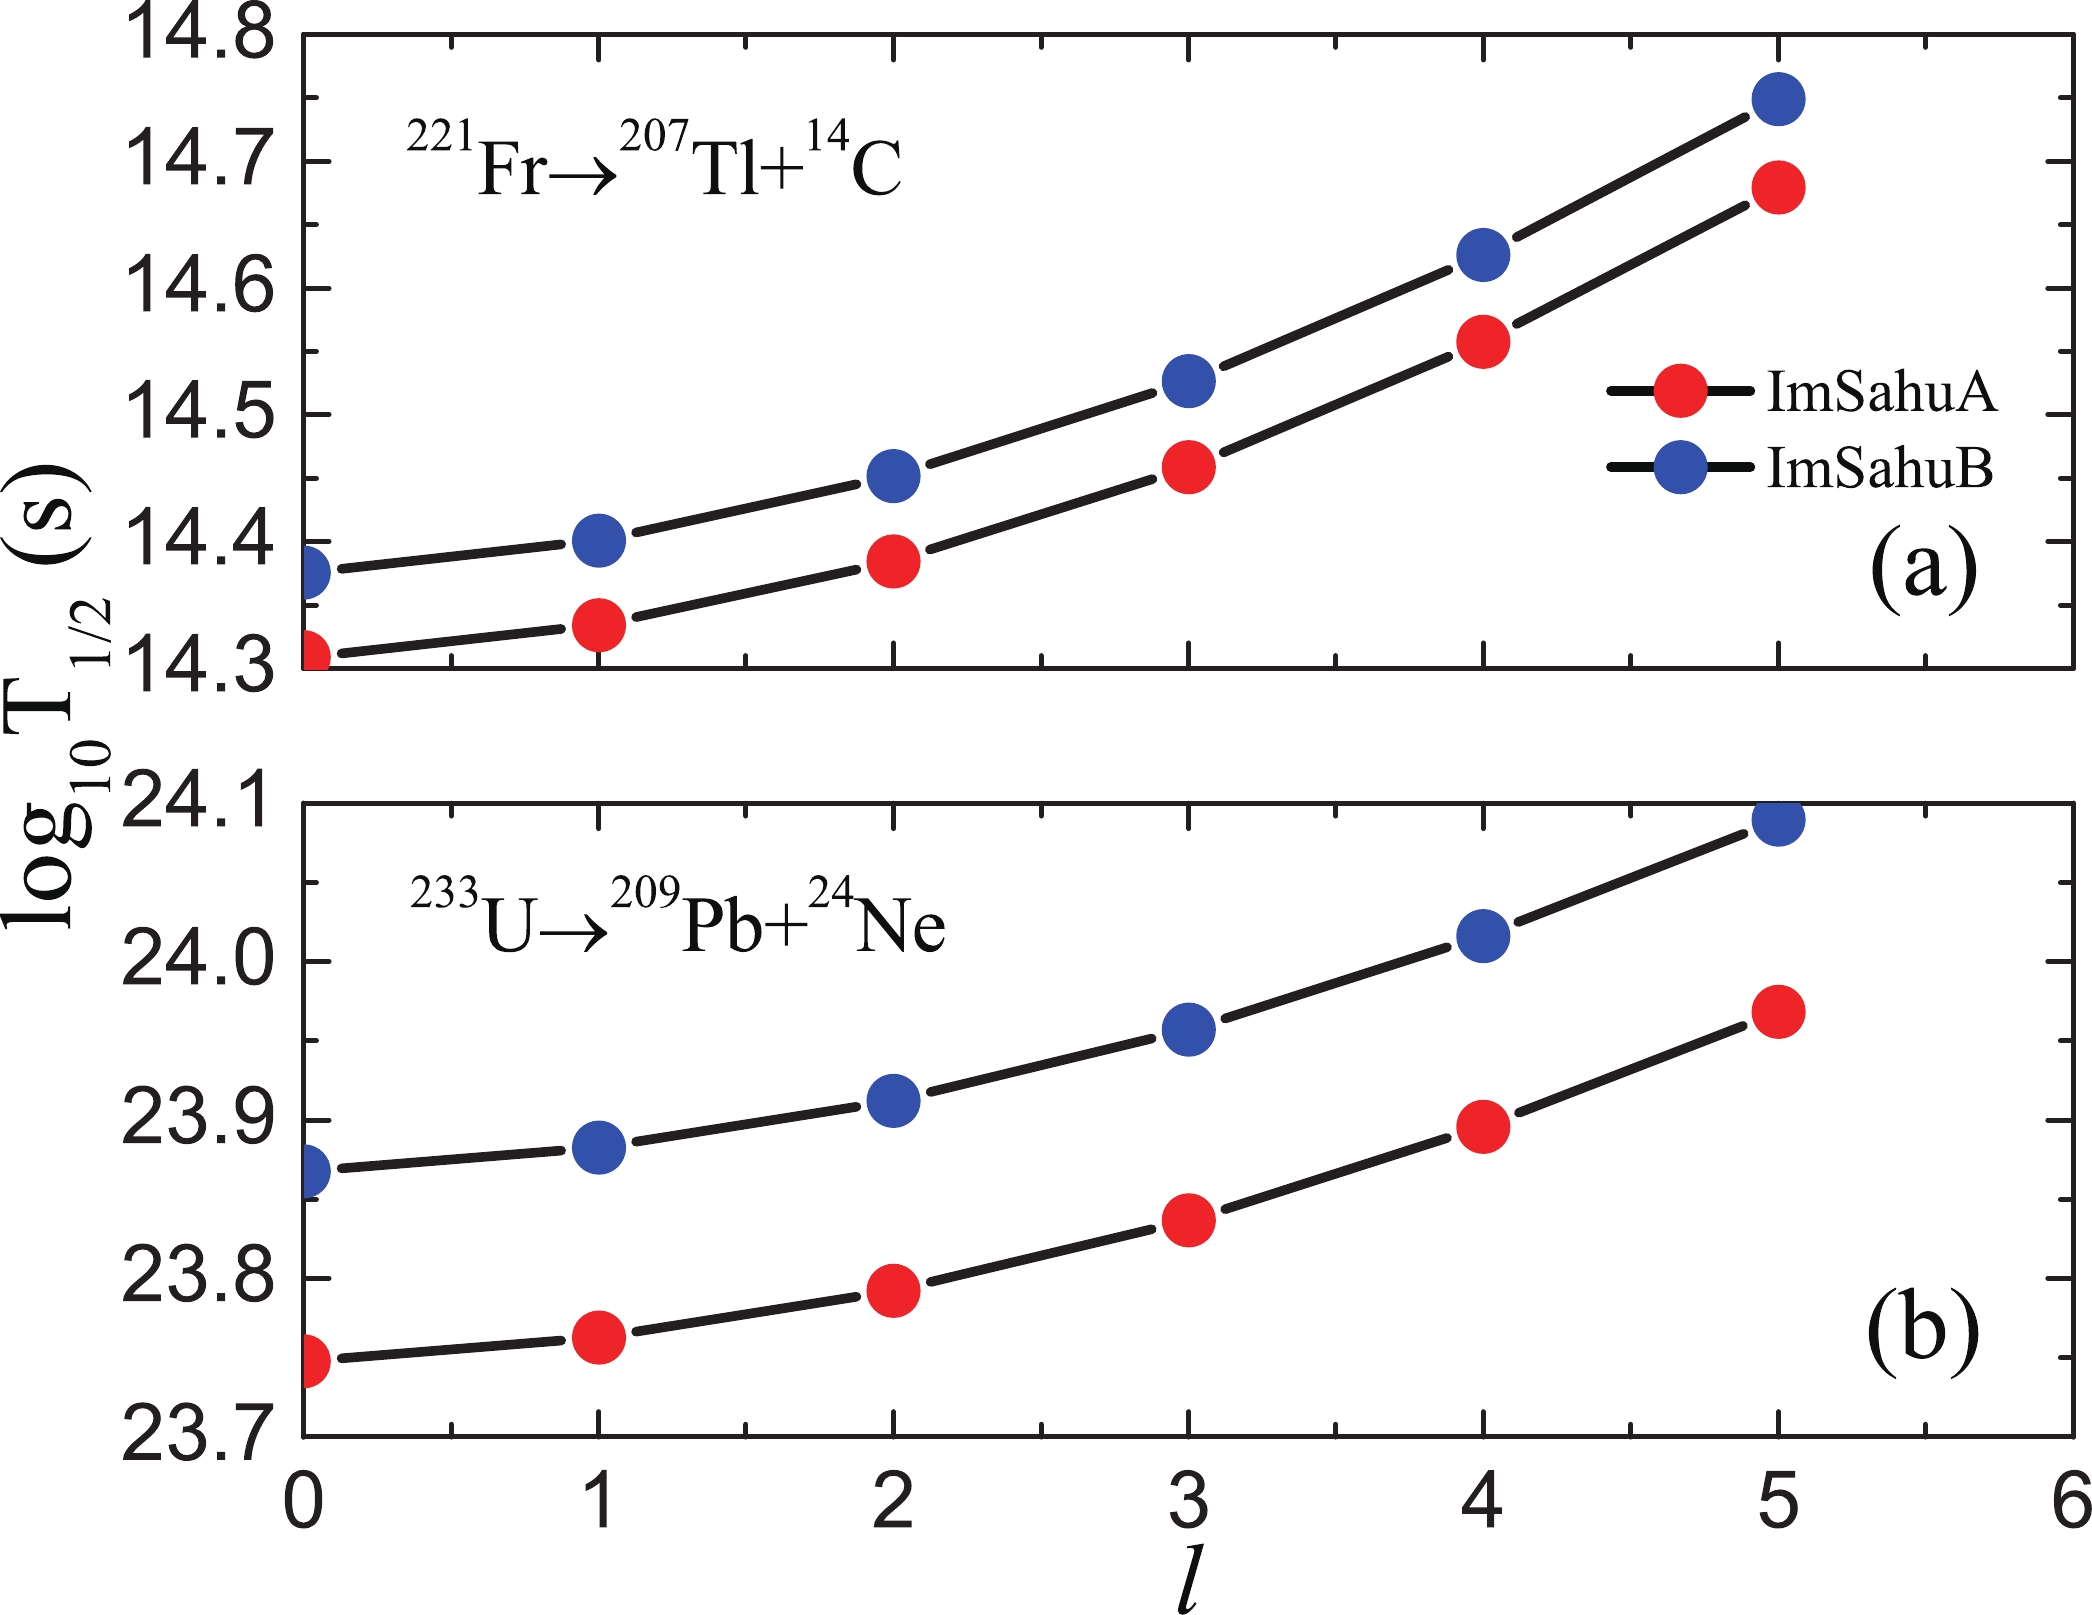
Figure 5. (color online) Logarithms of the half-lives for
$ ^{221} $ Fr$ \longrightarrow ^{207} $ Tl+$ ^{14} $ C, and$ ^{233} $ U$ \longrightarrow ^{209} $ Pb+$ ^{24} $ Ne versus l within the ImSahuA and ImSahuB relationships.Parent nuclei Emitted clusters $Q _{c} $ /MeV

${\rm{log}} _{10}T_{1/2} $ (s)

${\rm{log}} _{10}T_{1/2} $ (s)

Parent nuclei Emitted clusters $Q _{c} $ /MeV

${\rm{log}} _{10}T_{1/2} $ (s)

${\rm{log}} _{10}T_{1/2} $ (s)

Expt. ImSahuA ImSahuB Expt. ImSahuA ImSahuB $ ^{213} $ At

$ ^{8} $ Be

12.30 24.14 23.11 $ ^{221} $ Ac

$ ^{16} $ O

43.08 18.92 17.91 $ ^{214} $ At

$ ^{8} $ Be

13.93 17.54 16.70 $ ^{222} $ Ac

$ ^{16} $ O

43.61 17.10 16.47 $ ^{215} $ At

$ ^{8} $ Be

14.84 15.09 14.80 $ ^{223} $ Ac

$ ^{16} $ O

43.60 18.10 18.23 $ ^{216} $ At

$ ^{8} $ Be

14.07 17.05 16.90 $ ^{224} $ Ac

$ ^{16} $ O

41.72 19.92 20.38 $ ^{217} $ At

$ ^{8} $ Be

13.10 20.92 20.56 $ ^{225} $ Ac

$ ^{16} $ O

40.02 23.72 23.75 $ ^{214} $ Rn

$ ^{8} $ Be

14.52 16.34 16.22 $ ^{222} $ Th

$ ^{16} $ O

45.73 15.04 15.53 $ ^{215} $ Rn

$ ^{8} $ Be

16.34 11.54 11.25 $ ^{223} $ Th

$ ^{16} $ O

46.57 14.91 15.01 $ ^{216} $ Rn

$ ^{8} $ Be

17.06 9.25 9.13 $ ^{224} $ Th

$ ^{16} $ O

46.48 14.00 14.48 $ ^{217} $ Rn

$ ^{8} $ Be

16.33 11.54 11.24 $ ^{225} $ Th

$ ^{16} $ O

44.66 17.44 17.56 $ ^{218} $ Rn

$ ^{8} $ Be

15.00 14.78 14.66 $ ^{226} $ Th

$ ^{16} $ O

42.66 19.36 19.87 $ ^{215} $ Fr

$ ^{8} $ Be

15.43 14.74 14.41 $ ^{223} $ Pa

$ ^{16} $ O

47.11 15.07 15.11 $ ^{216} $ Fr

$ ^{8} $ Be

16.90 10.28 10.12 $ ^{224} $ Pa

$ ^{16} $ O

47.47 13.58 14.00 $ ^{217} $ Fr

$ ^{8} $ Be

17.63 8.97 8.68 $ ^{225} $ Pa

$ ^{16} $ O

47.34 14.73 14.83 $ ^{218} $ Fr

$ ^{8} $ Be

16.91 10.22 10.08 $ ^{226} $ Pa

$ ^{16} $ O

45.56 16.05 16.51 $ ^{219} $ Fr

$ ^{8} $ Be

15.54 14.37 14.05 $ ^{227} $ Pa

$ ^{16} $ O

43.43 20.12 20.22 $ ^{217} $ Fr

$ ^{12} $ C

28.14 17.24 16.40 $ ^{223} $ Ac

$ ^{18} $ O

42.43 22.51 21.10 $ ^{218} $ Fr

$ ^{12} $ C

29.31 14.24 13.67 $ ^{224} $ Ac

$ ^{18} $ O

43.27 20.00 19.03 $ ^{219} $ Fr

$ ^{12} $ C

29.65 14.34 14.43 $ ^{225} $ Ac

$ ^{18} $ O

43.45 20.83 20.61 $ ^{220} $ Fr

$ ^{12} $ C

28.23 16.24 16.57 $ ^{226} $ Ac

$ ^{18} $ O

41.84 22.25 22.40 $ ^{221} $ Fr

$ ^{12} $ C

26.92 19.65 19.67 $ ^{227} $ Ac

$ ^{18} $ O

40.28 26.07 25.74 $ ^{218} $ Ra

$ ^{12} $ C

30.44 13.02 13.39 $ ^{224} $ Th

$ ^{18} $ O

44.56 19.00 19.21 $ ^{219} $ Ra

$ ^{12} $ C

31.85 11.40 11.47 $ ^{225} $ Th

$ ^{18} $ O

45.54 18.68 18.46 $ ^{220} $ Ra

$ ^{12} $ C

32.02 10.36 10.71 $ ^{226} $ Th

$ ^{18} $ O

45.73 17.25 17.45 $ ^{221} $ Ra

$ ^{12} $ C

30.58 13.45 13.54 $ ^{227} $ Th

$ ^{18} $ O

44.20 20.61 20.39 $ ^{222} $ Ra

$ ^{12} $ C

29.05 15.45 15.83 $ ^{228} $ Th

$ ^{18} $ O

42.28 22.48 22.70 $ ^{219} $ Ac

$ ^{12} $ C

31.62 12.50 12.53 $ ^{225} $ Pa

$ ^{18} $ O

45.18 20.15 19.87 $ ^{220} $ Ac

$ ^{12} $ C

32.61 10.16 10.46 $ ^{226} $ Pa

$ ^{18} $ O

45.69 18.24 18.38 $ ^{221} $ Ac

$ ^{12} $ C

32.78 10.62 10.69 $ ^{227} $ Pa

$ ^{18} $ O

45.87 19.09 18.87 $ ^{222} $ Ac

$ ^{12} $ C

31.41 12.04 12.38 $ ^{228} $ Pa

$ ^{18} $ O

44.50 19.95 20.13 $ ^{223} $ Ac

$ ^{12} $ C

29.69 15.79 15.86 $ ^{229} $ Pa

$ ^{18} $ O

42.54 24.19 23.94 $ ^{219} $ Fr

$ ^{14} $ C

29.65 14.34 14.43 $ ^{225} $ Ac

$ ^{20} $ O

41.66 26.28 24.70 $ ^{220} $ Fr

$ ^{14} $ C

28.23 16.24 16.57 $ ^{226} $ Ac

$ ^{20} $ O

42.77 23.08 21.99 $ ^{222} $ Fr

$ ^{14} $ C

25.63 21.80 22.05 $ ^{227} $ Ac

$ ^{20} $ O

43.09 23.80 23.47 $ ^{223} $ Fr

$ ^{14} $ C

24.46 25.36 25.31 $ ^{228} $ Ac

$ ^{20} $ O

41.85 24.59 24.68 $ ^{220} $ Ra

$ ^{14} $ C

32.02 10.36 10.71 $ ^{229} $ Ac

$ ^{20} $ O

40.54 28.20 27.75 $ ^{225} $ Ra

$ ^{14} $ C

25.20 24.44 24.58 $ ^{226} $ Th

$ ^{20} $ O

43.19 23.42 23.58 $ ^{221} $ Ac

$ ^{14} $ C

32.78 10.62 10.69 $ ^{227} $ Th

$ ^{20} $ O

44.46 22.61 22.28 $ ^{222} $ Ac

$ ^{14} $ C

31.41 12.04 12.38 $ ^{228} $ Th

$ ^{20} $ O

44.72 20.89 21.05 $ ^{223} $ Ac

$ ^{14} $ C

29.69 15.79 15.86 $ ^{229} $ Th

$ ^{20} $ O

43.40 24.25 23.93 Continued on next page Table 4. Predicted cluster radioactivity half-lives within the ImSahuA and ImSahuB relationships. All the
$Q _{c} $ values were calculated from Eq. (16). In the calculations, the mass excesses were taken from Ref. [55]; “#” means that only the empirical mass excesses for the parent and/or daughter nuclei were reported in Ref. [55].Table 4 – continued from previous page Parent nuclei Emitted clusters $Q _{c} $ /MeV

${\rm{log}} _{10}T_{1/2} $ (s)

${\rm{log}} _{10}T_{1/2} $ (s)

Parent nuclei Emitted clusters $Q _{c} $ /MeV

${\rm{log}} _{10}T_{1/2} $ (s)

${\rm{log}} _{10}T_{1/2} $ (s)

Expt. ImSahuA ImSahuB Expt. ImSahuA ImSahuB $ ^{224} $ Ac

$ ^{14} $ C

28.35 17.60 17.95 $ ^{230} $ Th

$ ^{20} $ O

41.79 25.71 25.87 $ ^{220} $ Ra

$ ^{15} $ N

33.99 21.28 20.66 $ ^{227} $ Pa

$ ^{20} $ O

43.09 25.88 25.49 $ ^{221} $ Ra

$ ^{15} $ N

35.12 20.12 19.15 $ ^{228} $ Pa

$ ^{20} $ O

44.00 23.06 23.15 $ ^{222} $ Ra

$ ^{15} $ N

35.25 18.91 19.38 $ ^{229} $ Pa

$ ^{20} $ O

44.36 23.72 23.40 $ ^{223} $ Ra

$ ^{15} $ N

33.88 22.35 22.42 $ ^{230} $ Pa

$ ^{20} $ O

43.17 24.38 24.51 $ ^{224} $ Ra

$ ^{15} $ N

32.37 24.40 24.78 $ ^{231} $ Pa

$ ^{20} $ O

41.49 28.60 28.24 $ ^{221} $ Ac

$ ^{15} $ N

38.21 15.89 15.99 $ ^{225} $ Pa

$ ^{20} $ Ne

55.20 25.44 23.80 $ ^{222} $ Ac

$ ^{15} $ N

38.97 13.77 14.21 $ ^{226} $ Pa

$ ^{20} $ Ne

55.33 23.96 22.79 $ ^{223} $ Ac

$ ^{15} $ N

39.47 13.96 14.04 $ ^{227} $ Pa

$ ^{20} $ Ne

54.91 25.79 25.49 $ ^{224} $ Ac

$ ^{15} $ N

37.75 15.59 16.04 $ ^{228} $ Pa

$ ^{20} $ Ne

52.72 27.70 27.81 $ ^{225} $ Ac

$ ^{15} $ N

36.26 18.94 19.05 $ ^{229} $ Pa

$ ^{20} $ Ne

50.58 32.34 31.90 $ ^{222} $ Th

$ ^{15} $ N

37.16 17.47 17.88 $ ^{226} $ U

$ ^{20} $ Ne

58.16 21.29 21.45 $ ^{223} $ Th

$ ^{15} $ N

38.15 16.78 16.82 $ ^{227} $ U

$ ^{20} $ Ne

58.54 22.05 21.74 $ ^{224} $ Th

$ ^{15} $ N

38.15 15.82 16.27 $ ^{228} $ U

$ ^{20} $ Ne

58.01 21.41 21.58 $ ^{225} $ Th

$ ^{15} $ N

37.00 18.59 18.68 $ ^{229} $ U

$ ^{20} $ Ne

55.87 25.51 25.20 $ ^{226} $ Th

$ ^{15} $ N

34.96 21.23 21.68 $ ^{230} $ U

$ ^{20} $ Ne

53.39 27.79 27.98 $ ^{227} $ Np

$ ^{20} $ Ne

59.66 21.70 21.31 $ ^{231} $ Np

$ ^{26} $ Mg

75.66 23.88 22.58 $ ^{228} $ Np

$ ^{20} $ Ne

59.51 20.57 20.67 $ ^{232} $ Np

$ ^{\#} $ 

$ ^{26} $ Mg

75.83 21.99 21.32 $ ^{229} $ Np

$ ^{20} $ Ne

59.08 22.35 22.04 $ ^{233} $ Np

$ ^{26} $ Mg

75.20 24.31 24.44 $ ^{230} $ Np

$ ^{20} $ Ne

57.07 23.65 23.79 $ ^{234} $ Np

$ ^{26} $ Mg

72.92 25.11 25.82 $ ^{231} $ Np

$ ^{20} $ Ne

54.53 28.50 28.15 $ ^{235} $ Np

$ ^{26} $ Mg

70.90 29.14 29.15 $ ^{227} $ Pa

$ ^{22} $ Ne

58.68 23.07 21.22 $ ^{232} $ Pu

$ ^{26} $ Mg

78.36 20.51 21.26 $ ^{228} $ Pa

$ ^{22} $ Ne

59.20 20.96 19.65 $ ^{233} $ Pu

$ ^{26} $ Mg

78.72 21.82 21.92 $ ^{229} $ Pa

$ ^{22} $ Ne

58.96 22.65 22.12 $ ^{234} $ Pu

$ ^{26} $ Mg

78.31 20.50 21.25 $ ^{230} $ Pa

$ ^{22} $ Ne

56.95 23.83 23.76 $ ^{235} $ Pu

$ ^{26} $ Mg

76.01 24.50 24.64 $ ^{231} $ Pa

$ ^{22} $ Ne

55.09 27.82 27.15 $ ^{236} $ Pu

$ ^{26} $ Mg

73.84 25.16 25.96 $ ^{228} $ U

$ ^{22} $ Ne

61.03 19.77 19.77 $ ^{233} $ Am

$ ^{\#} $ 

$ ^{26} $ Mg

79.53 22.08 22.11 $ ^{229} $ U

$ ^{22} $ Ne

61.69 20.38 19.85 $ ^{234} $ Am

$ ^{\#} $ 

$ ^{26} $ Mg

79.55 20.35 21.02 $ ^{231} $ U

$ ^{22} $ Ne

59.45 23.04 22.50 $ ^{235} $ Am

$ ^{26} $ Mg

79.10 22.44 22.56 $ ^{232} $ U

$ ^{22} $ Ne

57.36 24.32 24.32 $ ^{236} $ Am

$ ^{\#} $ 

$ ^{26} $ Mg

77.05 22.81 23.54 $ ^{229} $ Np

$ ^{22} $ Ne

61.86 21.19 20.58 $ ^{237} $ Am

$ ^{\#} $ 

$ ^{26} $ Mg

74.64 27.08 27.18 $ ^{230} $ Np

$ ^{22} $ Ne

62.13 19.43 19.36 $ ^{233} $ Np

$ ^{28} $ Mg

76.79 24.48 22.69 $ ^{231} $ Np

$ ^{22} $ Ne

61.91 21.047 20.54 $ ^{234} $ Np

$ ^{28} $ Mg

77.23 22.17 21.07 $ ^{232} $ Np

$ ^{\#} $ 

$ ^{22} $ Ne

60.18 21.73 21.69 $ ^{235} $ Np

$ ^{28} $ Mg

77.10 24.09 23.74 $ ^{233} $ Np

$ ^{22} $ Ne

57.83 26.18 25.59 $ ^{236} $ Np

$ ^{28} $ Mg

75.15 24.31 24.52 $ ^{229} $ Pa

$ ^{24} $ Ne

59.67 23.83 22.59 $ ^{237} $ Np

$ ^{28} $ Mg

73.54 27.92 27.42 $ ^{230} $ Pa

$ ^{24} $ Ne

60.38 21.36 20.70 $ ^{234} $ Pu

$ ^{28} $ Mg

79.15 21.32 21.65 $ ^{232} $ Pa

$ ^{24} $ Ne

58.65 23.51 24.15 $ ^{235} $ Pu

$ ^{28} $ Mg

79.65 22.62 22.26 $ ^{233} $ Pa

$ ^{24} $ Ne

57.09 27.16 27.15 $ ^{237} $ Pu

$ ^{28} $ Mg

77.73 24.49 24.14 $ ^{231} $ U

$ ^{24} $ Ne

62.21 21.71 21.81 $ ^{235} $ Am

$ ^{28} $ Mg

79.70 23.65 23.21 $ ^{231} $ Np

$ ^{24} $ Ne

61.63 23.45 23.49 $ ^{236} $ Am

$ ^{\#} $ 

$ ^{28} $ Mg

79.93 21.57 21.82 Continued on next page Table 4 – continued from previous page Parent nuclei Emitted clusters $Q _{c} $ (MeV)

${\rm{log}} _{10}T_{1/2} $ (s)

${\rm{log}} _{10}T_{1/2} $ (s)

Parent nuclei Emitted clusters $Q _{c} $ /MeV

${\rm{log}} _{10}T_{1/2} $ (s)

${\rm{log}} _{10}T_{1/2} $ (s)

Expt. ImSahuA ImSahuB Expt. ImSahuA ImSahuB $ ^{232} $ Np

$ ^{\#} $ 

$ ^{24} $ Ne

62.18 21.20 21.82 $ ^{237} $ Am

$ ^{\#} $ 

$ ^{28} $ Mg

79.85 23.44 23.08 $ ^{233} $ Np

$ ^{24} $ Ne

62.16 22.74 22.86 $ ^{238} $ Am

$ ^{28} $ Mg

78.23 23.23 23.52 $ ^{234} $ Np

$ ^{24} $ Ne

60.70 22.98 23.65 $ ^{239} $ Am

$ ^{28} $ Mg

76.27 27.12 26.72 $ ^{235} $ Np

$ ^{24} $ Ne

58.85 26.93 27.02 $ ^{235} $ Am

$ ^{30} $ Si

92.88 25.15 23.75 $ ^{231} $ Pa

$ ^{26} $ Ne

56.76 29.78 28.03 $ ^{236} $ Am

$ ^{\#} $ 

$ ^{30} $ Si

92.73 23.30 22.63 $ ^{232} $ Pa

$ ^{26} $ Ne

57.72 26.69 25.58 $ ^{237} $ Am

$ ^{\#} $ 

$ ^{30} $ Si

92.04 25.85 25.97 $ ^{233} $ Pa

$ ^{26} $ Ne

58.04 27.88 27.58 $ ^{238} $ Am

$ ^{30} $ Si

89.60 26.17 26.97 $ ^{234} $ Pa

$ ^{26} $ Ne

56.61 28.23 28.49 $ ^{239} $ Am

$ ^{30} $ Si

87.47 30.26 30.25 $ ^{235} $ Pa

$ ^{26} $ Ne

55.45 31.62 31.18 $ ^{236} $ Cm

$ ^{30} $ Si

96.07 21.52 22.35 $ ^{232} $ U

$ ^{26} $ Ne

57.91 27.58 27.92 $ ^{237} $ Cm

$ ^{30} $ Si

96.13 23.39 23.48 $ ^{233} $ U

$ ^{26} $ Ne

58.89 27.86 27.56 $ ^{238} $ Cm

$ ^{30} $ Si

95.63 21.83 22.67 $ ^{234} $ U

$ ^{26} $ Ne

59.41 25.44 25.77 $ ^{239} $ Cm

$ ^{30} $ Si

93.19 25.89 26.02 $ ^{235} $ U

$ ^{26} $ Ne

58.05 28.98 28.68 $ ^{240} $ Cm

$ ^{30} $ Si

90.89 26.08 26.97 $ ^{236} $ U

$ ^{26} $ Ne

56.69 29.25 29.59 $ ^{237} $ Bk

$ ^{\#} $ 

$ ^{30} $ Si

97.68 23.20 23.21 $ ^{233} $ Np

$ ^{26} $ Ne

57.52 30.99 30.62 $ ^{238} $ Bk

$ ^{\#} $ 

$ ^{30} $ Si

97.52 21.35 22.09 $ ^{234} $ Np

$ ^{26} $ Ne

58.34 28.08 28.34 $ ^{239} $ Bk

$ ^{\#} $ 

$ ^{30} $ Si

96.94 23.75 23.85 $ ^{235} $ Np

$ ^{26} $ Ne

58.82 29.05 28.76 $ ^{240} $ Bk

$ ^{\#} $ 

$ ^{30} $ Si

94.89 23.54 24.35 $ ^{236} $ Np

$ ^{26} $ Ne

57.69 28.97 29.27 $ ^{241} $ Bk

$ ^{\#} $ 

$ ^{30} $ Si

92.32 27.82 27.91 $ ^{237} $ Np

$ ^{26} $ Ne

56.25 32.80 32.46 $ ^{237} $ Am

$ ^{\#} $ 

$ ^{32} $ Si

94.47 25.34 23.92 $ ^{229} $ Np

$ ^{24} $ Mg

71.53 26.49 24.38 $ ^{238} $ Am

$ ^{32} $ Si

94.75 22.97 22.33 $ ^{230} $ Np

$ ^{24} $ Mg

71.42 25.04 23.50 $ ^{239} $ Am

$ ^{32} $ Si

94.50 25.24 25.33 $ ^{231} $ Np

$ ^{24} $ Mg

70.59 27.53 26.87 $ ^{240} $ Am

$ ^{32} $ Si

92.34 25.08 25.89 $ ^{232} $ Np

$ ^{\#} $ 

$ ^{24} $ Mg

68.04 29.11 28.95 $ ^{241} $ Am

$ ^{32} $ Si

90.66 28.74 28.70 $ ^{233} $ Np

$ ^{24} $ Mg

65.53 34.01 33.18 $ ^{238} $ Cm

$ ^{32} $ Si

97.31 21.91 22.77 $ ^{230} $ Pu

$ ^{24} $ Mg

74.65 22.58 22.51 $ ^{238} $ Cm

$ ^{32} $ Si

97.68 23.67 23.73 $ ^{231} $ Pu

$ ^{24} $ Mg

74.69 24.06 23.40 $ ^{239} $ Cm

$ ^{32} $ Si

97.55 21.65 22.51 $ ^{232} $ Pu

$ ^{24} $ Mg

74.05 23.18 23.10 $ ^{240} $ Cm

$ ^{32} $ Si

95.39 25.54 25.63 $ ^{233} $ Pu

$ ^{24} $ Mg

71.60 27.47 26.81 $ ^{241} $ Cm

$ ^{32} $ Si

93.61 25.02 25.92 $ ^{234} $ Pu

$ ^{24} $ Mg

69.01 29.06 28.98 $ ^{242} $ Bk

$ ^{\#} $ 

$ ^{32} $ Si

98.38 24.18 24.17 $ ^{231} $ Am

$ ^{\#} $ 

$ ^{24} $ Mg

76.40 23.36 22.63 $ ^{240} $ Bk

$ ^{\#} $ 

$ ^{32} $ Si

98.61 21.87 22.65 $ ^{232} $ Am

$ ^{\#} $ 

$ ^{24} $ Mg

76.14 22.05 21.90 $ ^{241} $ Bk

$ ^{\#} $ 

$ ^{32} $ Si

98.37 24.13 24.20 $ ^{233} $ Am

$ ^{\#} $ 

$ ^{24} $ Mg

75.46 24.29 23.64 $ ^{242} $ Bk

$ ^{\#} $ 

$ ^{32} $ Si

96.60 23.50 24.34 $ ^{234} $ Am

$ ^{\#} $ 

$ ^{24} $ Mg

73.19 25.22 25.10 $ ^{243} $ Bk

$ ^{32} $ Si

94.63 27.32 27.38 $ ^{235} $ Am

$ ^{24} $ Mg

70.42 30.04 29.32 $ ^{239} $ Am

$ ^{34} $ Si

93.17 28.06 26.58 $ ^{240} $ Am

$ ^{34} $ Si

93.72 25.29 24.66 $ ^{244} $ Cm

$ ^{34} $ Si

93.14 26.91 27.86 $ ^{241} $ Am

$ ^{34} $ Si

93.93 27.29 27.38 $ ^{241} $ Bk

$ ^{\#} $ 

$ ^{34} $ Si

96.04 27.73 27.73 $ ^{242} $ Am

$ ^{34} $ Si

92.18 26.67 27.53 $ ^{242} $ Bk

$ ^{\#} $ 

$ ^{34} $ Si

96.56 25.01 25.85 $ ^{243} $ Am

$ ^{34} $ Si

90.78 30.23 30.18 $ ^{243} $ Bk

$ ^{34} $ Si

96.91 26.89 26.98 $ ^{240} $ Cm

$ ^{34} $ Si

95.47 24.89 25.81 $ ^{244} $ Bk

$ ^{34} $ Si

95.46 25.94 26.83 $ ^{241} $ Cm

$ ^{34} $ Si

96.11 26.51 26.58 $ ^{245} $ Bk

$ ^{34} $ Si

93.63 29.85 29.91 $ ^{243} $ Cm

$ ^{34} $ Si

94.75 27.66 27.75 Besides the cluster radioactivity of the trans-lead region, a new island of cluster emitters around the doubly magic nucleus
$ ^{100} $ Sn was carefully analyzed in previous studies [65-79]. Concerning the cluster radioactivity in the trans-tin region, only the half-life of$ ^{12} $ C emission from$ ^{114} $ Ba was measured; its value was$ \geqslant 10^{3} $ s at Dubna (Dubna94) [80] and$ \geqslant $ 1.1$ \times 10^{3} $ s (1.7$ \times 10^{4} $ s) at GSI (GSI95) [81, 82], respectively. However, the$ ^{12} $ C decay of$ ^{114} $ Ba was not observed in the subsequent experiment [83]. This suggests that the branching ratio for the$ ^{12} $ C decay is lower than the limit obtained in the GSI95 measurement. By consulting the NUBASE2016 table, the experimental lower limit of the half-life of the$ ^{12} $ C emission from$ ^{114} $ Ba is$ > $ 10$ ^{4.13} $ s [56]. Thus, the half-life of the$ ^{12} $ C radioactivity from$ ^{114} $ Ba has not been accurately determined yet . Nevertheless, the experimental half-life with the lower limit of the$ ^{12} $ C emission from$ ^{114} $ Ba can be used to test various cluster decay models.Then, we extended our method to study the
$ ^{12} $ C radioactivity of$ ^{114} $ Ba. The calculated decimal logarithm half-lives within the Sahu, ImSahuA, and ImSahuB formulas are 3.994 s, 9.079 s, and 9.355 s, respectively. A comparison between the calculated half-lives and the experimental lower limit of the half-life allows us to conclude that the experimental half-life of the$ ^{12} $ C radioactivity of$ ^{114} $ Ba can be better reproduced within the ImSahuA and ImSahuB formulas. Therefore, we have enough confidence to predict the half-lives of the cluster radioactivity for the nuclei in the trans-tin region. Recently, the cluster radioactivity half-lives of the neutron-deficient nuclei in the trans-tin region were investigated through the effective liquid drop model, the GLDM, and several sets of analytic formulas [84]. It was found that$ \alpha $ -like cluster radioactivity, such as in$ ^{8} $ Be,$ ^{12} $ C,$ ^{16} $ O,$ ^{20} $ Ne,$ ^{24} $ Mg, and$ ^{28} $ Si emissions, decaying to the$ N_{d} $ = 50 daughter nuclei, was the most probable. Thus, the half-lives of these most probable cluster radioactivity were predicted by the ImSahuA and ImSahuB formulas, which are listed in Table 5. In Table 5, the$Q _{c} $ values are still calculated from Eq. (16). Regarding the unknown nuclear masses, their values were calculated from the empirical masses of the NUBASE2016 table [56] or the WS4 mass table [85] because relevant studies showed that the WS4 mass model can predict the experimental nuclear masses and decay energies accurately [85-88]. We hope these predicted half-lives will be useful for identifying new cluster emissions of the trans-tin region in future measurements.Parent nuclei Emitted clusters $Q _{c} $ (MeV)

${\rm{log}} _{10}T_{1/2} $ (s)

${\rm{log}} _{10}T_{1/2} $ (s)

ImSahuA ImSahuB $ ^{108} $ Xe

$ ^{\ast } $ 

$ ^{8} $ Be

10.40 6.06 5.92 $ ^{109} $ Cs

$ ^{\ast } $ 

$ ^{8} $ Be

10.00 8.69 8.37 $ ^{110} $ Ba

$ ^{\ast } $ 

$ ^{8} $ Be

10.18 8.46 8.32 $ ^{110} $ Xe

$ ^{12} $ C

15.72 15.14 15.44 $ ^{111} $ Cs

$ ^{\#} $ 

$ ^{12} $ C

18.56 9.81 9.81 $ ^{112} $ Ba

$ ^{\ast } $ 

$ ^{12} $ C

21.73 3.89 4.13 $ ^{113} $ La

$ ^{\ast } $ 

$ ^{12} $ C

21.57 5.76 5.74 $ ^{114} $ Ce

$ ^{\ast } $ 

$ ^{12} $ C

22.26 4.69 4.95 $ ^{114} $ Ba

$ ^{16} $ O

26.47 12.77 13.17 $ ^{115} $ La

$ ^{\ast } $ 

$ ^{16} $ O

29.80 9.35 9.35 $ ^{116} $ Ce

$ ^{\ast } $ 

$ ^{16} $ O

33.22 4.66 5.00 $ ^{117} $ Pr

$ ^{\ast } $ 

$ ^{16} $ O

33.05 6.82 6.80 $ ^{118} $ Nd

$ ^{\ast } $ 

$ ^{16} $ O

33.25 6.50 6.86 $ ^{118} $ Ce

$ ^{\ast } $ 

$ ^{20} $ Ne

35.03 16.30 16.42 $ ^{119} $ Pr

$ ^{\ast } $ 

$ ^{20} $ Ne

37.52 15.10 14.74 $ ^{120} $ Nd

$ ^{\ast } $ 

$ ^{20} $ Ne

40.68 10.78 10.89 $ ^{121} $ Pm

$ ^{\ast } $ 

$ ^{20} $ Ne

40.53 13.42 13.05 $ ^{122} $ Sm

$ ^{\ast } $ 

$ ^{20} $ Ne

41.32 12.28 12.40 $ ^{122} $ Nd

$ ^{\ast } $ 

$ ^{24} $ Mg

46.65 15.66 15.59 $ ^{123} $ Pm

$ ^{\ast } $ 

$ ^{24} $ Mg

49.75 14.84 14.20 $ ^{124} $ Sm

$ ^{\ast } $ 

$ ^{24} $ Mg

53.86 10.20 10.14 $ ^{125} $ Eu

$ ^{\ast } $ 

$ ^{24} $ Mg

53.98 12.80 12.15 $ ^{126} $ Gd

$ ^{\ast } $ 

$ ^{24} $ Mg

54.90 11.50 11.44 $ ^{126} $ Sm

$ ^{\ast } $ 

$ ^{28} $ Si

60.09 14.10 14.76 $ ^{127} $ Eu

$ ^{\ast } $ 

$ ^{28} $ Si

63.53 14.03 13.98 $ ^{128} $ Gd

$ ^{\ast } $ 

$ ^{28} $ Si

67.99 10.00 10.61 $ ^{129} $ Tb

$ ^{\ast } $ 

$ ^{28} $ Si

68.63 12.20 12.13 Table 5. Emission half-lives of
$ ^{8} $ Be,$ ^{12} $ C,$ ^{16} $ O,$ ^{20} $ Ne,$ ^{24} $ Mg, and$ ^{28} $ Si in the decay processes where the involved daughter nuclei are those with$N _{d} $ around 50 within the ImSahuA and ImSahuB formulas are shown in columns 4 and 5; “#” and “*” denote the$Q _{c} $ values calculated from the empirical mass excesses of the NUBASE2016 table [55] and the theoretical ones from the WS4 mass model [85], respectively. -
In this study, the Sahu relationship was improved by introducing two accurate root-mean-square charge radius formulas and an analytic expression of the cluster preformation probability. The improved Sahu relationships with the two charge radius formulas are called ImSahuA relationship and ImSahuB relationship, respectively. Within the Sahu, ImSahuA, and ImSahuB relationships, the cluster radioactivity half-lives of the trans-lead nuclei and the half-life of the
$ ^{12} $ C radioactivity of$ ^{114} $ Ba were calculated. The results allow us to draw the following conclusions:(i) The experimental half-lives of the trans-lead nuclei and the experimental half-life lower limit of the
$ ^{12} $ C decay from$ ^{114} $ Ba within the ImSahuA and ImSahuB relationships are reproduced better than those within the Sahu relationship;(ii) According to the linear correlation between the cluster preformation probability and the mass number of the emitted cluster, the calculated
$P _{\alpha } $ value is close to those given by other models;(iii) The high accuracy of the ImSahuA and ImSahuB relationships and the calculated
$P _{\alpha } $ values demonstrate the validity of the analytic expression for the cluster preformation probability;(iv) The accuracy of the ImSahuB formula is higher than that of the ImSahuA formula given that the charge radius formula with the Casten factor is more accurate. This indicates that an accurate charge radius formula is important for calculating the half-life of the cluster radioactivity.
Finally, the cluster radioactivity half-lives of the trans-lead and trans-tin nuclei that are not experimentally available were predicted by the ImSahuA and ImSahuB formulas. This might be helpful for searching for new cluster emitters in the two regions in future experiments.
-
We thank Professors Shangui Zhou, Ning Wang, and Fengshou Zhang for helpful discussions.
An improved semi-empirical relationship for cluster radioactivity
- Received Date: 2020-12-02
- Available Online: 2021-04-15
Abstract: An improved semi-empirical relationship for cluster radioactivity half-lives is proposed by introducing an accurate charge radius formula and an analytic expression of the preformation probability. Moreover, the cluster radioactivity half-lives for the daughter nuclei around 208Pb or its neighbors and the 12C radioactivity half-life of 114Ba are calculated within the improved semi-empirical relationship. It is shown that the accuracy of the new relationship is improved significantly compared to its predecessor. In addition, the cluster radioactivity half-lives that are experimentally unavailable for the trans-lead and trans-tin nuclei are predicted by the new semi-empirical formula. These predictions might be useful for searching for the new cluster emitters of the two islands in future experiments.


 DownLoad: