-
The latest data collected at HERA for heavy quarks show that the cross-sections for charm and beauty production can be considered in a wide range of
$ x $ and$ Q^{2} $ values from the H1 and ZEUS detectors [1-5]. A combination method is used at HERA for the cross-section data with respect to the correlations of the statistical and systematic uncertainties. In neutral current (NC) deep inelastic electron-proton scattering (DIS) at HERA, heavy quark production is the most important test of quantum chromodynamics (QCD). The dominant process in the production of heavy quarks is boson-gluon-fusion (BGF). The production of heavy quarks at HERA depends on the mass of these quarks and thus the calculations of cross-sections depend on a wide range of perturbative scales$ \mu^{2} $ . The massive fixed-flavour-number scheme (FFNS) [6-17] and the variable-flavour-number scheme (VFNS) [18-21] are different approaches for considering heavy quarks. FFNS can be used on the threshold of$ \mu^{2}{\approx}m^{2} $ , and for$ \mu^{2}{\gg}m^{2} $ VFNS is used where the treatment of resummation of collinear logarithms$ \ln\;(\mu^{2}/m^{2}) $ is achieved. In Refs. [22, 23] a general-mass variable-flavour-number scheme (GM-VFNS) for calculation of the contributions of heavy quarks was introduced.In the process
$ \gamma^{*}g{\rightarrow}{\cal{Q}}\overline{{\cal{Q}}} $ , where$ {\cal{Q}} $ is a heavy quark, heavy quark production is sensitive to the gluon distribution and gluon momentum transfer in the proton. In accordance with the heavy quark mass, the gluon momentum is arranged such that$ x_{g}^{t}>x_{g}^{b}>x_{g}^{c} $ . The HERA dataset, for production charm and beauty in DIS, covers the kinematic range of photon virtuality$ 2.5 {\leqslant} Q^{2} {\leqslant} $ $ 2000\; \mathrm{GeV}^{2} $ and Bjorken scaling variable$ 3.10^{-5} {\leqslant} x {\leqslant} 5.10^{-2} $ [1-5]. The electron-proton center-of-mass energies with data taken with the H1 and ZEUS detectors correspond to$ \sqrt{s} = 319\; \mathrm{GeV} $ [1] and$ \sqrt{s} = 318\; \mathrm{GeV} $ [2] respectively. Future circular electron-proton colliders are an ideal environment to increase center-of-mass energy [24-29]. At the LHeC, the electron-proton center of mass energy is planned to reach$ \sqrt{s} \simeq 1.3\; \mathrm{TeV} $ . The$ x,Q^{2} $ values of simulated heavy quark density data used in LHeC studies reach$ x{\leqslant}10^{-5} $ and$ Q^{2}{\geqslant}10^{4}\; \mathrm{GeV}^{2} $ [27, 28]. The heavy quark densities will also be checked in the proposed FCC-eh programme, in which the center-of-mass energy reaches$ \simeq 3.5\; \mathrm{TeV} $ [29].The heavy quark structure functions obtained in DIS at HERA, from the measurement of the inclusive heavy quark cross-sections, are an important test of QCD. These structure functions are obtained after applying small corrections to the heavy-quark longitudinal structure functions [1-5]. The heavy quark cross-section is defined in terms of the heavy quark structure functions as
$ \frac{{\rm d}^{2}\sigma^{{\cal{Q}}\overline{{\cal{Q}}}}}{{\rm d}x{\rm d}Q^{2}} = \frac{2{\pi}\alpha^{2}(Q^{2})}{xQ^{4}}\{[1+(1-y)^{2}]F_{2}^{{\cal{Q}}\overline{{\cal{Q}}}}(x,Q^{2}) -y^{2}F_{L}^{{\cal{Q}}\overline{{\cal{Q}}}}(x,Q^{2}) \}, $

(1) where
$ y $ is the inelasticity. The reduced cross-section is defined as$ \begin{aligned}[b] \sigma^{{\cal{Q}}\overline{{\cal{Q}}}}_{\mathrm{red}} =& \frac{{\rm d}^{2}\sigma^{{\cal{Q}}\overline{{\cal{Q}}}}}{{\rm d}x{\rm d}Q^{2}} \cdot \frac{xQ^{4}}{2{\pi}\alpha^{2}(Q^{2})(1+(1-y)^{2})}\\ =& F_{2}^{{\cal{Q}}\overline{{\cal{Q}}}}(x,Q^{2})-f(y)F_{L}^{{\cal{Q}}\overline{{\cal{Q}}}}(x,Q^{2}), \end{aligned} $

(2) where
$ f(y) = \dfrac{y^{2}}{1+(1-y)^{2}} $ . In the HERA kinematic range, the contribution$ F_{L}^{{\cal{Q}}\overline{{\cal{Q}}}} $ is small. Therefore, the heavy quark structure function$ F_{2}^{{\cal{Q}}\overline{{\cal{Q}}}} $ is obtained from the measured heavy quark cross-sections. The measurements of$ \sigma^{{\cal{Q}}\overline{{\cal{Q}}}}_{\mathrm{red}} $ , based on data from HERA I and HERA II, are shown as a function of$ x $ for fixed values of$ Q^{2} $ in Refs. [1-5]. The measured values of the heavy quark structure functions$ F_{2}^{{\cal{Q}}\overline{{\cal{Q}}}} $ were obtained using$ F_{2}^{{\cal{Q}}\overline{{\cal{Q}}}}(x,Q^{2}) = \frac{{\rm d}^{2}\sigma^{\mathrm{jet}}_{{\cal{Q}}}/{{\rm d}x{\rm d}Q^{2}}} {{\rm d}^{2}\sigma^{\mathrm{had,NLO}}_{{\cal{Q}}}/{{\rm d}x{\rm d}Q^{2}}} F_{2}^{{\cal{Q}}\overline{{\cal{Q}}},\mathrm{NLO}}(x,Q^{2}). $

(3) The differential cross section for the jet production method is defined in the literature, and NLO QCD predictions have also been obtained from the FFNS using the HVQDIS program [30]. This method is also used to obtain the cross-section from the heavy quark longitudinal structure function. Heavy quark cross-sections are determined and extracted in analogy to
$ F_{2}^{{\cal{Q}}\overline{{\cal{Q}}}} $ . In this way no assumption on$ F_{L}^{{\cal{Q}}\overline{{\cal{Q}}}} $ is required. Indeed,$ \begin{array}{l} \sigma^{{\cal{Q}}\overline{{\cal{Q}}}}_{\mathrm{red}} = F_{2}^{{\cal{Q}}\overline{{\cal{Q}}}}(x,Q^{2})[1-f(y)F_{L}^{{\cal{Q}}\overline{{\cal{Q}}}}(x,Q^{2})/F_{2}^{{\cal{Q}}\overline{{\cal{Q}}}}(x,Q^{2})] .\end{array} $

(4) Future circular colliders will extend the ratio
$ F_{L}^{{\cal{Q}}\overline{{\cal{Q}}}}/F_{2}^{{\cal{Q}}\overline{{\cal{Q}}}} $ into a region of much smaller$ x $ and higher$ Q^2 $ . Indeed, the LHeC is the ideal place to resolve this ratio [27, 28]. An overview of the kinematic plane of the LHeC pseudo-data [31, 32] is given in Table 1 for the$ x, Q^{2} $ values of simulated heavy quark density data [27, 28, 33]. These data provide additional constraints on the gluon.$ \mathrm{Observable} $ 

$E_{e}/{\rm GeV}$ 

$E_{p}/{\rm TeV}$ 

$ \mathrm{Kinematics} $ 

${N}_{\mathrm{dat} }$ 

${\cal{L} }_{\mathrm{int} }/\mathrm{ab}^{-1}$ 

$ F_{2}^{c,NC}(e^{-}p) $ 

60 7 $7{\times}10^{-6}{\leqslant}x{\leqslant}0.3,\; 4{\leqslant}Q^{2}{\leqslant}2{\times}10^{5}\; \mathrm{GeV}^{2}$ 

111 1.0 $ F_{2}^{b,NC}(e^{-}p) $ 

60 7 $3{\times}10^{-5}{\leqslant}x{\leqslant}0.3,\; 32{\leqslant}Q^{2}{\leqslant}2{\times}10^{5}\; \mathrm{GeV}^{2}$ 

77 1.0 This paper is organized as follows. In Sect. II, we give a summary of the ratio of heavy quark structure functions. Then we introduce a method to calculate the ratio
$ F_{L}^{{\cal{Q}}\overline{{\cal{Q}}}}/F_{2}^{{\cal{Q}}\overline{{\cal{Q}}}} $ , applying the gluon exponent. After reviewing the essential features of the charm and beauty structure functions at HERA in Sect. III, we study the heavy quark structure functions at the LHeC and FCC-eh kinematics. Section IV contain the results and discussion. A summary and conclusions are given in Sect. V. -
The dynamics of flavor-singlet quark and gluon distribution functions,
$ q^{s} $ and$ g $ , are defined by:$ \begin{aligned}[b] q^{s}(x,n_{f},\mu^{2}) =& \sum\limits_{l = 1}^{n_{f}}[f_{l}(x,n_{f},\mu^{2})+\overline{f}_{l}(x,n_{f},\mu^{2})],\\ g(x,n_{f},\mu^{2}) =& f_{g}(x,n_{f},\mu^{2}), \end{aligned} $

(5) where
$ n_{f} $ is number of active quark flavors. The heavy quark structure functions derived using the zero-mass VFN scheme (ZMVFN) are$ F^{\rm ZMVFN}_{k,{\cal{Q}}} = \sum\limits_{j = 0}^{\infty}a_{s}^{j}(n_{f}+1)\sum\limits_{i = q,g,{\cal{Q}}} C_{k,i}^{(j)}(n_{f}+1){\otimes}f_{i}(n_{f}+1) $

(6) where the
$ C^{,}s $ are the Wilson coefficients at the$ j $ -th order and$ k = 2 $ and$ L $ . Here$ a_{s} = \dfrac{\alpha_{s}}{4\pi} $ is the QCD running coupling. Equation (6) is valid at asymptotically large momentum transfer$ Q^{2}{\gg}m_{{\cal{Q}}}^{2} $ . For$ Q^{2}{\simeq}m_{{\cal{Q}}}^{2} $ VFNS is valid, which includes a combination of the ZMVFN with FFNS. In this case the heavy quark structure functions are$ F^{\rm FFNS} _{k,{\cal{Q}}} = \sum\limits_{j = 0}^{\infty}a_{s}^{j}(n_{f})\sum\limits_{i = q,g} H_{k,i}^{(j)}(n_{f}){\otimes}f_{i}(n_{f}), $

(7) where the
$ H^{,}s $ are the Wilson coefficients for DIS heavy quark production [34]. In the following, we suppress the dependence on the active flavor$ n_{f} $ . In GM-VFNS, one should take quark mass into account, as the rescaling variable$ \chi $ is defined into the Bjorken variable$ x $ by the following form [35]$ \chi = x\left(1+\frac{4m_{{\cal{Q}}}^{2}}{Q^{2}}\right), $

(8) where the rescaling variable, at high
$ Q^{2} $ values ($ m^{2}_{{\cal{Q}}}/Q^{2}\ll 1 $ ), reduces to$ x $ ,$ \chi{\rightarrow}x $ . Here$ m_{{\cal{Q}}} $ is the heavy quark mass.Within this scheme, heavy quark densities arise via the
$ g{\rightarrow}{\cal{Q}}\overline{{\cal{Q}}} $ evolution. In the small-$ x $ range the heavy quark contributions are given by these forms:$ \begin{aligned}[b] F_{2}^{{\cal{Q}}\overline{{\cal{Q}}}}(x,Q^{2}) =& C_{2,g}^{{\cal{Q}}\overline{{\cal{Q}}}}(x,\xi){\otimes}G(x,\mu^{2}),\\ F_{L}^{{\cal{Q}}\overline{{\cal{Q}}}}(x,Q^{2}) =& C_{L,g}^{{\cal{Q}}\overline{{\cal{Q}}}}(x,\xi){\otimes}G(x,\mu^{2}), \end{aligned} $

(9) where
$ \xi = \dfrac{m^{2}_{{\cal{Q}}}}{Q^{2}} $ . The coefficient functions up to NLO analysis,$ C_{2,g} $ and$ C_{L,g} $ , were demonstrated in Refs. [6-17, 34, 36-41].$ \otimes $ denotes convolution between two functions of$ x $ , as$ [f\otimes g](x) = \int_{x}^{1}({\rm d}y/y)f(y)g(x/y) = \int_{x}^{1}({\rm d}z/z)f(x/z)g(z) $ . Here$ G(x,\mu^{2})( = xg(x,\mu^{2})) $ is the gluon momentum distribution and the default renormalisation scale$ \mu_{r} $ and factorization scale$ \mu_{f} $ are set to$ \mu\equiv \mu_{r} = \mu_{f} = \sqrt{Q^{2}+4m^2_{{\cal{Q}}}} $ . Within the pQCD, and up to the NLO corrections, the coefficient functions$ C_{2,g} $ and$ C_{L,g} $ read$ \begin{array}{l} C_{k,g}(z,\xi) = C^{0}_{k,g}(z,\xi)+a_{s}(\mu^{2})C^{1}_{k,g}(z,\xi). \end{array} $

(10) The behavior of the heavy quark structure function is governed entirely by hard pomeron exchange, in accordance with the Regge theory. The heavy quark cross-section depends strongly on the gluon distribution, which the density of gluons enters at
$ x_{g}^{{\cal{Q}}} = \frac{Q^{2}+M^{2}_{t}}{W^{2}+Q^{2}} = x_{bj}\left(1+\frac{M^{2}_{t}}{Q^{2}}\right), $

(11) where
$ M_{t} $ is the transverse mass of the produced heavy quark pair$ {\cal{Q}}\overline{{\cal{Q}}} $ [42-45]. The standard parameterization of the gluon distribution function at low$ x $ has the following form:$ \begin{array}{l} G(x,Q^{2})_{x{\rightarrow}0} = f_{g}(Q^{2})x^{-\lambda_{g}(Q^{2})}. \end{array} $

(12) Over a wide range of
$ Q^{2} $ , the gluon density behaves as a fixed power of$ x $ , as the quantity$ \lambda_{g} $ is the hard-pomeron intercept minus one①. Equation (12) gives the origin of heavy quarks from gluons in the proton. Indeed, the heavy quark structure functions can be described by a fixed power of$ x $ behavior [46-54] as$ \begin{array}{l} F_{2}^{c(b)} = f_{{\cal{Q}}}(Q^{2})x^{-\lambda_{\rm eff}}. \end{array} $

(13) The gluon exponent at low values of
$ x $ is described by the hard pomeron, as the fixed coupling LLx BFKL solution gives the value$ \lambda_{g}{\simeq}-0.5 $ , although dependence on$ Q^{2} $ is expressed in the effective exponent defined in Refs. [55-58]. In the literature, fits to experimental data suggest that hard pomerons dominate the behavior of the heavy quark structure function. It is suggested that this behavior can be shown in the form of Eq. (13), where we assume that$ \lambda_{\rm eff}^{c}{\simeq}\lambda_{\rm eff}^{b} $ . The heavy quark behavior at low$ x $ is determined by the gluon behavior, so$ \lambda_{\rm eff}^{c}{\simeq}\lambda_{\rm eff}^{b} = \lambda_{g} $ .Within the dipole formulation of the
$ \gamma^{*} p $ scattering [59-62], the gluon density is modelled as$ xg(x,\mu^{2}) = $ $ \dfrac{3}{4\pi^{2}\alpha_{s}}\dfrac{\sigma_{0}}{R_{0}^{2}(x)} $ , where$ R_{0}(x) $ is the saturation scale. This function decreases when$ x{\rightarrow}0 $ as$ R_{0}^{2}(x) = \dfrac{1}{\mathrm{GeV}^{2}}\left(\dfrac{x}{x_{0}}\right)^{\lambda_{g}} $ . The parameters of the model (i.e.,$ \sigma_{0} $ and$ x_{0} $ ) are defined in Refs. [59-62]. In the color dipole model (CDM), the saturation exponent$ \lambda_{_{g}} $ is defined from a fit to low-$ x $ data as$ \lambda_{g}{\simeq}0.3 $ . In this analysis, we will try to select the gluon exponent value corresponding to the average of the hard pomeron and color dipole model, where$ 0.3{\leqslant}\lambda_{g}{\leqslant}0.5 $ . Here the lower limit corresponds to the saturation exponent and the upper limit corresponds to the hard pomeron exponent.In recent years [63-77], various successful phenomenological methods have examined charm and beauty structure functions. This importance, along with the t-quark density, can be explored at future circular collider energies. One of the important top quark production modes is
$ t\overline{t} $ photoproduction [78-89]. The total cross-section prediction at the LHeC is 0.05 pb [90]. These studies may lead us to new physics in the future. -
Based on the hard pomeron behavior of the distribution functions, the ratio of heavy quark structure functions is formulated based on the coefficient functions and gluon exponent. After integrating over
$ z $ , the ratio$ F_{L}/F_{2} $ for heavy quarks can be rewritten in a convolution form as the ratio$ F_{L}^{{\cal{Q}}\overline{{\cal{Q}}}}/F_{2}^{{\cal{Q}}\overline{{\cal{Q}}}} $ , defined by$ \frac{F_{L}^{{\cal{Q}}\overline{{\cal{Q}}}}}{F_{2}^{{\cal{Q}}\overline{{\cal{Q}}}}} = \frac{C_{L,g}^{Q\overline{Q}}(x,\xi){\odot}x^{\lambda_{g}}}{C_{2,g}^{Q\overline{Q}}(x,\xi){\odot}x^{\lambda_{g}}}, $

(14) where
$ [f{\odot} g](x) = \int_{x}^{1}({\rm d}y/y)f(y)g(y) $ . In analytical form, the power-like behavior of the heavy quark structure functions is generically written as follows:$ \begin{aligned}[b] \frac{\partial}{\partial{\ln}\frac{1}{x}}{\ln}\frac{F_{L}^{{\cal{Q}}\overline{{\cal{Q}}}}(x,Q^{2})}{F_{2}^{{\cal{Q}}\overline{{\cal{Q}}}}(x,Q^{2})} =& \lambda_{L}^{{\cal{Q}}\overline{{\cal{Q}}}}-\lambda_{2}^{{\cal{Q}}\overline{{\cal{Q}}}}\\ =& \frac{\partial}{\partial{\ln}\frac{1}{x}}{\ln}\frac{C_{L,g}^{{\cal{Q}}\overline{{\cal{Q}}}} (x,\xi){\odot}x^{\lambda_{g}}}{C_{2,g}^{{\cal{Q}}\overline{{\cal{Q}}}}(x,\xi){\odot}x^{\lambda_{g}}}. \end{aligned} $

(15) The exponents
$ \lambda_{L} $ and$ \lambda_{2} $ for heavy quark production are defined by the derivatives of the heavy quark structure functions in the following forms:$ \begin{aligned}[b] \lambda_{L}^{{\cal{Q}}\overline{{\cal{Q}}}} =& {\partial \ln F_{L}^{{\cal{Q}}\overline{{\cal{Q}}}}(x,Q^{2})}/{\partial \ln(1/x)},\\ \lambda_{2}^{{\cal{Q}}\overline{{\cal{Q}}}} =& {\partial \ln F_{2}^{{\cal{Q}}\overline{{\cal{Q}}}}(x,Q^{2})}/{\partial \ln(1/x)}. \end{aligned} $

(16) The importance of the relationship between
$ \sigma^{{\cal{Q}}\overline{{\cal{Q}}}}_{\mathrm{red}} $ and$ F_{2}^{{\cal{Q}}\overline{{\cal{Q}}}}(x,Q^{2}) $ in Eq. (4) depends on the functions of$ f(y) $ and the ratio$ F_{L}^{{\cal{Q}}\overline{{\cal{Q}}}}/F_{2}^{{\cal{Q}}\overline{{\cal{Q}}}} $ . With high inelasticity, where$ f(y){\rightarrow}1 $ , the importance of the longitudinal structure function in the production of heavy quark pairs will be revealed in the LHeC and FCC-eh. In comparisons with the latest data collected in HERA [3], we can see an increase in values of$ Q^{2} $ and a decrease in values of$ x $ at new energies.HERA data are expressed in terms of two variables,
$ x $ and$ Q^{2} $ . At low$ x $ we define a new variable such that$ Q^{2}/x{\simeq}W^{2} $ .$ W^{2} $ refers to the photon-proton center-of-mass energy. Indeed, the heavy quark structure functions are given by the single variable$ W^{2} $ as$ \begin{aligned}[b] F_{L}^{{\cal{Q}}\overline{{\cal{Q}}}}(x,Q^{2}) =& F_{L}^{{\cal{Q}}\overline{{\cal{Q}}}}\left(W^{2} = \frac{x}{Q^{2}},Q^{2}\right),\\ F_{2}^{{\cal{Q}}\overline{{\cal{Q}}}}(x,Q^{2}) =& F_{2}^{{\cal{Q}}\overline{{\cal{Q}}}}\left(W^{2} = \frac{x}{Q^{2}},Q^{2}\right). \end{aligned} $

(17) According to power-like behavior, the heavy quark structure functions can be stated as:
$ \begin{aligned}[b] F_{L}^{{\cal{Q}}\overline{{\cal{Q}}}}(W^{2}){ \sim} (W^{2})^{\lambda_{L}},\quad F_{2}^{{\cal{Q}}\overline{{\cal{Q}}}}(W^{2}){ \sim} (W^{2})^{\lambda_{2}}. \end{aligned} $

(18) The exponents now are defined by the following forms:
$ \begin{aligned}[b]& \lambda_{L}^{{\cal{Q}}\overline{{\cal{Q}}}} = \frac{\partial \ln F_{L}^{{\cal{Q}}\overline{{\cal{Q}}}}(W^{2})}{\partial \ln W^{2}},\\ &\lambda_{2}^{{\cal{Q}}\overline{{\cal{Q}}}} = \frac{\partial \ln F_{2}^{{\cal{Q}}\overline{{\cal{Q}}}}(W^{2})}{\partial \ln W^{2}}. \end{aligned} $

(19) $ {\Rightarrow}\; {\Delta}\lambda_{L2}^{{\cal{Q}}\overline{{\cal{Q}}}} = \lambda_{L}^{{\cal{Q}}\overline{{\cal{Q}}}}- \lambda_{2}^{{\cal{Q}}\overline{{\cal{Q}}}} = \frac{\partial }{\partial \ln W^{2}}\ln \frac{F_{L}^{{\cal{Q}}\overline{{\cal{Q}}}}(W^{2})}{F_{2}^{{\cal{Q}}\overline{{\cal{Q}}}}(W^{2})}. $

(20) -
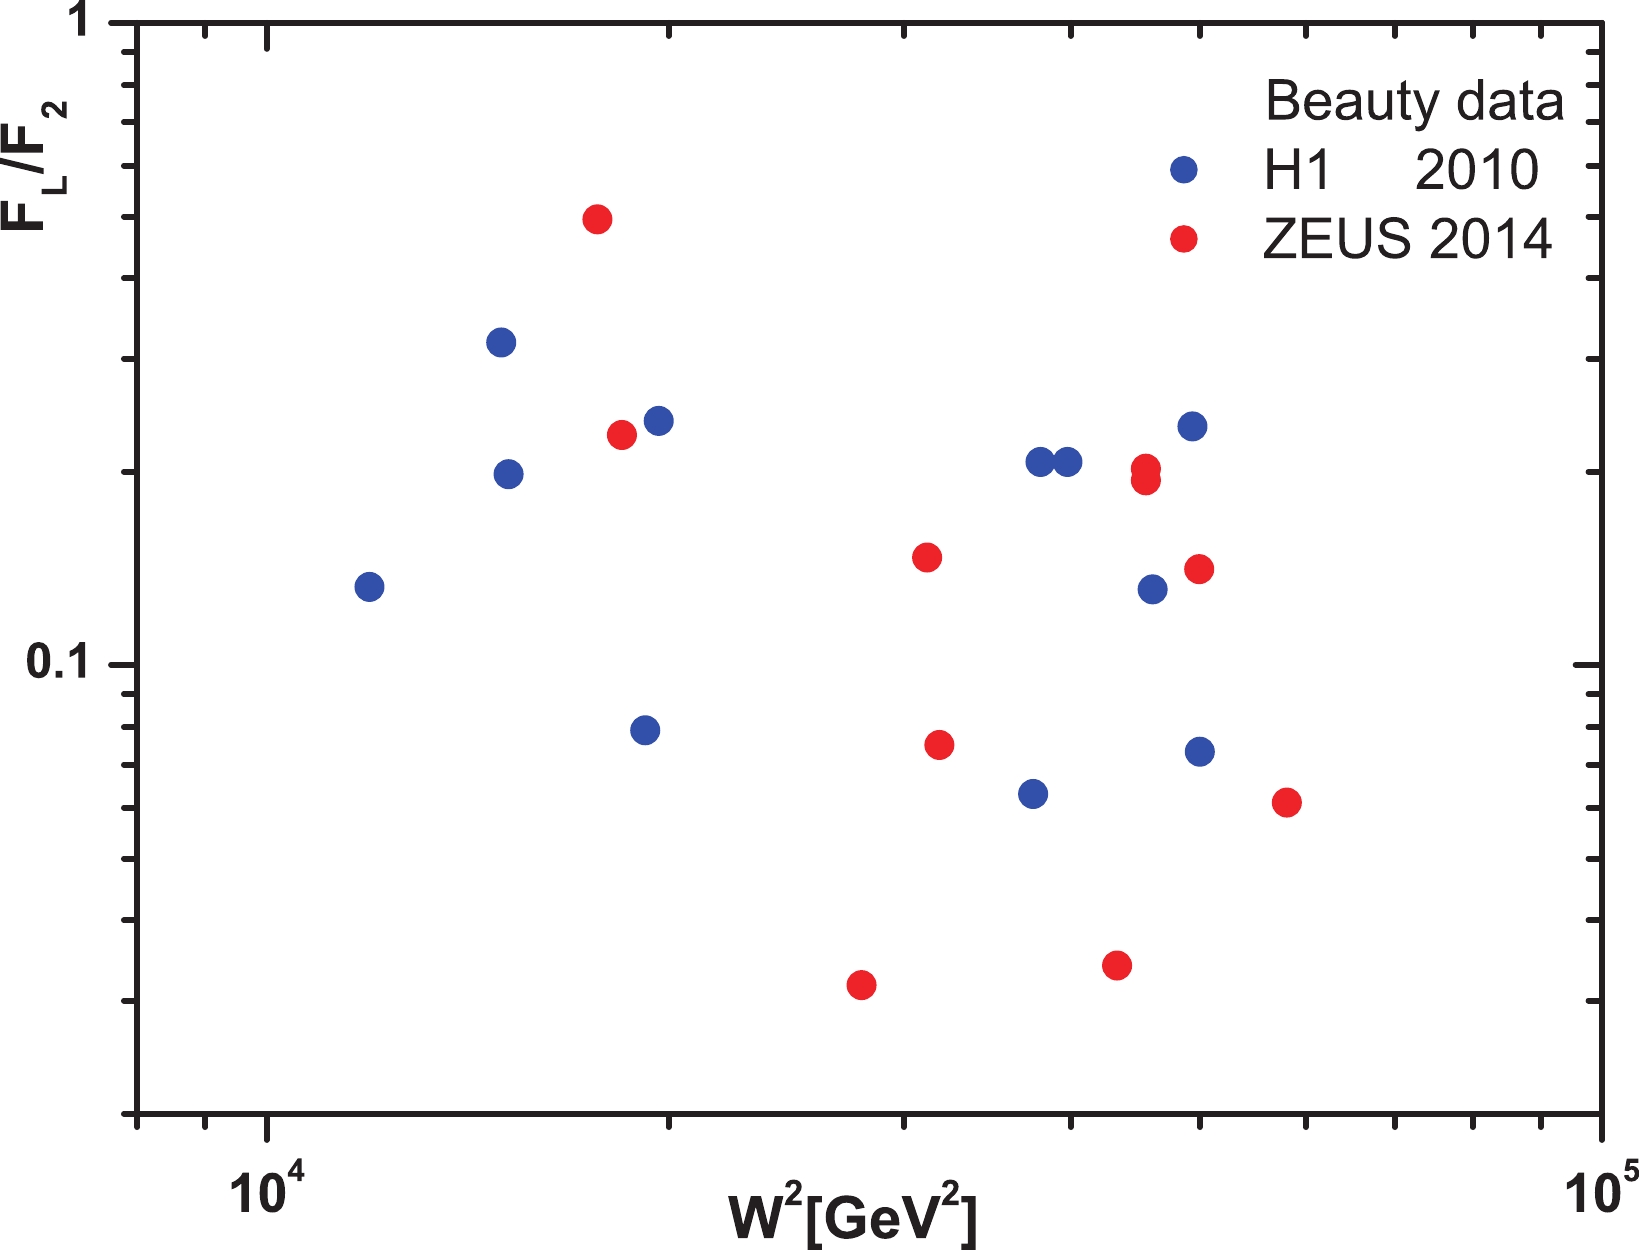
In Refs. [1] and [2], the reduced cross-sections and structure functions of the charm and beauty quarks at center-of-mass energies
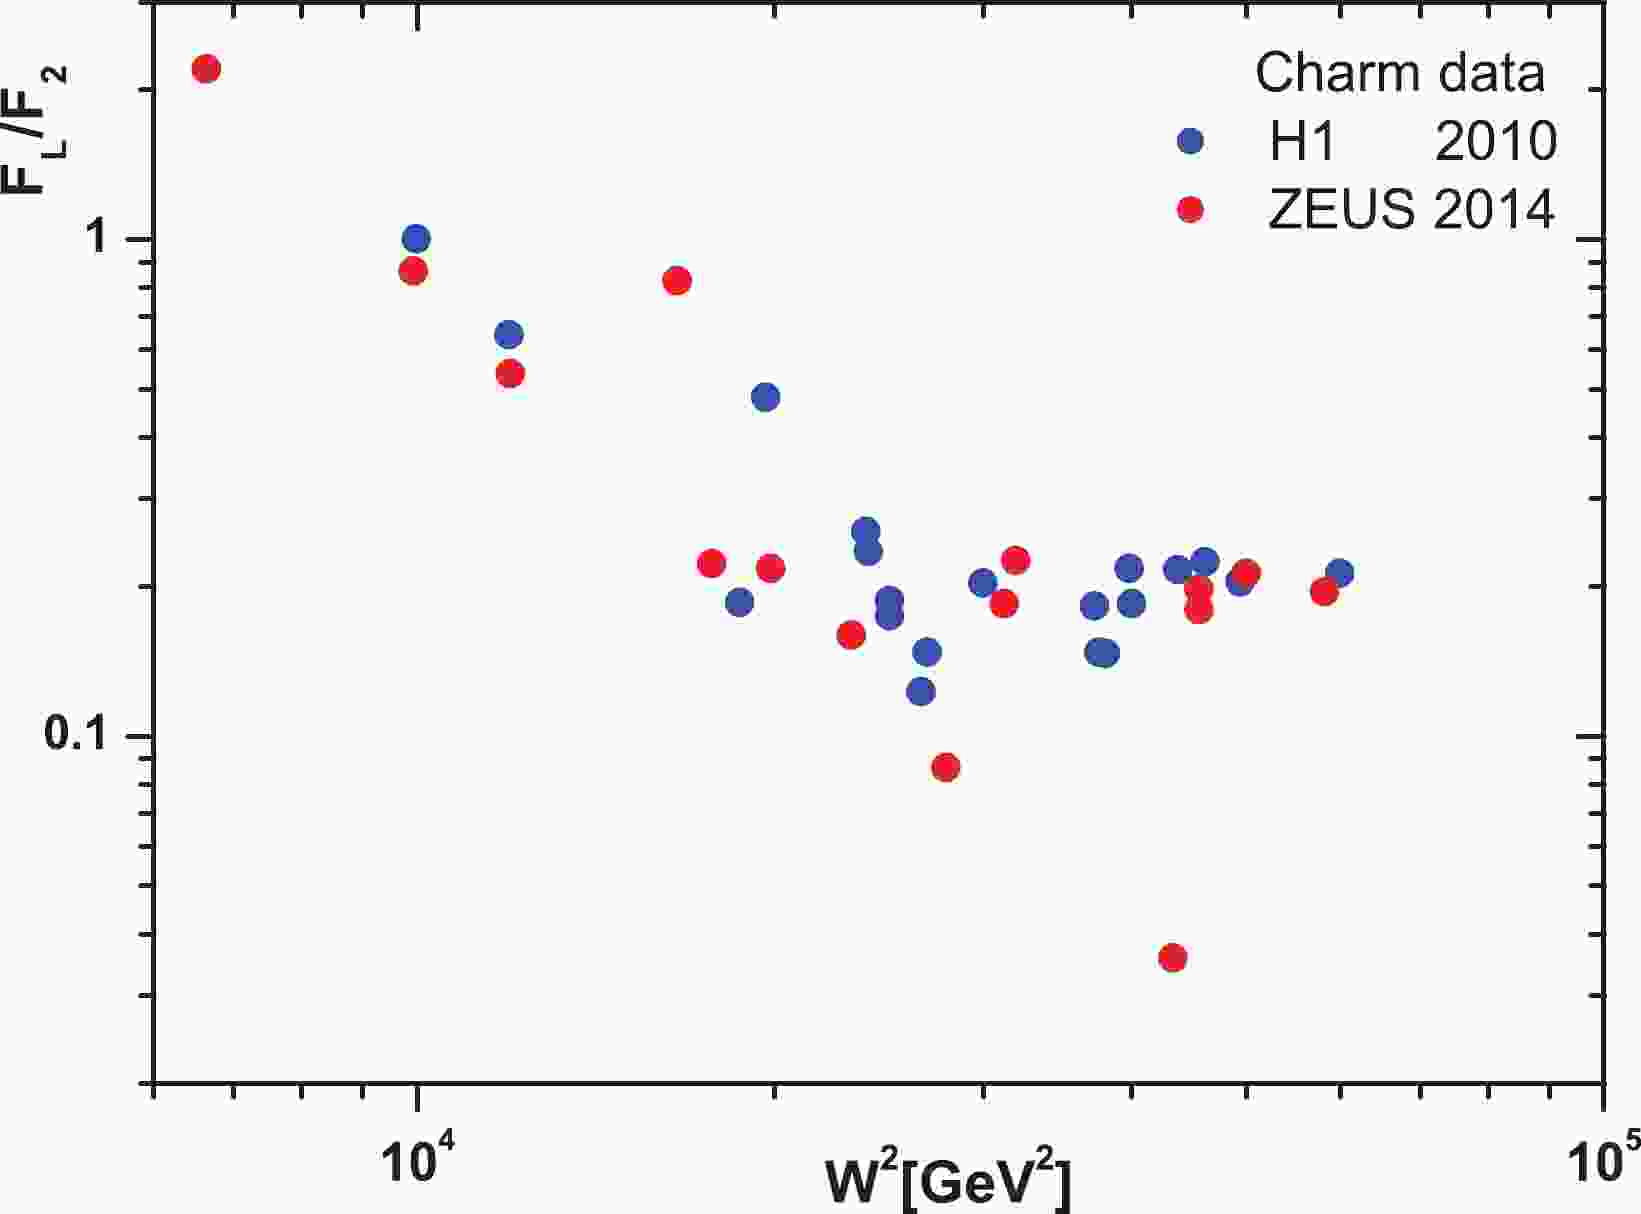
$ \sqrt{s} = 319\; \mathrm{GeV} $ and$ \sqrt{s} = 318\; \mathrm{GeV} $ can be observed respectively. The masses of the charm and beauty quarks are set to$ m_{c} = 1.5\; \mathrm{GeV} $ and$ m_{b} = 4.75\; \mathrm{GeV} $ respectively. The extracted values of$ \dfrac{F_{L}^{c\overline{c}}}{F_{2}^{c\overline{c}}} $ and$ \dfrac{F_{L}^{b\overline{b}}}{F_{2}^{b\overline{b}}} $ from the HERA data in Refs. [1] and [2] are given in Figs. 1 and 2 respectively. In these figures the ratio of structure functions for the charm and beauty quarks is plotted over a wide range of the invariant mass$ W^{2} $ . Calculations allowed the invariant mass$ W^{2} $ to vary in the interval$ 5000<W^{2}<60000\; \mathrm{GeV}^{2} $ when$ x $ and$ Q^{2} $ vary according to the HERA data. We observe that these ratios of structure functions are statistically very scattered. However, according to Eq. (19), the linear fit of these HERA data indicates the difference between intercepts for charm and beauty quark production. The results of this linear fit are given in Table 2. Our belief is that the behavior of$ \lambda_{2}^{{\cal{Q}}\overline{{\cal{Q}}}} $ corresponds to hard pomeron behavior. Based on this, the$ \lambda_{L}^{{\cal{Q}}\overline{{\cal{Q}}}} $ intercept can be determined based on the HERA data. Nevertheless, the data have the striking property that the ratio of structure functions behaves according to the following form:$ \frac{F_{L}^{{\cal{Q}}\overline{{\cal{Q}}}}(W^{2})}{F_{2}^{{\cal{Q}}\overline{{\cal{Q}}}}(W^{2})}. \frac{f_{2}^{{\cal{Q}}\overline{{\cal{Q}}}}}{f_{L}^{{\cal{Q}}\overline{{\cal{Q}}}}} = (W^{2})^{\Delta{\lambda_{L2}^{{\cal{Q}}\overline{{\cal{Q}}}}}}, $

(21) where
$ F_{2,L}^{{\cal{Q}}\overline{{\cal{Q}}}}(W^{2}){ \simeq}f_{2,L}^{{\cal{Q}}\overline{{\cal{Q}}}}. (W^{2})^{\lambda_{2,L}} $ . Figure 3 shows this ratio (i.e., Eq. (21)) according to Table 2, and shows that the importance of measuring the longitudinal structure function for the beauty quark is not less than that of the charm quark. In this figure,$ \Delta\lambda = \lambda_{L}-\lambda_{2} $ is obtained from a linear fit to the heavy quark structure functions into the invariant center-of-mass energy. Because the heavy quark longitudinal structure function data scatter is high for H1 and ZEUS (according to Figs. 1 and 2), the linear fit of the data shows a noticeable difference in this figure. However, these fits can give comparable results below. According to Eq. (14), our results for the ratio$ F_{L}^{{\cal{Q}}\overline{{\cal{Q}}}}/F_{2}^{{\cal{Q}}\overline{{\cal{Q}}}} $ are described in Fig. 4 for charm and beauty quarks over a wide range of invariant mass$ W^{2} $ . The masses of the charm and beauty quarks are defined according to Table 3. In this figure, our results at$ Q^{2} = 60 $ and$ 80\; \mathrm{GeV}^{2} $ are compared with HERA data from Refs. [1, 2]. These results are comparable with HERA data. As we see in this figure (i.e., Fig. 4, the value of this ratio is almost constant over a wide range of invariant mass. This ratio for the charm quark at both$ Q^{2} $ values is almost$ 0.21 $ and for the beauty quark it is almost$ 0.13-0.15 $ . This conclusion for the charm quark is close to the results given in Refs. [36-41, 63-71, 91-93]. In Fig. 5 we present the ratio$ F_{L}^{{\cal{Q}}\overline{{\cal{Q}}}}/F_{2}^{{\cal{Q}}\overline{{\cal{Q}}}} $ for charm and beauty quarks as a function of$ Q^{2} $ at$ W = 200\; \mathrm{GeV} $ . We can see that the obtained results are in agreement with those from experiment. The maximum value for charm and beauty ratios is the same and is equal to$ \simeq 0.21 $ over a wide range of$ Q^{2} $ values. This maximum value shifts to larger$ Q^{2} $ values for the beauty quark. Indeed, it shifts from$ Q^{2}{\simeq}60\; \mathrm{GeV}^{2} $ for charm to$ Q^{2}{\simeq}800\; \mathrm{GeV}^{2} $ for the beauty quark. In these calculations, the errors are due to calculation errors related to the charm and beauty quark masses and the gluon intercept. Indeed, the average of the hard pomeron and color dipole models for the gluon exponent is assumed as$ \lambda_{g} = 0.4{\pm} $ $ 0.1 $ . In this figure we also compare our results for the ratio of structure functions for charm and beauty with HERA data [1, 2]. Although errors related to the experimental data are not available, the comparison of these results with HERA data are very good. It should be noted that the data collected from HERA are related to$ 175<W<225\; \mathrm{GeV} $ , and this is the reason for the error between our results (at$ W = 200\; \mathrm{GeV} $ ) and HERA data.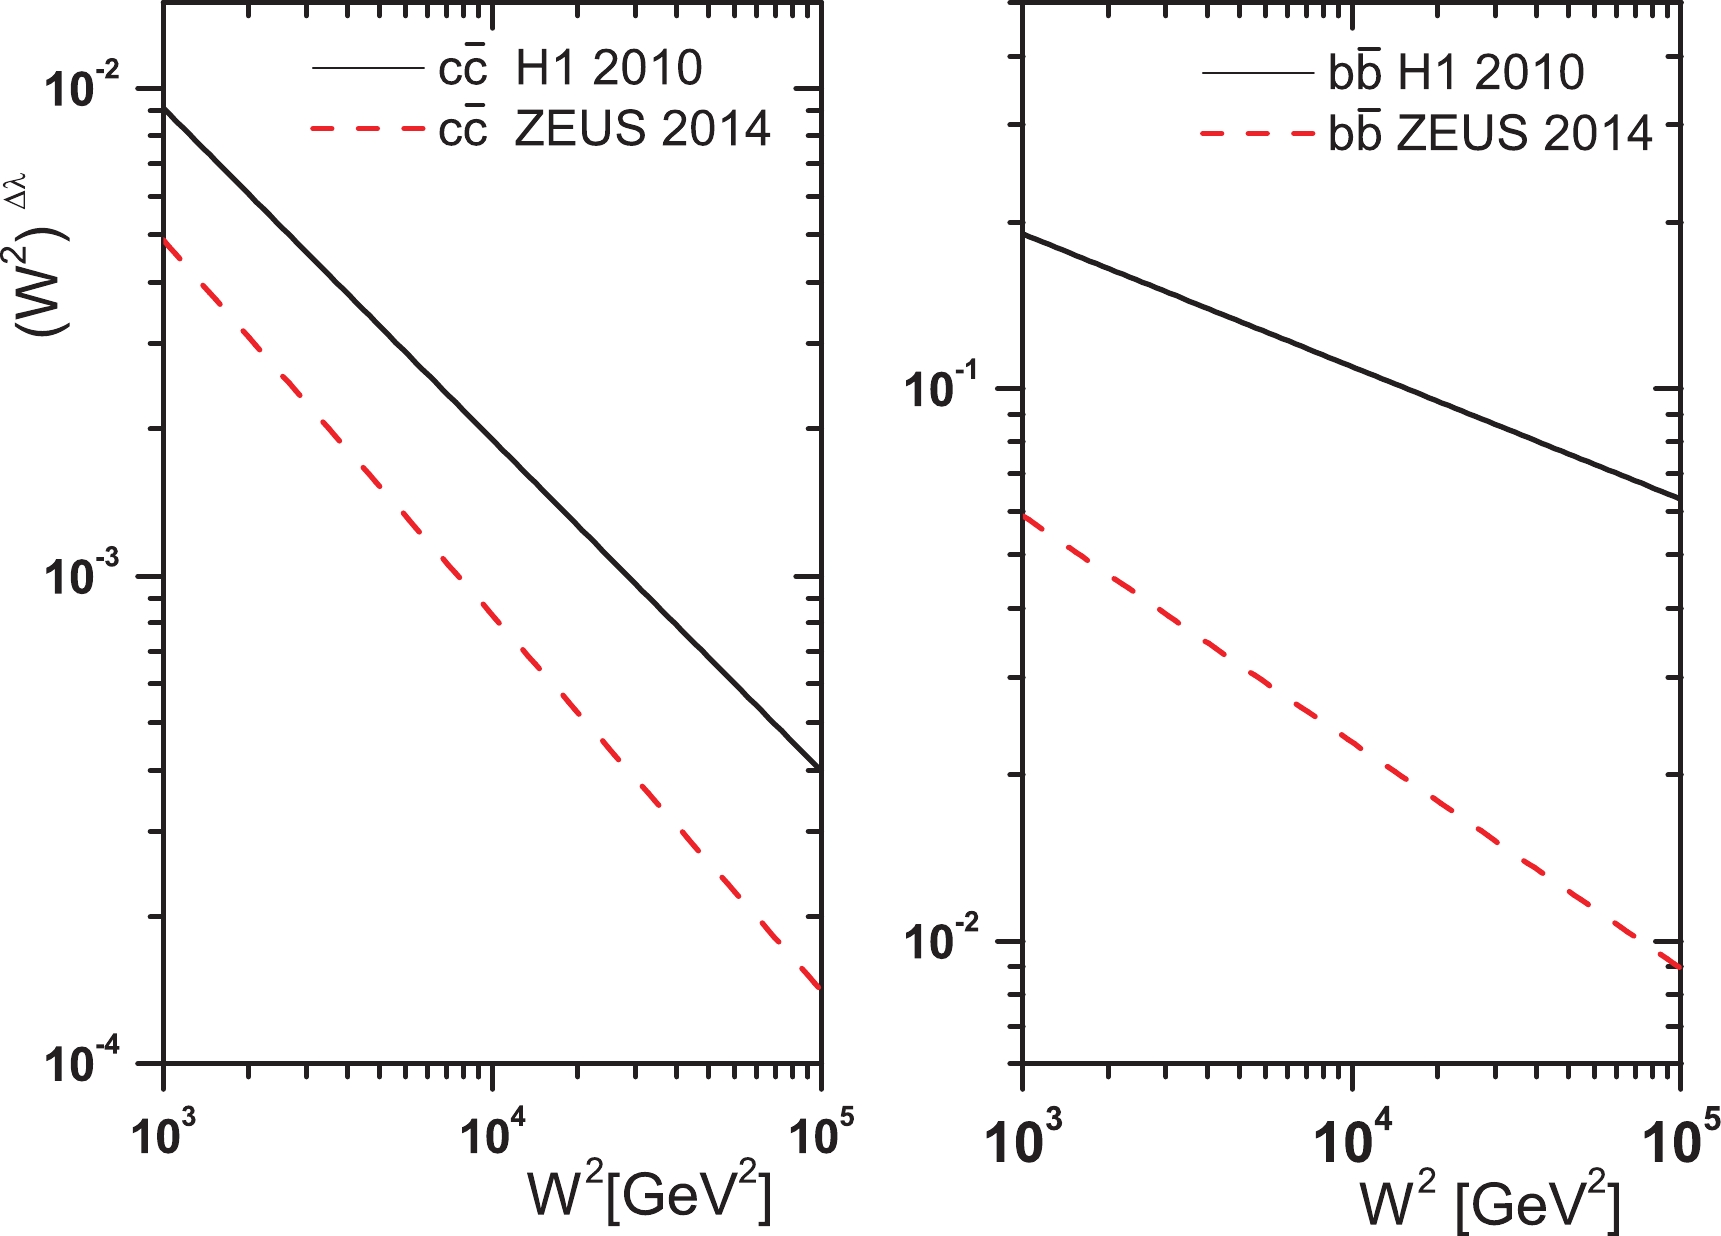
Figure 3. (color online) Behavior of function
$ (W^{2})^{\Delta\lambda} $ , for (left) charm and (right) beauty, with respect to HERA data (H1 2010 [1] and ZEUS 2014 [2]), shown as a function of$ W^{2} $ values.$ \Delta\lambda = \lambda_{L}-\lambda_{2} $ is obtained from a linear fit to the structure functions into the invariant center-of-mass energy.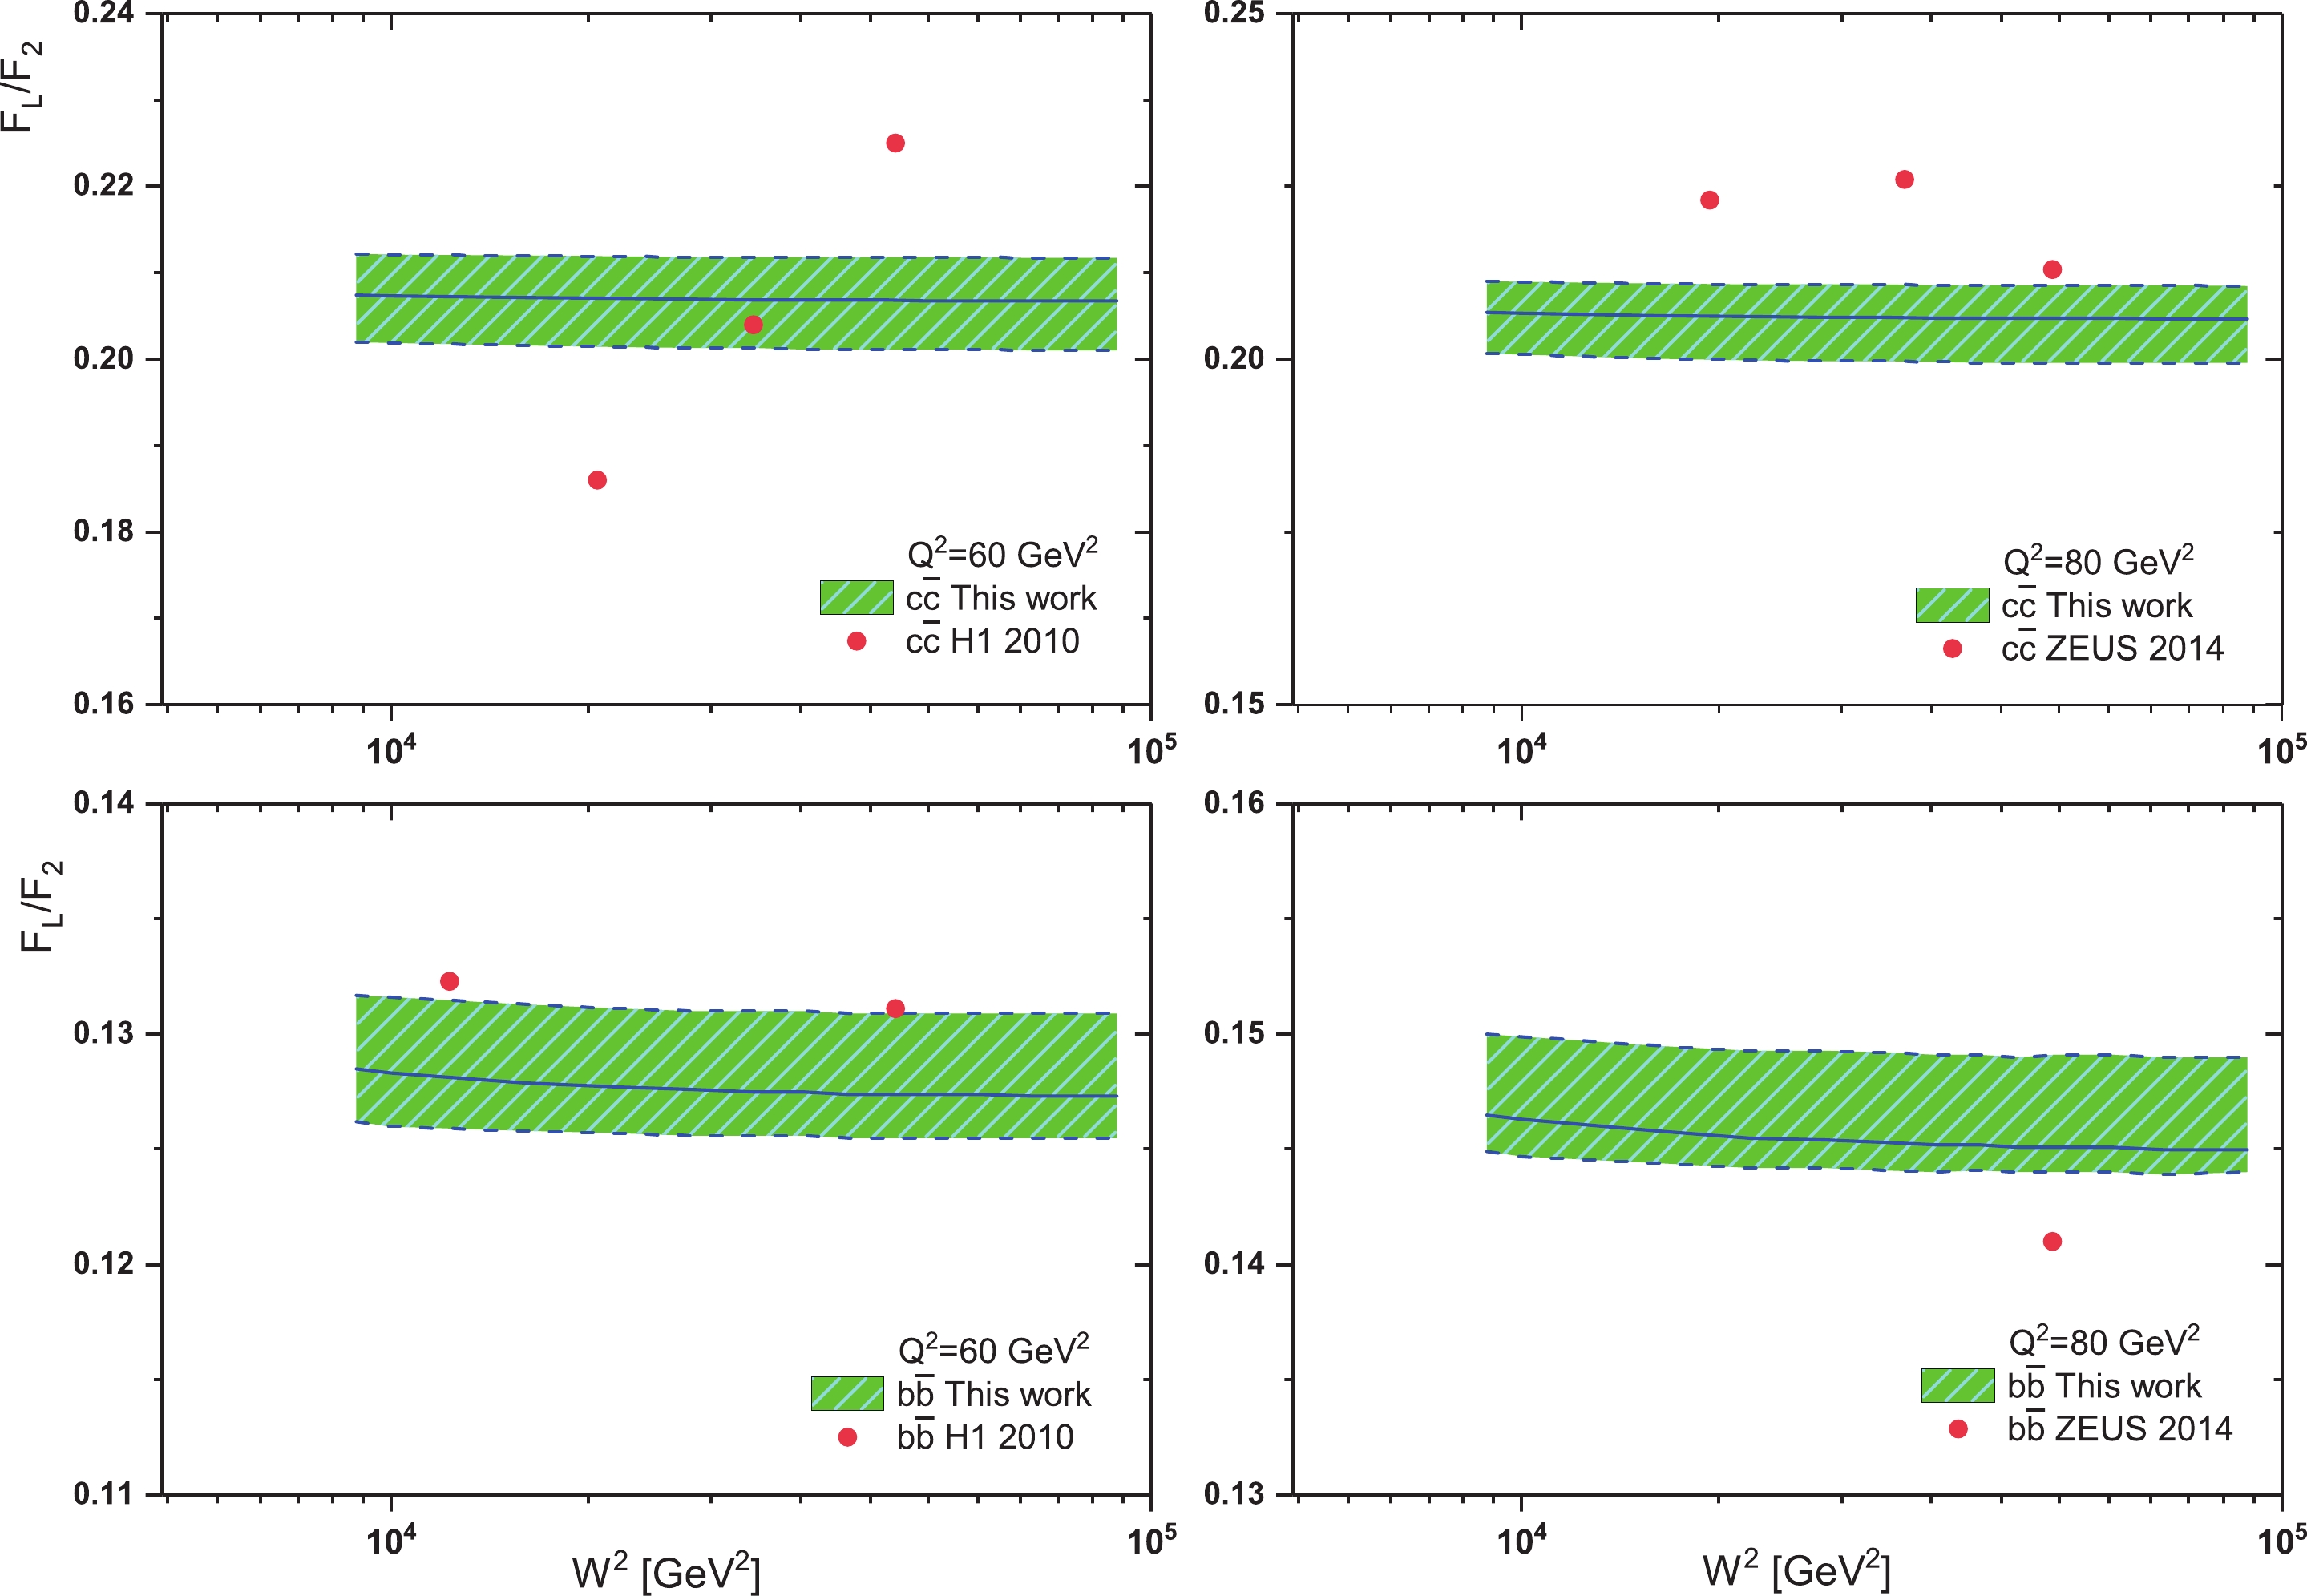
Figure 4. (color online) Obtained
$ F_{L}^{{\cal{Q}}\overline{{\cal{Q}}}}/F_{2}^{{\cal{Q}}\overline{{\cal{Q}}}} $ for charm and beauty pair production, shown as a function of$ W^{2} $ for$ Q^{2} = 60 $ and$ 80\; \mathrm{GeV}^{2} $ . The error bands show the mass error and the gluon exponent error added in prediction. The combined HERA data [1, 2] are also shown.Quark Mass exp/fit Model Parameterization c 1.290 GeV $ ^{{+0.046}}_{{-0.041}} $ 

$ ^{{+0.062}}_{{-0.014}} $ 

$ ^{{+0.003}}_{{-0.031}} $ 

b 4.049 GeV $ ^{{+0.104}}_{{-0.109}} $ 

$ ^{{+0.090}}_{{-0.032}} $ 

$ ^{{+0.001}}_{{-0.031}} $ 

Table 3. Heavy quark masses, with statistical and systematic uncertainties [3].
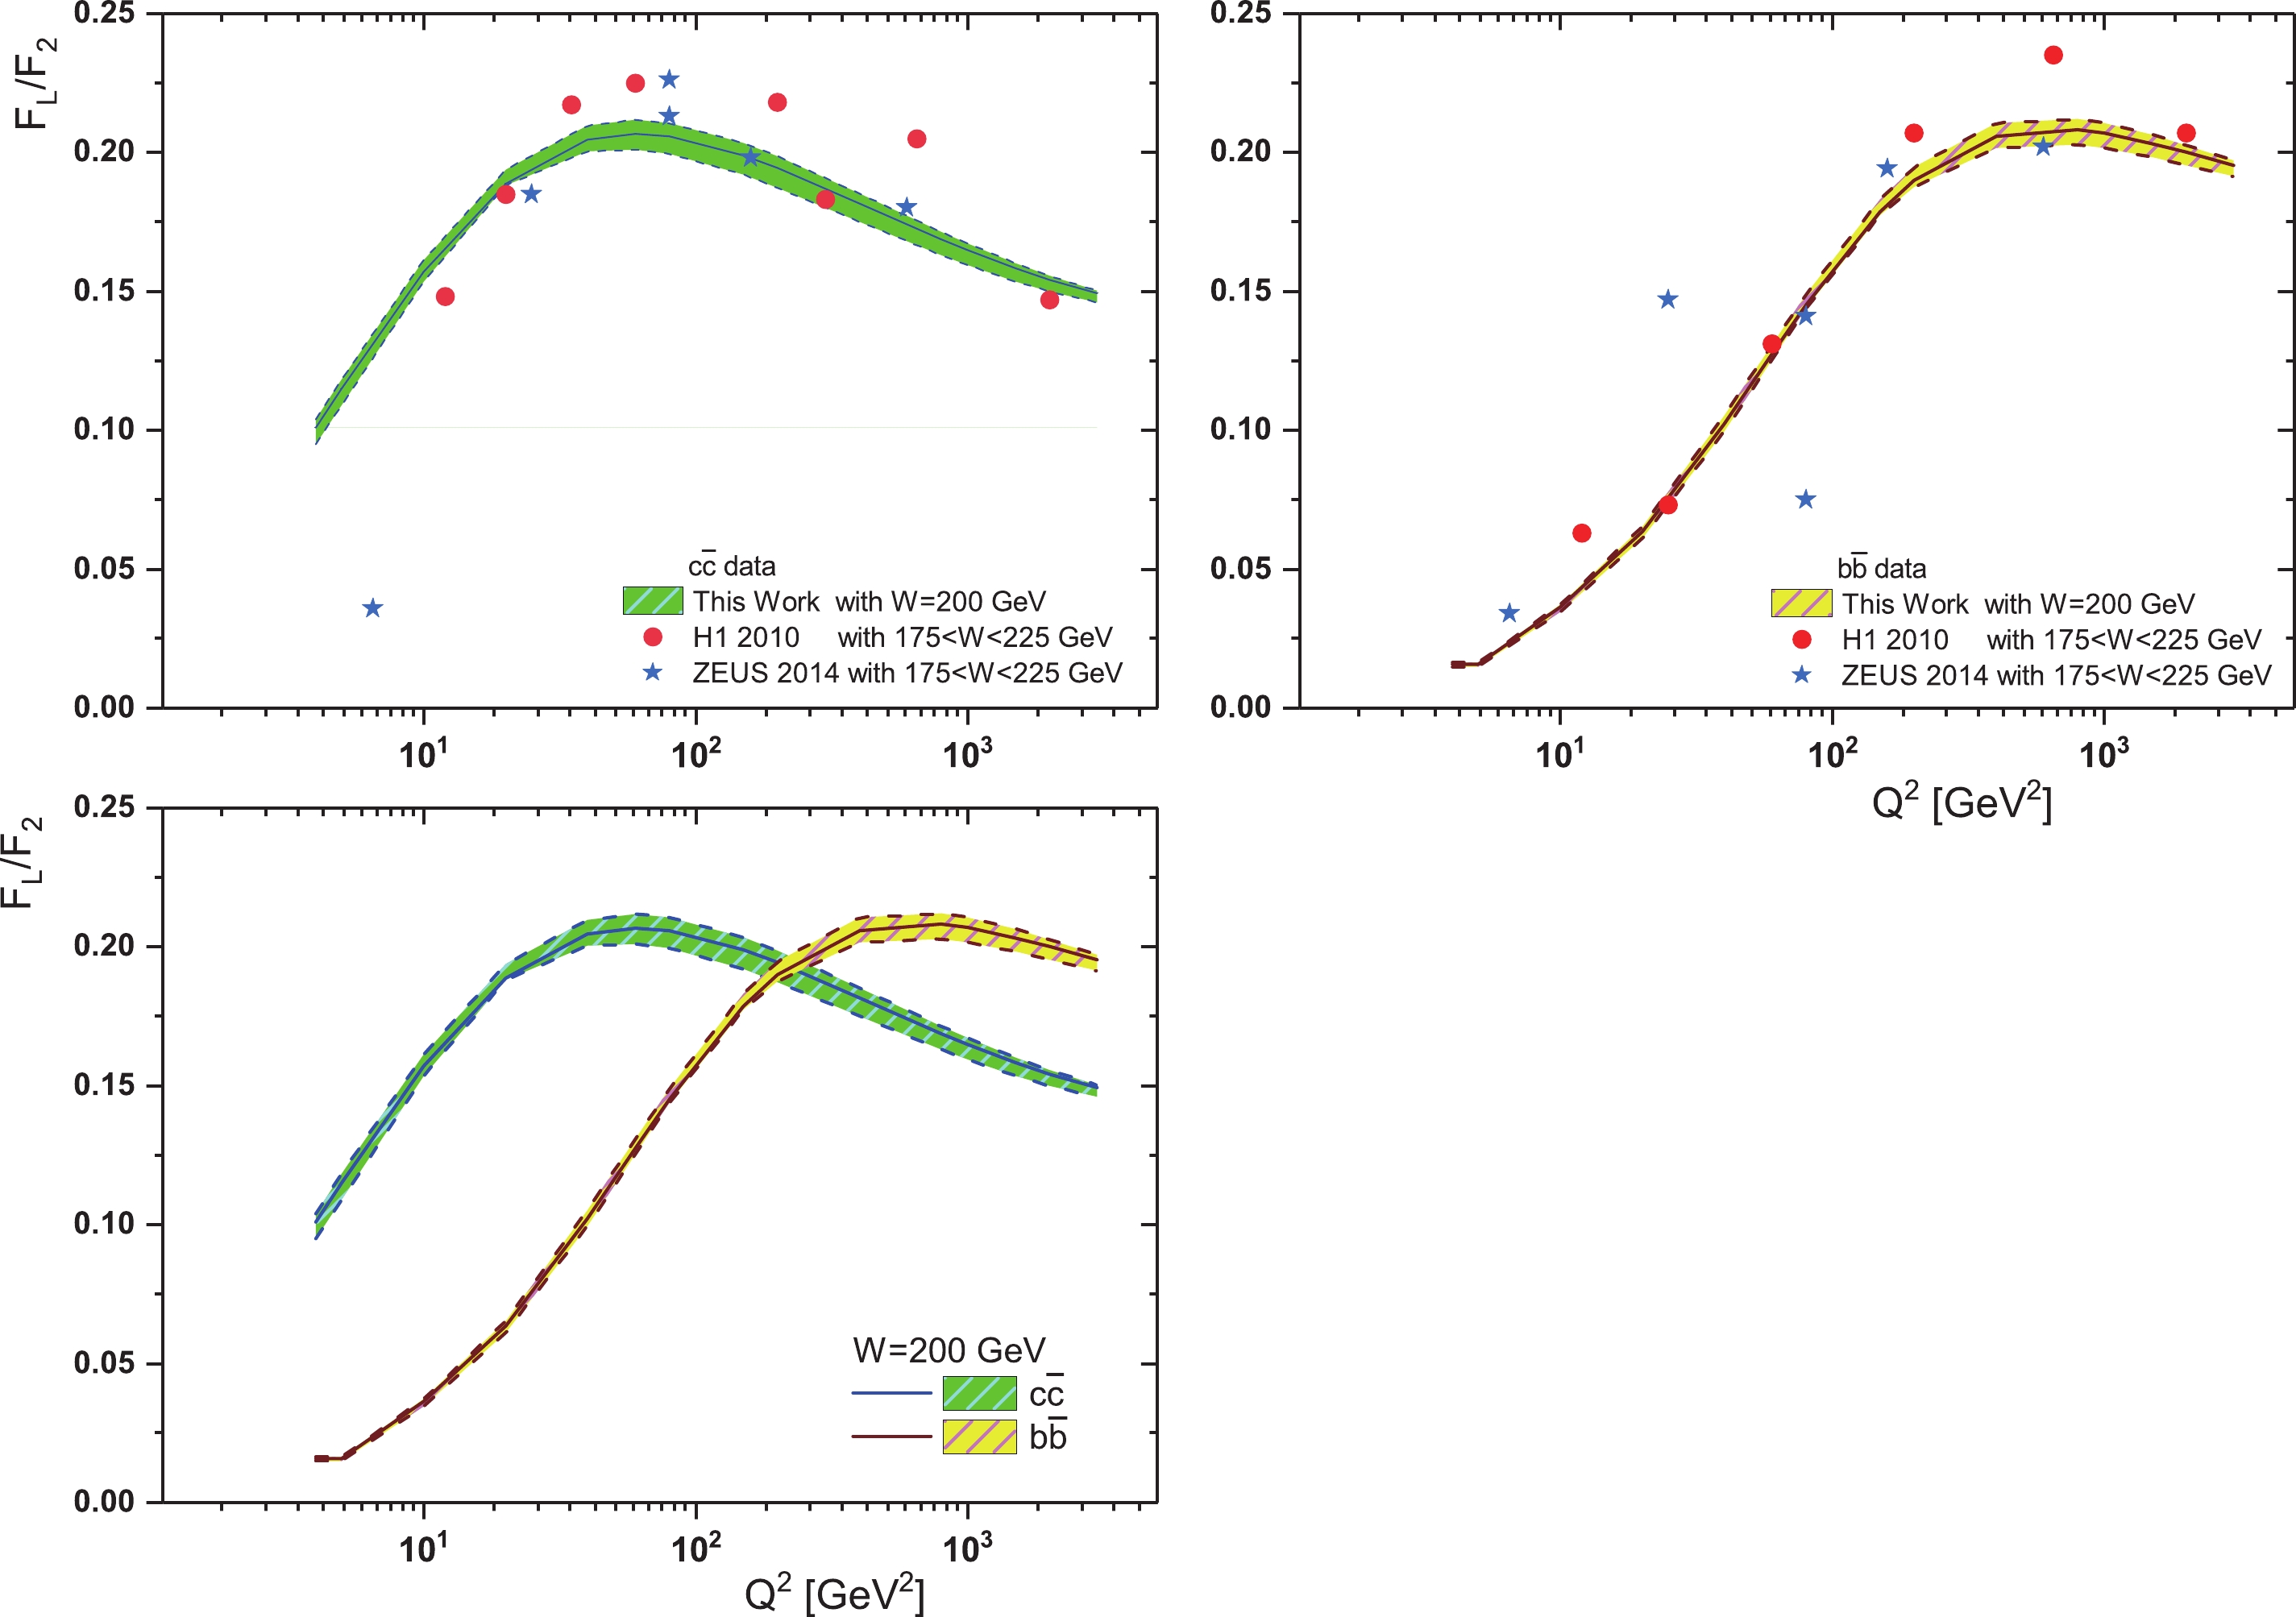
Figure 5. (color online) The ratio
$ F_{L}^{{\cal{Q}}\overline{{\cal{Q}}}}/F_{2}^{{\cal{Q}}\overline{{\cal{Q}}}} $ for charm and beauty pair production, shown as a function of$ Q^{2} $ for fixed$ W^{2} $ . The error bands show the mass error and the gluon exponent error added in prediction. Our results for charm and beauty are shown for$ W = 200\; \mathrm{GeV} $ and compared with H1 2010 [1] and ZEUS 2014 [2] data in$ 175<W<225\; \mathrm{GeV} $. Now we focus attention on the energy shift from HERA to the LHeC. LHeC data will also allow us to increase our knowledge of heavy flavour structure functions [94, 95]. Due to the increase in center-of-mass energy in new colliders, the LHeC will provide data on charm and beauty structure functions extending over nearly 5 and 6 orders of magnitude in
$ x $ and$ Q^{2} $ respectively [27, 28]. According to the predicted energy range for the LHeC, the center-of-mass energy will be in the range$ 10^{2}{\leqslant}W^{2}{\leqslant} $ $ 10^{6}\; \mathrm{GeV}^{2} $ . In Fig. 6, phenomenological predictions of the charm and beauty structure functions are determined at center-of-mass energy$ \sqrt{s} = 1.3\; \mathrm{TeV} $ . We can see that as the energy increases, the maximum values for these ratios are still$ \simeq 0.21 $ . However, the value of$ Q^{2} $ increases slightly, as the maximum ratio value$ F_{L}^{c\overline{c}}/F_{2}^{c\overline{c}} $ is of the order$ {\cal{O}}(100\; \mathrm{GeV}^{2}) $ , and the maximum ratio value$ F_{L}^{b\overline{b}}/F_{2}^{b\overline{b}} $ is of the order$ {\cal{O}}(1000\; \mathrm{GeV}^{2}) $ . In this figure (i.e., Fig. 6, we show the$ Q^{2} $ dependence of the heavy quark structure functions evaluated at NLO analysis.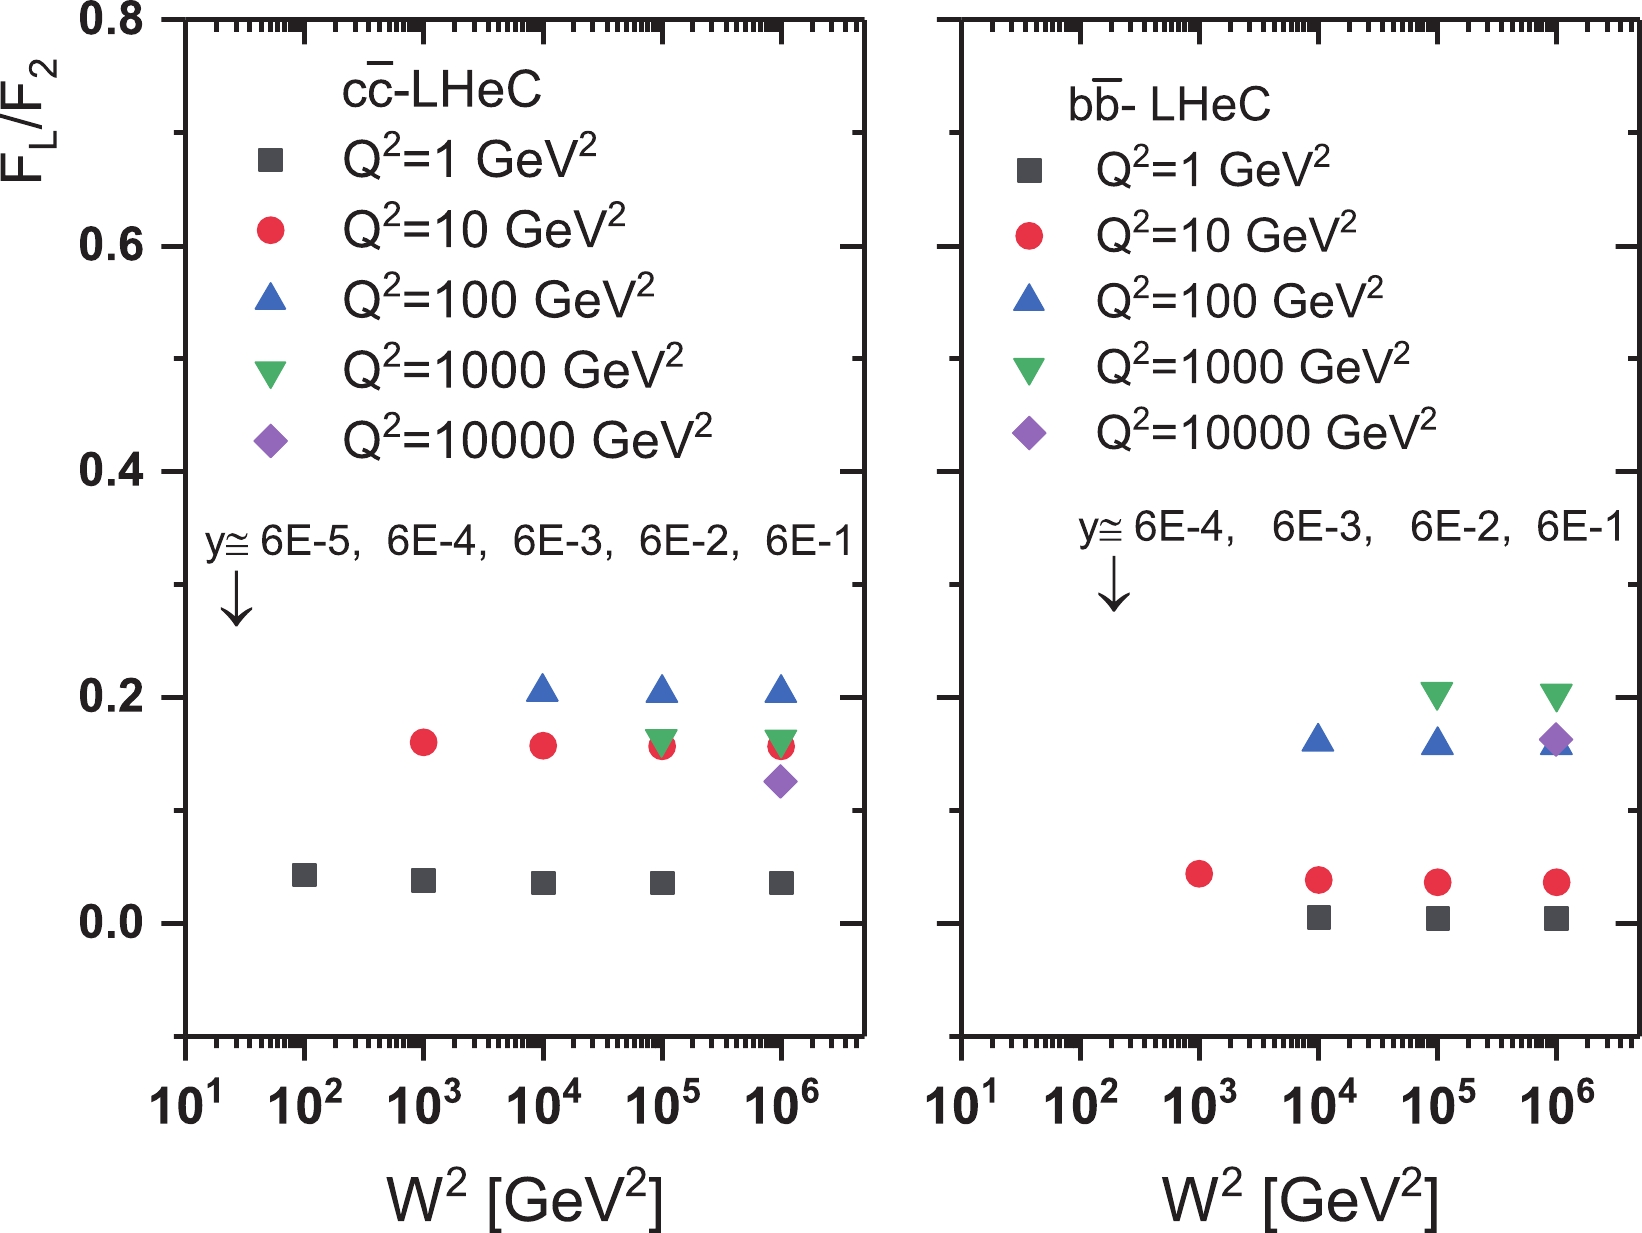
Figure 6. (color online) Theoretical predictions for the ratio of (left) charm and (right) beauty structure functions at
$ \sqrt{s}{ = }1.3\; \mathrm{TeV} $ (LHeC center-of-mass energy) shown as a function of$ W^{2} $ for different$ Q^{2} $ values. The predictions for different inelasticity$ y $ values are also shown. -
Top quark pairs can be produced the LHeC and FCC-eh from
$ \gamma^{*}p{\rightarrow}t\overline{t} $ reactions. DIS measurements at LHeC and FCC-eh will allow determination of the top distribution function. The production of top quarks in electron-proton collisions at LHeC and FCC-eh can provide a stringent test of new physics at ultra-high energy (UHE), with the proposed center-of-mass energies being$ 1.3 $ and$ 3.5\; \mathrm{TeV} $ respectively. One of the QCD corrections in top quark production is the QCD coupling$ \alpha_{s}(\mu^{2}) $ ($ \mu^{2}{\propto}\beta^{2}\widehat{s} $ where$ \beta $ is the$ {\cal{Q}}\overline{{\cal{Q}}} $ relative velocity and$ \widehat{s} = 4m_{t}^{2} $ ) [94, 95]. The running coupling constant at the LHeC is the H1 result at NNLO analysis with 0.2% uncertainty from the LHeC and 0.1% uncertainty when combined with HERA data [24-29, 96]. Here we use the active number of flavors$ n_{f} = 6 $ in the running of$ \alpha_{s} $ [27-29]. Because the top threshold is high enough, the range of inelasticity changes is very important in determining the ratio$ F_{L}^{t\overline{t}}/F_{2}^{t\overline{t}} $ . For$ Q^{2} = 40000-50000\; \mathrm{GeV}^{2} $ , where$ Q^{2}>m_{t}^{2} $ ($ m_{t} = 172{\pm} $ $ 0.5\; \mathrm{GeV} $ ), the area available in the future colliders covers the inelasticity from$ 0.300<y<0.800 $ and$ 0.080< $ $ y<0.850 $ at LHeC and FCC-eh respectively. The Wilson coefficient functions experience a slow rescaling by replacing$ z{\rightarrow}\chi $ . This changes the integration range of$ z $ in the convolutions to$ x\left(1+\dfrac{4m_{t}^{2}}{Q^{2}}\right){\leqslant}z{\leqslant}1 $ with the Bjorken variable$ x $ [34]. In the following we will discuss the ratio$ F_{L}^{t\overline{t}}/F_{2}^{t\overline{t}} $ in$ t\overline{t} $ production at the LHeC and FCC-eh. In Fig. 7 we present this ratio for$ Q^{2} = 40000 $ and$ 50000\; \mathrm{GeV}^{2} $ as a function of$ W^{2} $ . Because$ 0<y{\leqslant}1 $ , the range of$ x $ changes is very limited. Notice that the large inelasticity is only for scattered electron energies much smaller than the electron beam energy (i.e.,$ E'_{e}{\ll}E_{e} $ and$ y = 1-E'_{e}/E_{e} $ ). In this region where$ E'_{e} $ is small, the electromagnetic and hadronic backgrounds are important [27, 28]. The maximum value for the ratio$ F_{L}^{t\overline{t}}/F_{2}^{t\overline{t}} $ with respect to the inelasticities (i.e.,$ 0.300<y<0.800 $ and$ 0.080<y<0.850 $ at LHeC and FCC-eh, respectively) is almost$ \simeq 0.1 $ . Of course, this value for the ratio$ F_{L}^{t\overline{t}}/F_{2}^{t\overline{t}} $ also increases to$ \simeq 0.21 $ , when both$ Q^{2} $ and$ x $ values increase. In this regard, the$ Q^{2} $ value must be of order$ {\cal{O}}(100000\; \mathrm{GeV}^{2}) $ at LHeC and of order$ {\cal{O}}(1000000\; \mathrm{GeV}^{2}) $ at FCC-eh, with the$ x $ value of order$ {\cal{O}}(0.1) $ . All these predictions can be seen in Fig. 8. In this figure, the ratio of structure functions results for charm, beauty and top pair production are visible for the range of energies available for future accelerators. However, this range of$ x $ and$ Q^{2} $ will be seen in future accelerators.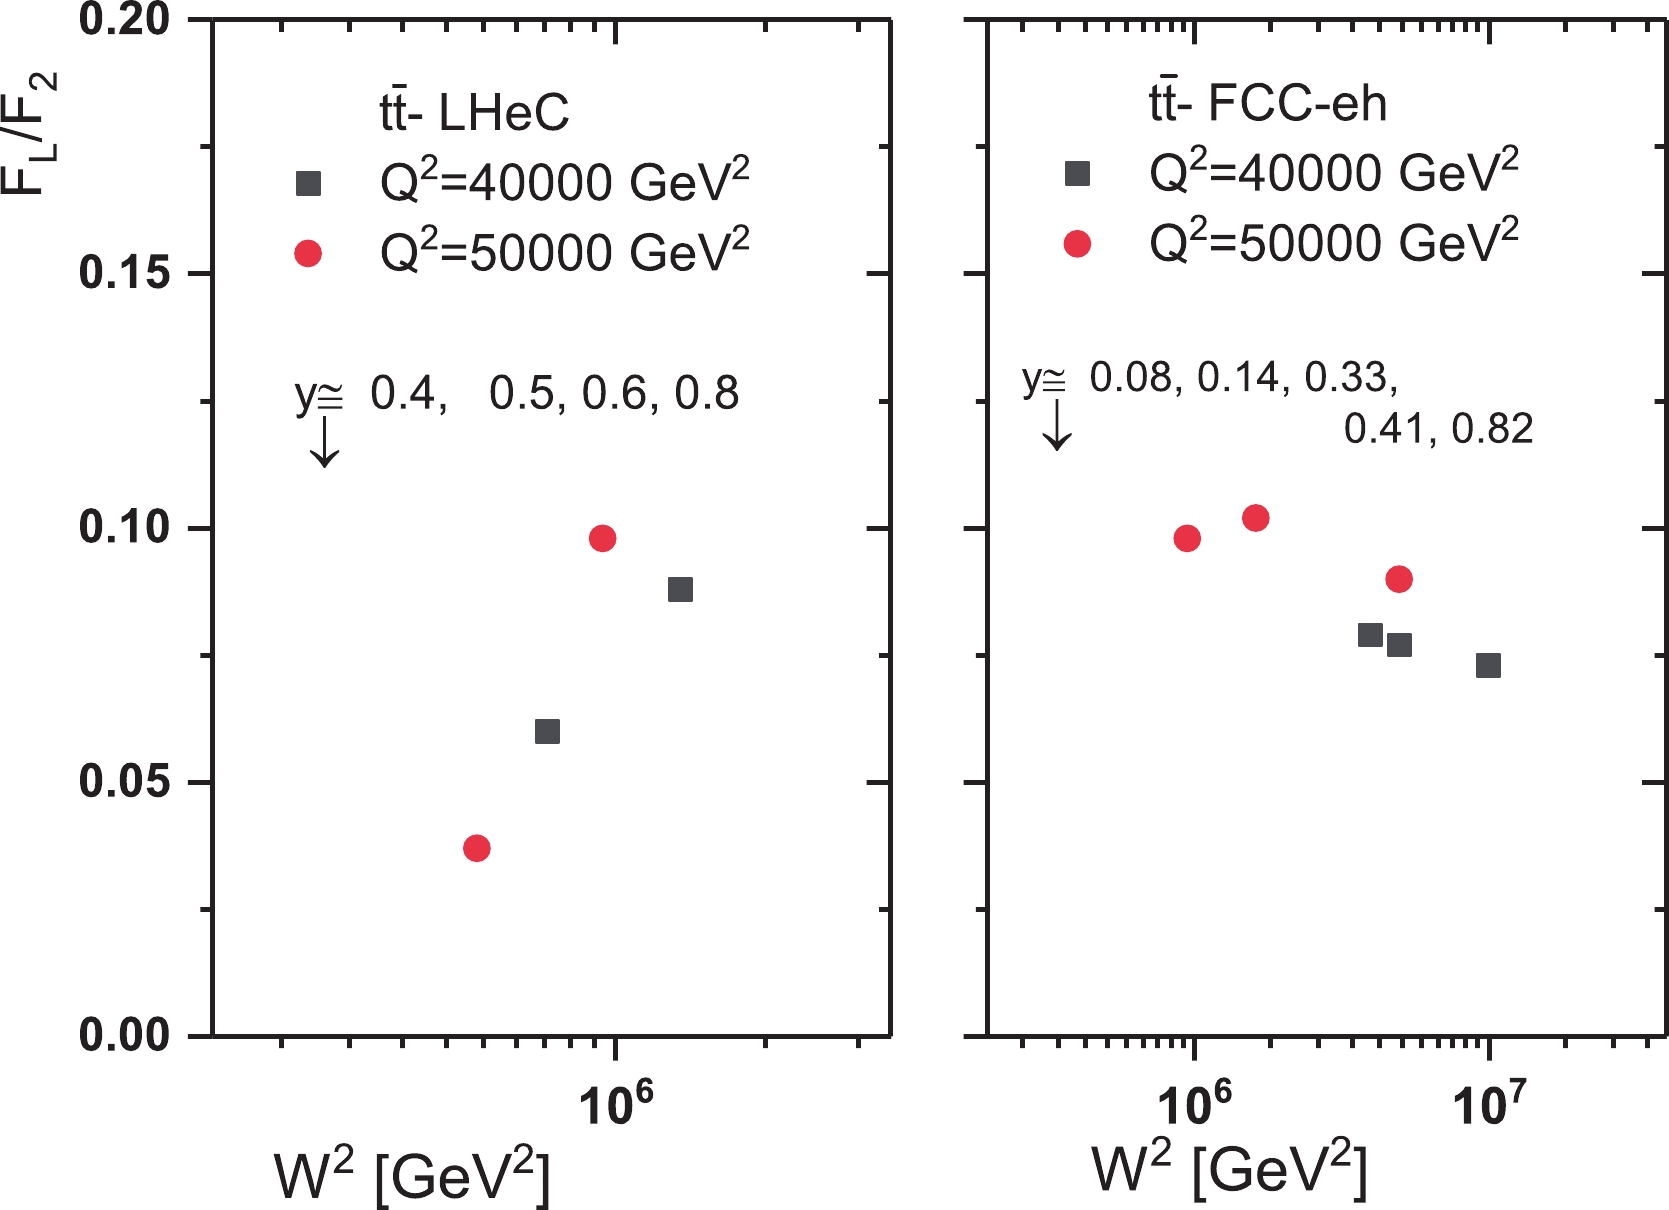
Figure 7. (color online) Theoretical predictions for the ratio of top structure functions at
$ \sqrt{s}{ = }1.3\; \mathrm{TeV} $ (LHeC center-of-mass energy, left) and at$ \sqrt{s}{ = }3.5\; \mathrm{TeV} $ (FCC-eh center-of-mass energy, right) shown as a function of$ W^{2} $ for$ Q^{2} = 40000 $ and$ 50000\; \mathrm{GeV}^{2} $ . The predictions for different inelasticity$ y $ values are also shown.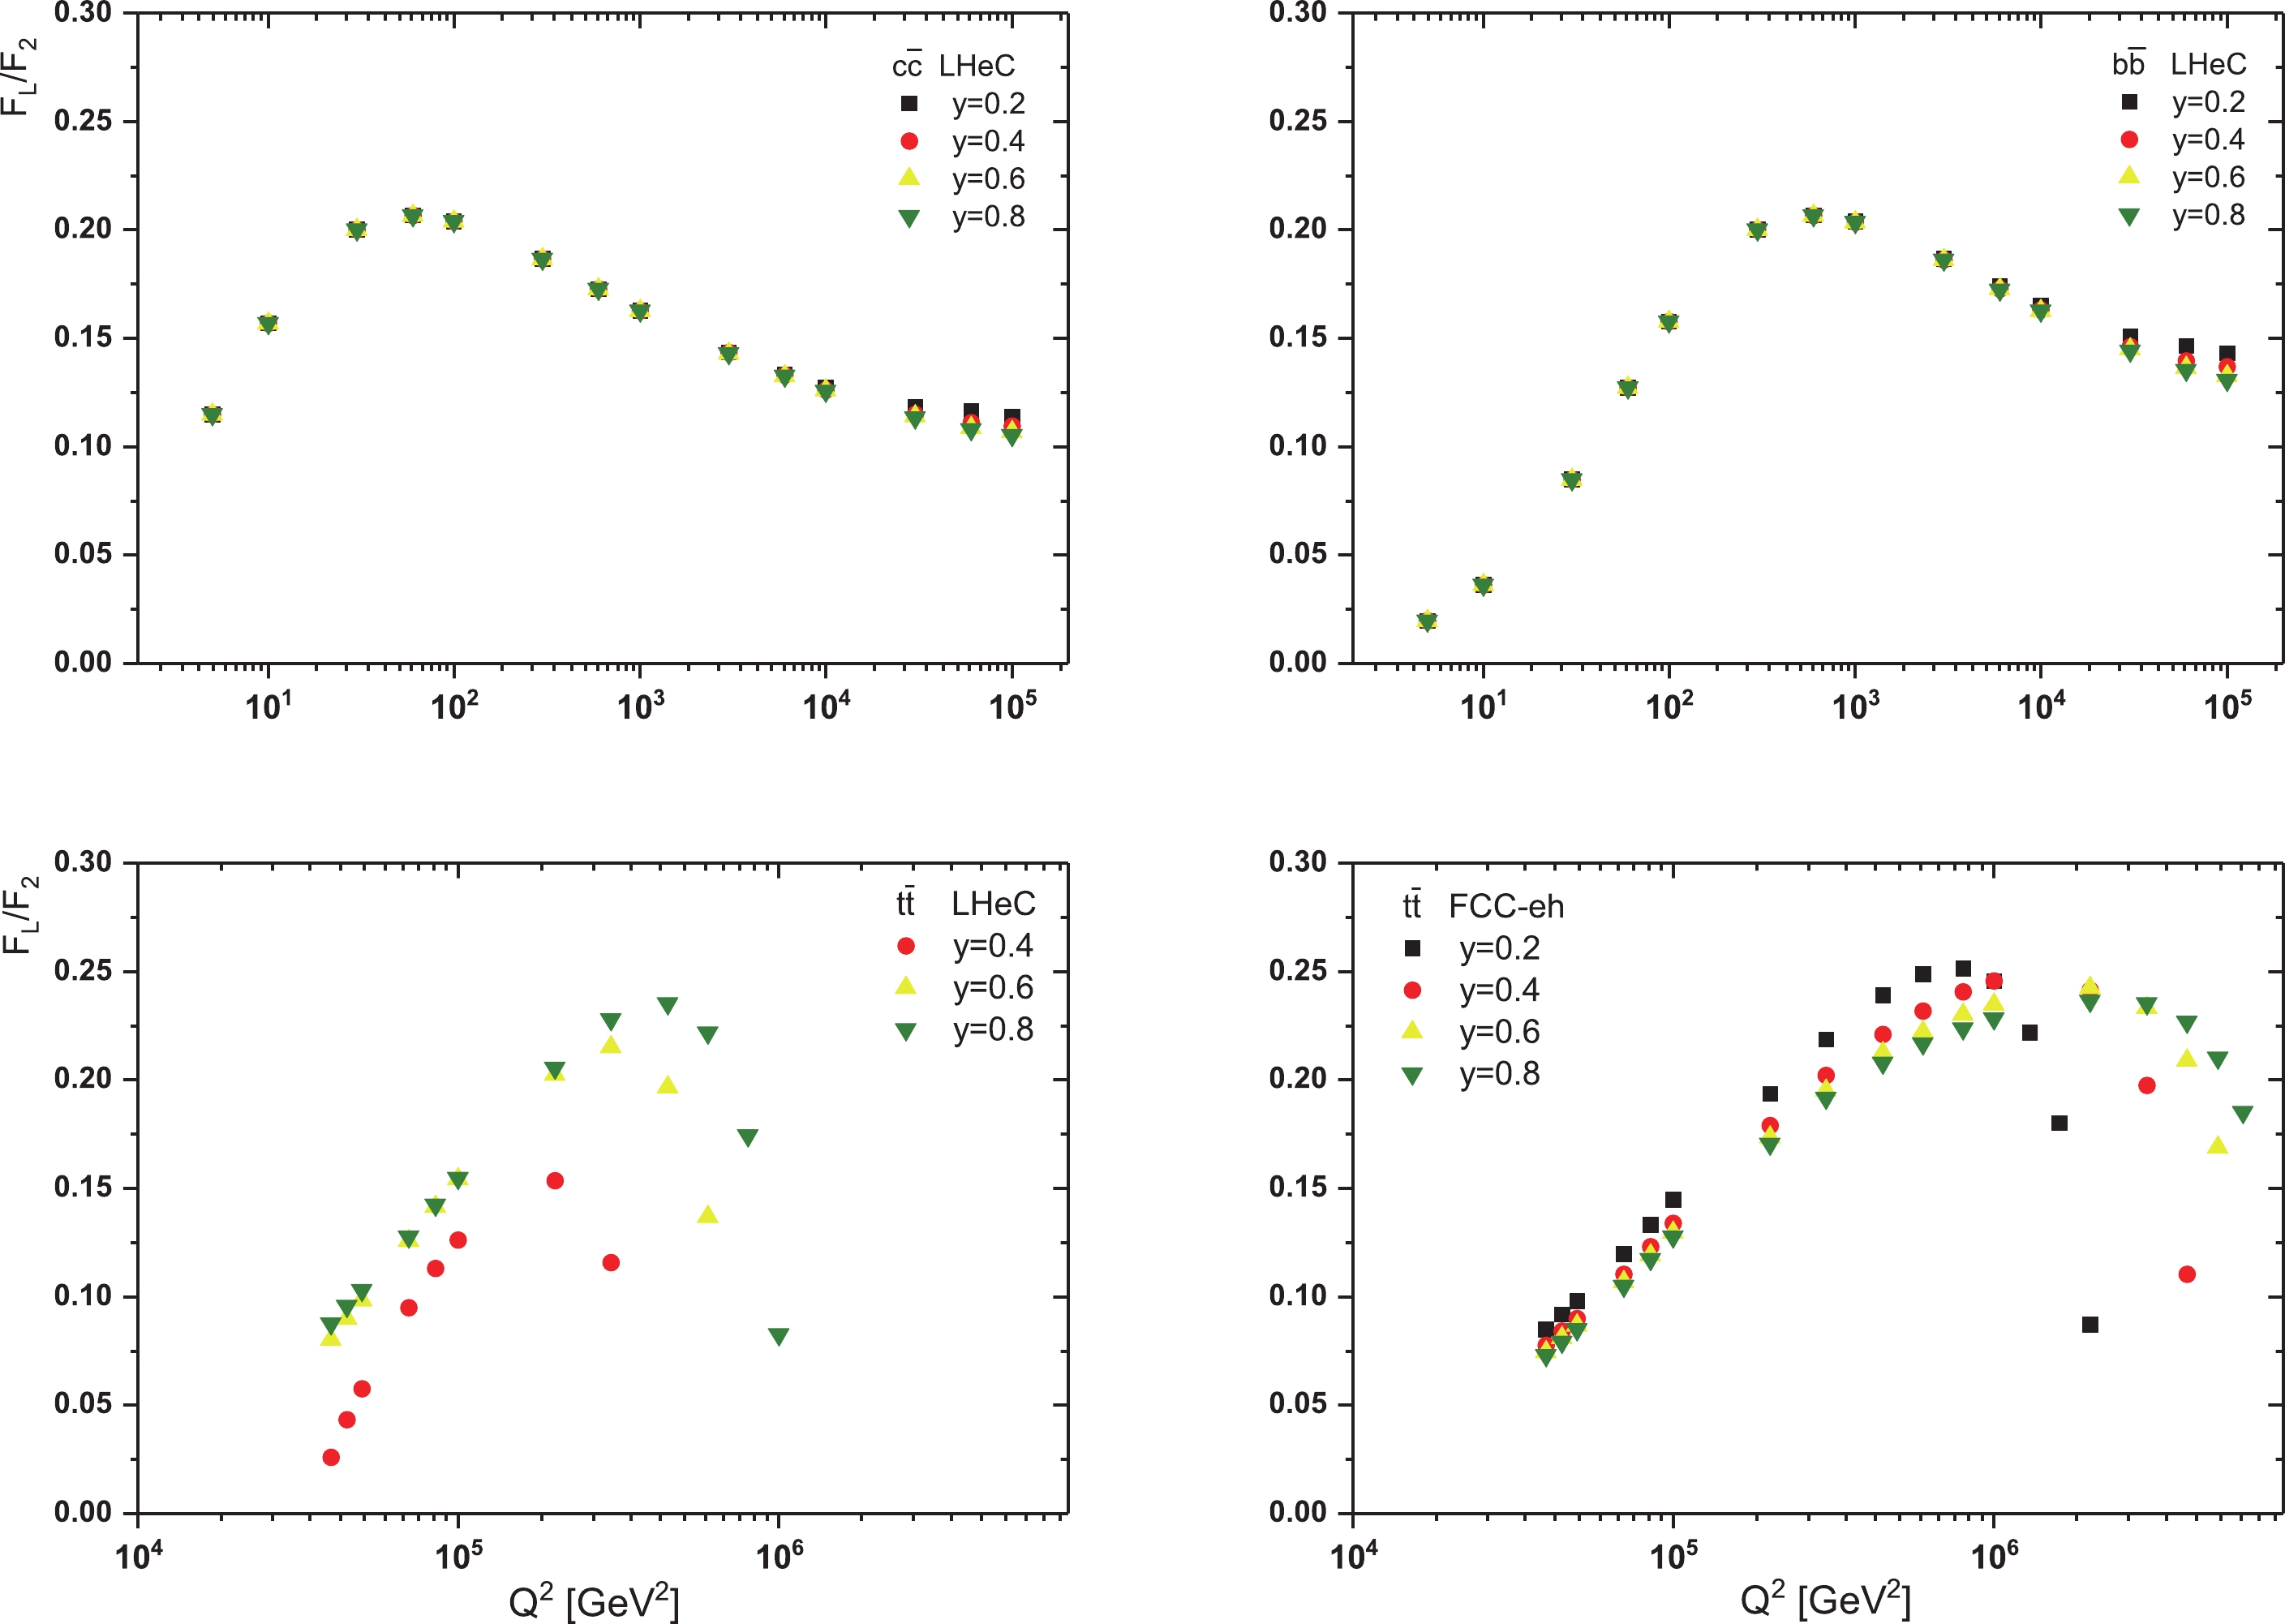
Figure 8. (color online) Theoretical predictions for the ratio of charm and beauty structure functions at LHeC center-of-mass energy and also the ratio of top structure functions at LHeC and FCC-eh center-of-mass energies shown as a function of
$ Q^{2} $ for y=0.2, 0.4, 0.6 and 0.8.For the calculations presented, we considered the mass error and the gluon exponent error. In all figures, bandwidth errors are included. In Fig. 9, we consider the effect of the renormalization/factorization scale uncertainty in the ratio
$ F_{L}/F_{2} $ for charm and beauty due to the LHeC center-of-mass energy. The left and right panels of Fig. 9 show the ratio$ F_{L}/F_{2} $ for charm and beauty as a function of$ Q^{2} $ for$ x = 0.001 $ respectively. Our NLO results for$ \mu_{c(b)} = 2m_{c(b)} $ and$ \mu_{c(b)} = \sqrt{4m^{2}_{c(b)}+Q^{2}} $ are presented in this figure, where they are compared with the quantities represented in Refs. [36-41] (A. Y. Illarionov, B. A. Kniehl and A. V. Kotikov, Phys. Lett. B 663, 66 (2008)) and [63-71] (N. Ya. Ivanov, and B. A. Kniehl, Eur. Phys. J. C 59, 647(2009)). In both references, the ratios are independent of the choice of the gluon distribution. These approaches based on perturbative QCD and$ k_{T} $ factorization give similar predictions for the ratio of the heavy quark structure functions. One of these studies (N. Ya. Ivanov, and B. A. Kniehl, Eur. Phys. J. C 59, 647(2009)) provides an analytical result for the ratio of structure functions for arbitrary values of the parameter$ \lambda_{g} $ in terms of the Gauss hypergeometric function. They consider compact formulae for the ratio in two particular cases,$ \lambda_{g} = 0 $ and$ \lambda_{g} = 0.5 $ . The simplest case leads to a non-singular behavior at small$ x $ for the structure functions and the other (i.e.,$ \lambda_{g} = 0.5 $ ) originates from the BFKL resummation of the leading powers of$ \ln(1/x) $ . In the other reference, the authors provide compact formulae for the ratio of structure functions with respect to the Mellin transform. In the following, for low and moderate$ Q^{2} $ , one should take quark mass into account. We therefore replace$ x{\rightarrow}\left(1+\dfrac{4m^{2}_{{\cal{Q}}}}{Q^{2}}\right)x $ in the formula for the ratio of heavy quark structure functions. The behavior of the ratios is much less sensitive to the choice of scale$ \mu $ at low and moderate values of$ Q^{2} $ , as seen by comparing the corresponding curves in the two figures. For$ Q^{2}{\gg}4m^{2}_{c(b)} $ , the NLO predictions exhibit an appreciable scale dependence. One can see that all the considered NLO predictions agree with the results in the literature, with a good accuracy.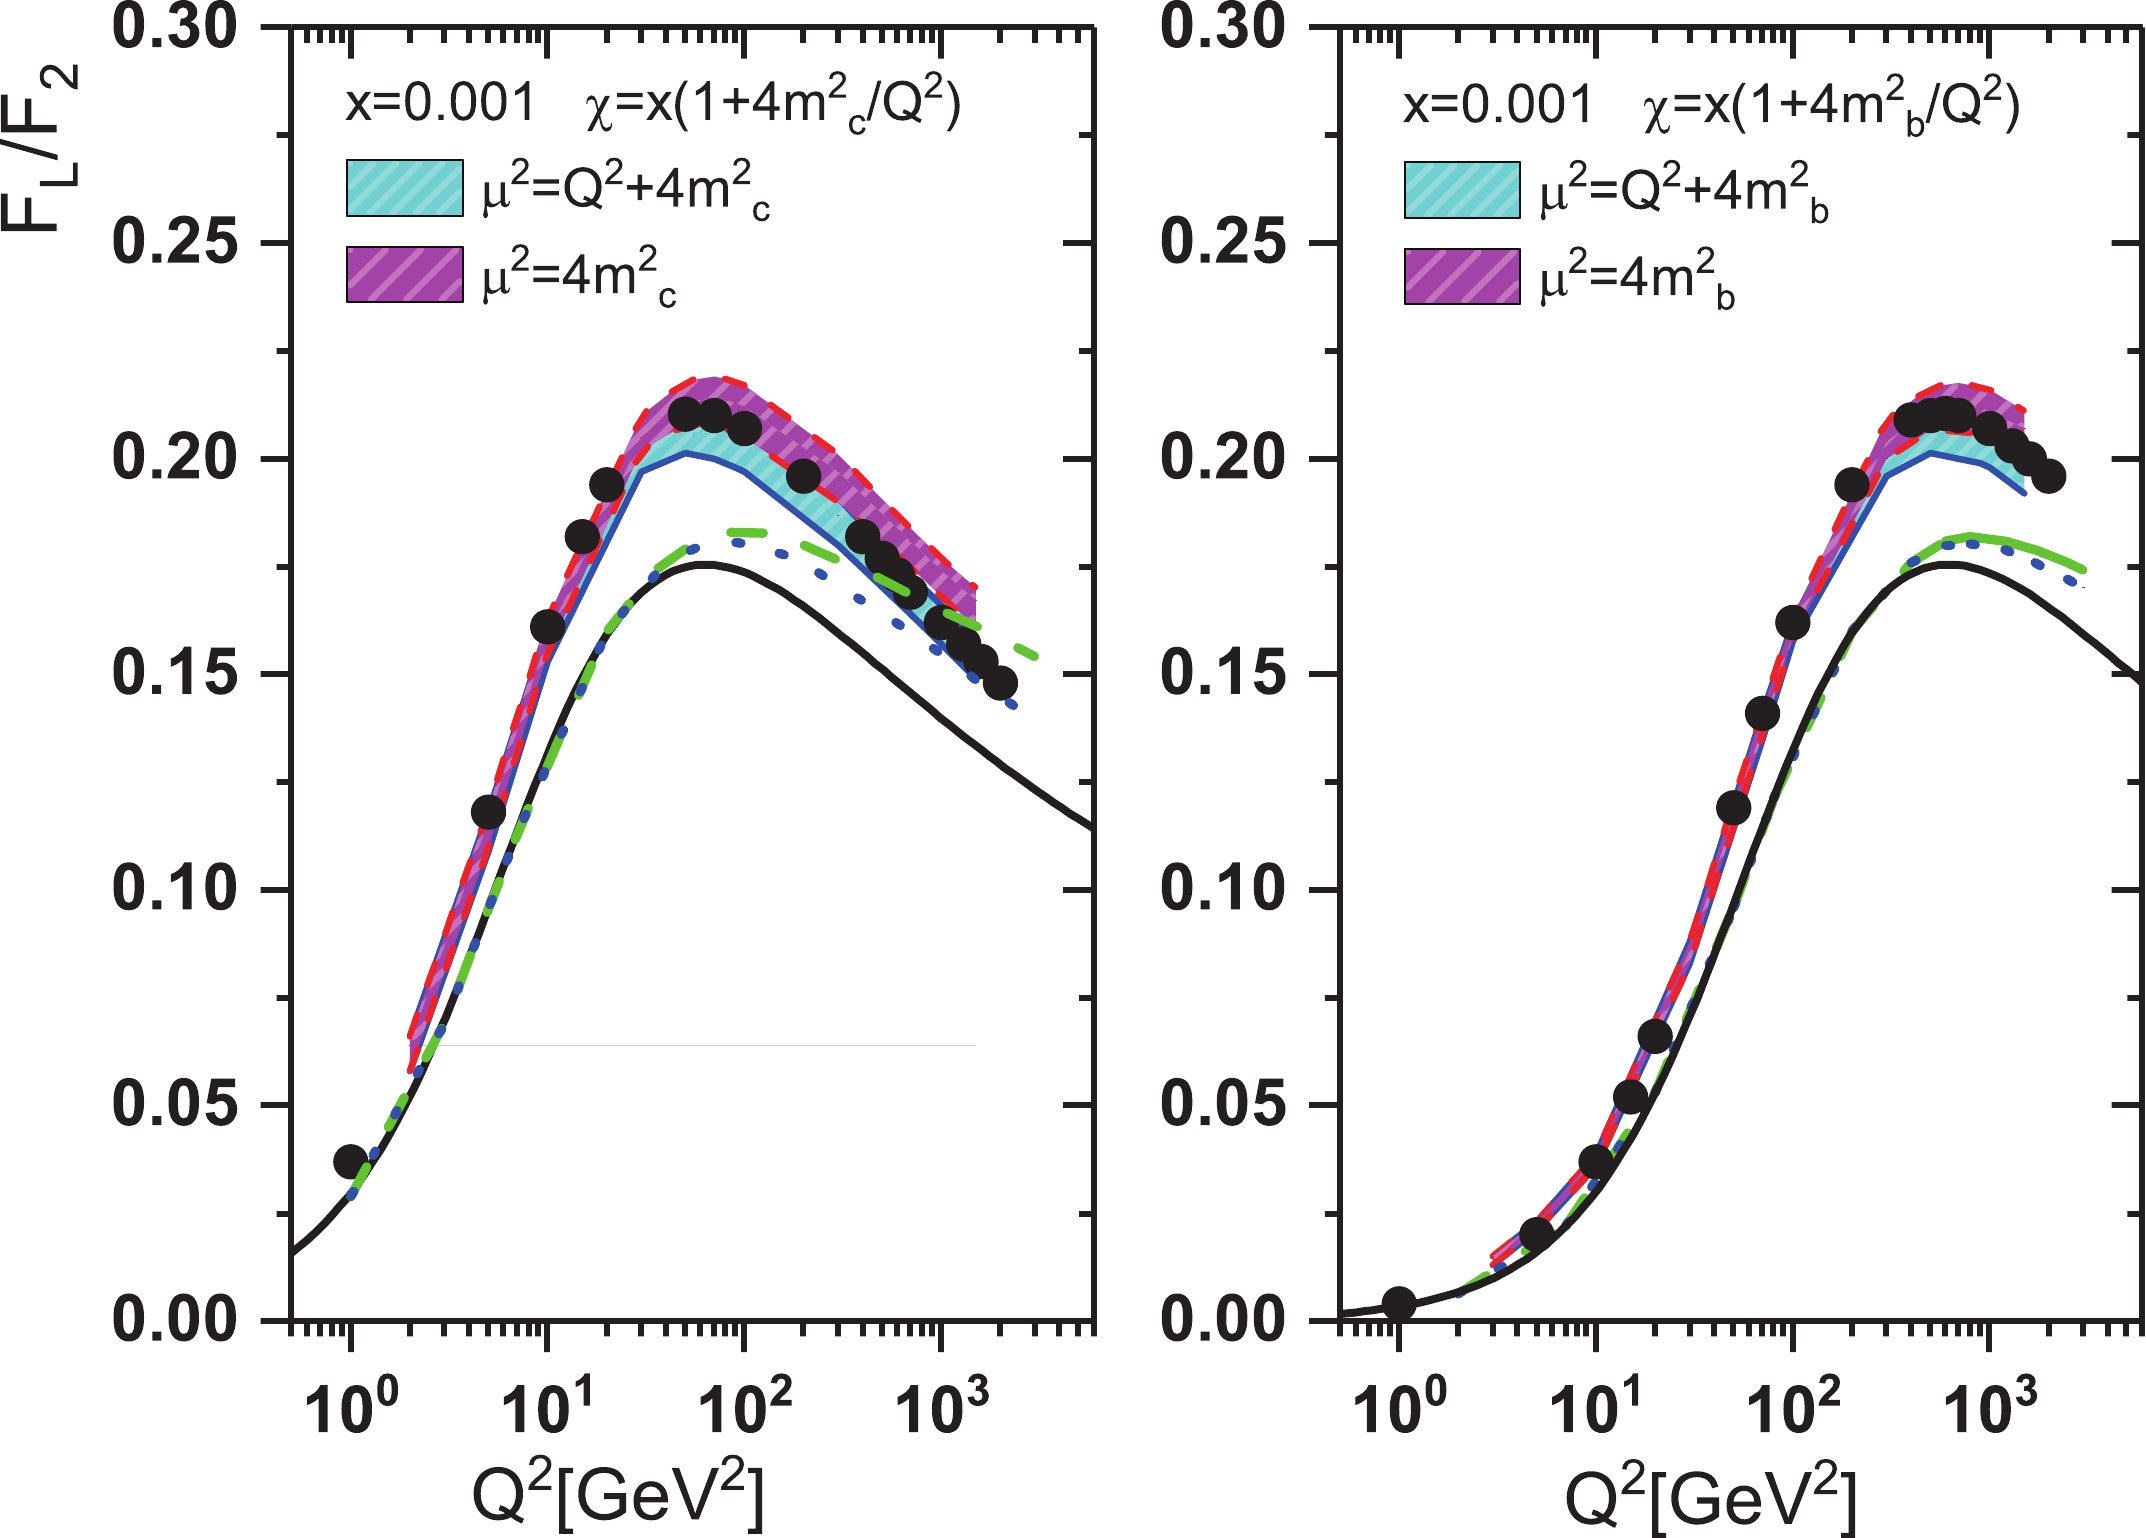
Figure 9. (color online) Comparison of
$ F_{L}/F_{2} $ calculations for (left) charm and (right) beauty vs.$ Q^{2} $ with two different choices of$ \mu $ . These results are compared with LO (solid lines) and NLO (dashed lines for$ \mu = \sqrt{4m^{2}+Q^{2}} $ and dotted lines for$ \mu = 2m $ ) quantities from Refs. [36-41] (A. Y. Illarionov, B. A. Kniehl, and A. V. Kotikov, Phys. Lett. B$ {\bf 663}, \;66 \;(2008) $ ) and also with results Refs. [63-71] (N. Ya. Ivanov and B. A. Kniehl, Eur. Phys. J. C$ {59},\; 647\;(2009) $ ) (black points) at x = 0.001. -
We have presented the ratio
$ F_{L}^{{\cal{Q}}\overline{{\cal{Q}}}}/F_{2}^{{\cal{Q}}\overline{{\cal{Q}}}} $ for charm and beauty pair production with respect to HERA data. The behavior of these ratios are in good agreement with experimental data over a wide range of$ W^{2} $ values. A power-law behavior for the ratio of structure functions for heavy quark pair production is predicted. Results as a function of$ Q^{2} $ for an invariant constant value are in agreement with those found in the literature in the framework of perturbative QCD. We have also studied the production of heavy quark pairs in future electron-proton colliders (LHeC and FCC-eh). The ratio of charm and beauty structure functions were studied at the center-of-mass energy$ \sqrt{s} = 1.3\; \mathrm{TeV} $ , which is proposed for the LHeC. For top quark pair production, which will be an important production channel at both LHeC and FCC-eh, the ratio of structure functions was determined and compared with respect to the center-of-mass energies in the future colliders. The results of numerical calculations for heavy quarks in the LHeC and FCC-eh are available with respect to the inelasticity, defined in accordance with the center-of-mass energies. These results highlight the importance of measuring the longitudinal structure function in the production of heavy quarks in the future, with respect to the energies available in the new accelerators. -
The author is thankful to Razi University for financial support of this project. The author is also especially grateful to Max Klein for carefully reading the manuscript and for fruitful discussions. Thanks also go to H. Khanpour for interesting and useful discussions.
Importance of heavy quark longitudinal structure function measurements at future circular collider energies
- Received Date: 2020-11-25
- Available Online: 2021-06-15
Abstract: In this article, we consider the ratio of structure functions for heavy quark pair production at low values of


 Abstract
 HTML
HTML Reference
 Related
 PDF
PDF






 DownLoad: