


 Abstract
 HTML
HTML Reference
 Related
 PDF
PDF


-
Weak vector boson (
$ W $ and$ Z $ boson) production plays a crucial role in hadron colliders including the present proton-proton ($ pp $ ) collider at CERN, the Large Hadron Collider (LHC). The production of$ W $ and$ Z $ bosons in$ pp $ collisions at the LHC enables several precision tests of the quantum chromodynamic (QCD) and electroweak (EW) sectors of the Standard Model (SM). Their precise measurements provide substantial inputs for constraining parton distribution functions (PDFs) in the proton and improved background modeling for several rarer SM processes such as top quark and Higgs boson productions and beyond the SM searches such as those for supersymmetry and dark matter. Their measurements in leptonic decay modes are very advantageous as they are produced in abundance with clean experimental signatures and constitute a major experimental benchmark to calibrate the detector response for lepton, jet, and missing transverse energy reconstructions. Their productions through leptonic decays are not only important for experimental aspects but also essential to test Monte Carlo based event generators and fixed-order calculations for the advancement of the field of theoretical predictions.In particular,
$ W $ boson production is experimentally characterized by one isolated lepton with high transverse momentum$ p_{T} $ and large missing transverse energy owing to neutrino in its leptonic decay mode$ pp \rightarrow W^{\pm} \rightarrow l^{\pm}\nu $ , where$ l $ is either a muon$ \mu $ or an electron$ e $ . The dominant mechanism for$ W $ boson production at the LHC proceeds via annihilation of a valence quark from one of colliding protons with a sea antiquark from other protons as$ u\bar{d}\rightarrow W^{+} $ and$ d\bar{u}\rightarrow W^{-} $ . The excess of the two valence$ u $ quarks over one valence$ d $ quark in the proton requires$ W^{+} $ bosons to be produced more often than$ W^{-} $ bosons. This production asymmetry between the$ W^{+} $ and$ W^{-} $ bosons is referred to as the$ W $ boson charge asymmetry and is usually defined with the differential of cross sections$ \sigma(W^{+}) $ and$ \sigma(W^{-}) $ in$ W $ boson rapidity$ y_{W} $ as$ A_{y_{W}} = \frac{{\rm d}\sigma(W^+\rightarrow l^+\nu)/{\rm d}y_{W}-{\rm d}\sigma(W^-\rightarrow l^-\bar{\nu})/{\rm d}y_{W}}{{\rm d}\sigma(W^+\rightarrow l^+\nu)/{\rm d}y_{W}+{\rm d}\sigma(W^-\rightarrow l^-\bar{\nu})/{\rm d}y_{W}}. $

(1) The
$ W $ boson charge asymmetry$ A_{y_{W}} $ provides a direct probe of the relative$ u $ and$ d $ quark distributions as functions of the initial-state parton momentum fractions ($ x $ values) because$ y_{W} $ is strongly correlated with the$ x $ values, which can generally be expressed as$ x_{1, 2} = $ $ (M_{W}/\sqrt{s})e^{\pm y} $ with$ M_{W} $ as the$ W $ boson mass and$ \sqrt{s} $ as the center-of-mass energy. However, there is an experimental limitation regarding the$ A_{y_{W}} $ because the$ p_{T} $ and$ y_{W} $ of the$ W $ boson cannot be directly reconstructed owing to the unknown longitudinal momentum of the decay neutrino. Despite this limitation, the same information can still be accessed by measuring the charge asymmetry from the decay lepton. The charge asymmetry can readily be measured as a function of the decay lepton pseudorapidity$ \eta_{l} $ , which is indeed correlated with the$ y_{W} $ , in the analogous form of$ A_{\eta_{l}} = \frac{{\rm d}\sigma(W^+\rightarrow l^+\nu)/{\rm d}\eta_{l}-{\rm d}\sigma(W^-\rightarrow l^-\bar{\nu})/{\rm d}\eta_{l}}{{\rm d}\sigma(W^+\rightarrow l^+\nu)/{\rm d}\eta_{l}+{\rm d}\sigma(W^-\rightarrow l^-\bar{\nu})/{\rm d}\eta_{l}}. $

(2) The lepton charge asymmetry
$ A_{\eta_{l}} $ corresponds to the convolution of the original$ A_{y_{W}} $ variable and the$ V-A $ (vector-axial vector) asymmetry of the$ W $ boson, which implies its anisotropic decay into the lepton and neutrino. In a similar way, the$ A_{\eta_{l}} $ variable provides substantial constraints on the ratio of$ u $ and$ d $ quark distribution functions in the proton as a function of the$ x $ values of the partons. This variable can also be beneficial for discriminating among various PDF models that predict different shapes of valence and sea quark distributions.The
$ W $ boson production asymmetries were measured before mostly in terms of the$ A_{\eta_{l}} $ variable in the$ {\rm{p\bar{p}}} $ collisions by the CDF and D0 Collaborations at the Tevatron [1-7]. The asymmetries were measured at the LHC using the$ A_{\eta_{l}} $ variable in the central lepton pseudorapidity region$ |\eta_{l}|\leqslant 2.5$ by the ATLAS and CMS collaborations at different center-of-mass energies up to 8 TeV [8-15]. The$ A_{\eta_{l}} $ variable was also measured by the LHCb collaboration at the LHC up to 8 TeV [16-19] in the forward region$ 2.0 \leqslant \eta_{l} \leqslant 4.5$ extending beyond the ATLAS and CMS detector coverage. The entire LHC measurements have probed the inclusive$ W $ boson cross sections along with the$ A_{\eta_{l}} $ variable in the range$ 10^{-4} < x < 1 $ , which are clearly important to provide valuable inputs on determining accurate PDFs at very small and large$ x $ values. In all these measurements complementing in the$ \mu $ and$ e $ decay channels in terms of the wide$ \eta_{l} $ region probed, the data were compared with various theoretical predictions including fixed-order perturbative QCD calculations at next-to-leading order (NLO) and next-to-NLO (NNLO) accuracies, convolved with different PDF models.The
$ W $ boson charge asymmetries are determined for kinematic phase spaces specified by the decay lepton transverse momentum$ p^{l}_{T} $ threshold. The$ p^{l}_{T} $ is correlated with the$ W $ boson transverse momentum$ p^{W}_{T} $ , and hence, impacts both the measurements and predictions of the charge asymmetry. In the measurements, the$ p^{l}_{T} $ threshold value is chosen to match with the available detector triggering conditions and to have an efficient event reconstruction for pure signal data sample with sufficiently high statistics. Thereby, the measurements are subject to using the$ p^{l}_{T} $ threshold value, which depends on event triggering and reconstruction requirements. Nevertheless, in the theoretical calculations, various$ p^{l}_{T} $ thresholds (including the ones used in the measurements) can be used alternatively to test the impact on the charge asymmetry. Furthermore, theoretical predictions can be repeated with increasing thresholds in the low-$ p^{l}_{T} $ region to select only a subset of phase space where the$ \eta_{l} $ gets closer to the$ y_{W} $ . This also facilitates the testing of the charge asymmetry predictions in a more constrained phase space in different ranges of$ \eta_{l} $ and$ y_{W} $ , allowing a finer probe of the dependence on the$ x $ values.In this work, we present the predicted charge asymmetries corresponding to the
$ W^{\pm} $ boson production processes$ pp \rightarrow W^{+}+X \rightarrow l^{+}\nu+X $ and$ pp \rightarrow W^{-}+X \rightarrow $ $ l^{-}\bar{\nu}+X $ . The predictions are obtained in the fiducial phase space encompassing both the central and forward regions$ 0 \leqslant \eta_{l} \leqslant 4.5$ at both 8 and 13 TeV. The predictions at the NNLO accuracy as a function of the$ \eta_{l} $ from various PDF models are compared with the CMS and LHCb$ pp $ collision data at 8 TeV. The predictions are further obtained as functions of the$ \eta_{l} $ and$ y_{W} $ at the NNLO accuracy as well as in the bins of the$ p^{W}_{T} $ through resummation at the next-to-next-to-next-to-leading logarithm (N3LL), which is matched to NNLO, i.e., NNLO+N3LL accuracy at 13 TeV. Various thresholds in the low-$ p^{l}_{T} $ region,$ p^{l}_{T} > $ 20, 25, 30, and 40 GeV, are used to enable testing the potential impact on the charge asymmetry. Specifically, the 13 TeV predictions are reported by aiming to assess the correlations among the increasing low-$ p^{l}_{T} $ thresholds and the charge asymmetry distributions for$ A_{\eta_{l}} $ and$ A_{y_{W}} $ as well as those in bins of$ p^{W}_{T} $ . -
The charge asymmetry calculations that are based on the differential cross sections are performed using the MATRIX framework [20, 21], which is interfaced with the RadISH program [22, 23], together with the computational framework MATRIX+RadISH (v1.0.1) [24]. The fixed-order calculations of the differential cross sections at the NNLO in the QCD perturbation theory are achieved using the MATRIX framework, which implements the transverse momentum
$ q_{T} $ -subtraction method [25, 26]. In the$ q_{T} $ -subtraction approach, the infrared divergences of the real radiation contributions are extracted using the infrared subtraction terms in the perturbative expansion. These divergences are regulated by employing a fixed cut-off value$ r_{\rm cut} = $ 0.0015 (0.15%) for the slicing parameter$ r $ , where it is defined as$ r = p_{T}/m $ in terms of the$ p_{T} $ distribution and invariant mass$ m $ for a system of colorless particles. The resummation of the large logarithmic contributions, which is needed for the accurate prediction of the differential cross sections as a function of the$ p^{W}_{T} $ , is achieved with the formalism of the RadISH program. The RadISH code enables high-accuracy resummation for the$ p^{W}_{T} $ distribution through N3LL which is matched to the NNLO QCD calculations by the MATRIX. Additionally, the OpenLoops tool [27, 28] is utilized through an automated interface to acquire all the spin- and color-correlated tree-level and one-loop scattering amplitudes in the computations. In the setup, the Fermi constant$ G_{\rm F} $ input scheme is used where the leptons (both$ \mu $ and$ e $ ) and light quarks are treated as massless. The default MATRIX setup is used for the SM input parameters relevant to the inclusive$ W $ boson process that are all based on the following$ W $ boson mass and$ G_{\rm F} $ values of$ M_{W} = 80.385 \;{\rm{GeV}},\;\;\; G_{\rm F} = 1.16639 \times 10^{-5}\; {\rm{GeV}}^{-2}. $

(3) To this end, the QCD calculations of the differential cross sections for the charge asymmetry predictions require the inclusion of knowledge of PDFs. The evaluation of PDFs from the data files is carried out by exploiting the LHAPDF (v6.2.0) framework [29] in the computations. Various PDF sets are used in the calculations, where all are based on a constant strong coupling
$ \alpha_{s} = $ 0.118. Particularly, the NNLO PDF sets MMHT2014 [30], CT14 [31], NNPDF3.1 [32], and PDF4LHC15 [33] are used in the calculations. -
The calculations for both the differential cross section and charge asymmetry predictions are performed in a realistic fiducial phase space of the
$ W $ boson and its decay lepton. The fiducial phase space is defined to be in line with the reference CMS [10] and LHCb [17] 8 TeV measurements. The leptons (either$ \mu $ or$ e $ ) are required to have transverse momentum$ p^{l}_{T} $ > 25 GeV ($ p^{l}_{T} $ > 20 GeV) and to lie in the$ \eta_{l} $ region$ 0 \leqslant \eta_{l} \leqslant 2.4 $ ($ 2.0 \leqslant \eta_{l} \leqslant 4.5 $ ) for the validation of the predictions with the reference CMS (LHCb) results at 8 TeV. The leptons are required to have transverse momentum$ p^{l}_{T} $ > 20 GeV and to lie in the$ \eta_{l} $ region encompassing both the central and forward acceptances$ 0 \leqslant \eta_{l} \leqslant 4.5 $ at 13 TeV. In addition, the requirements$ p^{l}_{T} $ > 25, 30, and 40 GeV are all used to assess the correlations of these increasing thresholds with the predicted charge asymmetries in the entire acceptance region$ 0 \leqslant \eta_{l} \leqslant 4.5 $ concerning the 13 TeV predictions. Leptons are treated as massless in the computational setup; thus, the predictions of the differential cross sections in the$ \mu $ channel are the same as those in the$ e $ channel. No requirements are strictly imposed for the$ W $ boson transverse mass and the missing transverse energy owing to the neutrino; however, these requirements can make more sense depending on experimental measurements. Moreover, no explicit requirement is applied for the final-state hadronic jet (s) in terms of the jet definition criteria and selection cuts. -
Theoretical calculations of the cross sections in the perturbative QCD expansions in the
$ \alpha_{s} $ depend on the choices for the renormalization$ \mu_{\rm R} $ and factorization$ \mu_{\rm F} $ scales. In this paper, the central values for the$ \mu_{\rm R} $ and$ \mu_{\rm F} $ scales are fixed to the$ W $ boson mass$ \mu_{\rm R} $ =$ \mu_{\rm F} $ =$ M_{W} $ = 80.385 GeV. Similarly, the central value for the resummation scale$ x_{Q} $ is set to the$ W $ boson mass$ x_{Q} $ =$ M_{W} $ = 80.385 GeV when the resummation of the large logarithmic corrections is also considered in the calculations. Theoretical uncertainties due to the choices of the central scale values or shortly scale uncertainties correspond to the missing higher-order corrections in the perturbative (and resummed) calculations. Scale uncertainties are estimated by independently varying the$ \mu_{\rm R} $ and$ \mu_{\rm F} $ by a factor of 2 up and down around their central values. The seven-point variation method is employed, that is, all possible combinations in the variations are considered while imposing the constraint$ 0.5 \leqslant \mu_{\rm R}/ \mu_{\rm F} \leqslant 2.0 $ . However, the nine-point variation method is used when the perturbative calculations include matching to resummation, that is the envelope of the seven-point variation, while keeping$ x_{Q} $ at its central value and the two-point variation of$ x_{Q} $ around its central value by a factor of 2 in either direction for the central values of the$ \mu_{\rm R} $ and$ \mu_{\rm F} $ scales. The PDF uncertainties caused by the different parametrizations of the PDF models are estimated by following the prescription of the PDF4LHC working group [29, 33]. The$ \alpha_{s} $ uncertainty is also estimated by varying the$ \alpha_{s} $ value by$ \pm0.001 $ at approximately 0.118. Thereafter, the total theoretical uncertainties of the predictions are obtained by quadratically summing the scale, PDF, and$ \alpha_{s} $ uncertainties. The total theoretical uncertainties in the predicted distributions are presented symmetrically using the larger values from the estimated up and down uncertainties in a conservative consideration. -
The predictions are compared with the 8 TeV data from the reference CMS measurement [10] for the differential cross section and
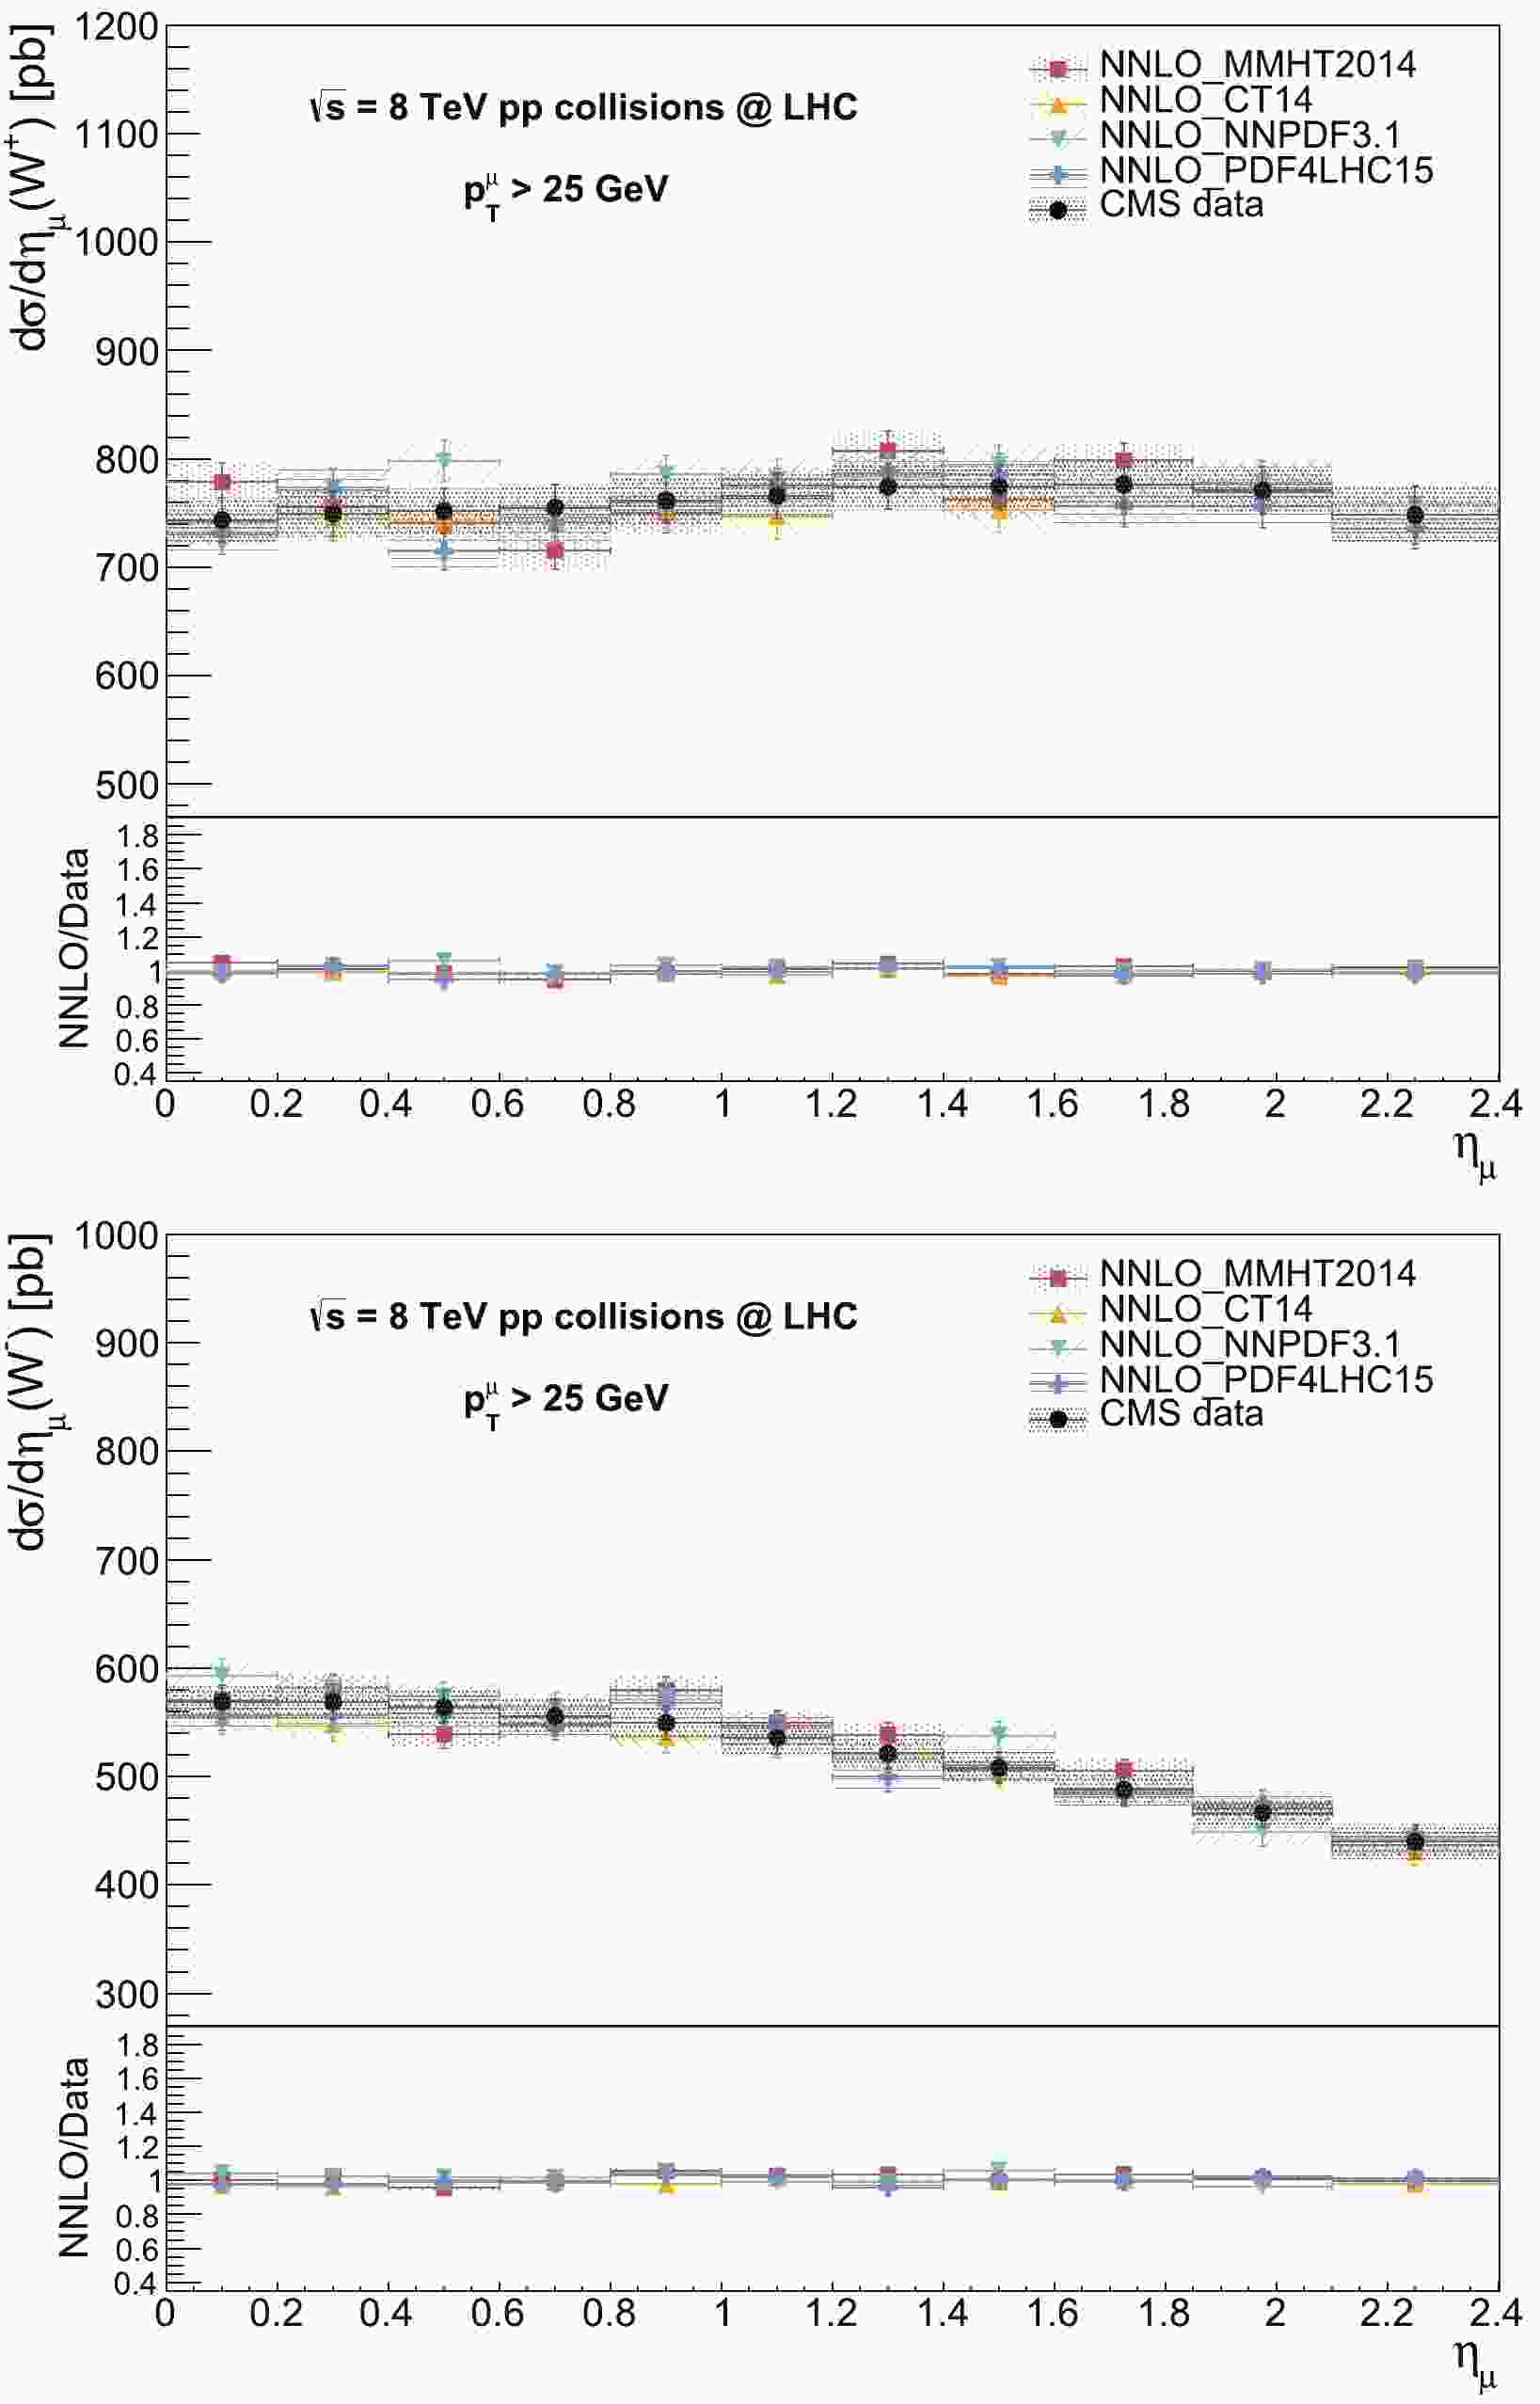
$ A_{\eta_{l}} $ distributions. The NNLO predictions are obtained in the$ \mu $ decay mode with the fiducial requirement$ p^{\mu}_{T}> $ 25 GeV in the central region$ 0 \leqslant \eta_{\mu} \leqslant 2.4 $ . The$ \eta_{\mu} $ bin ranges are used from the CMS measurement as (0.00, 0.20), (0.20, 0.40), (0.40, 0.60), (0.60, 0.80), (0.80, 1.00), (1.00, 1.20), (1.20, 1.40), (1.40, 1.60), (1.60, 1.85), (1.85, 2.10), and (2.10, 2.40) to enable direct comparisons. The total theoretical uncertainties are included from the quadratic sum of the scale, PDF, and$ \alpha_{s} $ uncertainties for the predicted distributions. The total experimental uncertainties are included by summing the statistical, systematic, and luminosity uncertainties in the quadrature of the measured differential cross sections, while summing the statistical and systematic uncertainties in the quadrature of the measured asymmetry. The NNLO predictions from the PDF sets MMHT2014, CT14, NNPDF3.1, and PDF4LHC15 are compared with the CMS data distributions. The predicted differential cross section distributions for the$ W^{+} $ and$ W^{-} $ processes are compared with the data in Fig. 1. The predictions using different PDF sets are observed to be in good agreement with each other and the data within the uncertainties. The prediction using CT14 shows better agreement with the data, where the predictions using PDF sets other than CT14 slightly deviate from the data in only a small number of bins up to a few percent. The predicted$ A_{\eta_{\mu}} $ distributions are compared with the data as shown in Fig. 2. Apart from a few exceptions, the predictions describe the CMS data consistently within the uncertainties throughout the$ \eta_{\mu} $ ranges. The predicted$ A_{\eta_{\mu}} $ distribution from CT14 describes the data slightly better over the predictions using the other PDF sets. It can also be observed that the sensitivity to discriminate among various PDF sets is enhanced in the$ A_{\eta_{\mu}} $ variable in comparison to the differential cross sections. Moreover, the predicted results from various PDF sets for both the differential cross section and$ A_{\eta_{\mu}} $ distributions are observed to be in agreement with the corresponding NNLO predictions by the FEWZ program [34] in the CMS paper. The differences between the MATRIX predictions and FEWZ ones are generally up to ~1%-2% within the quoted theoretical uncertainties.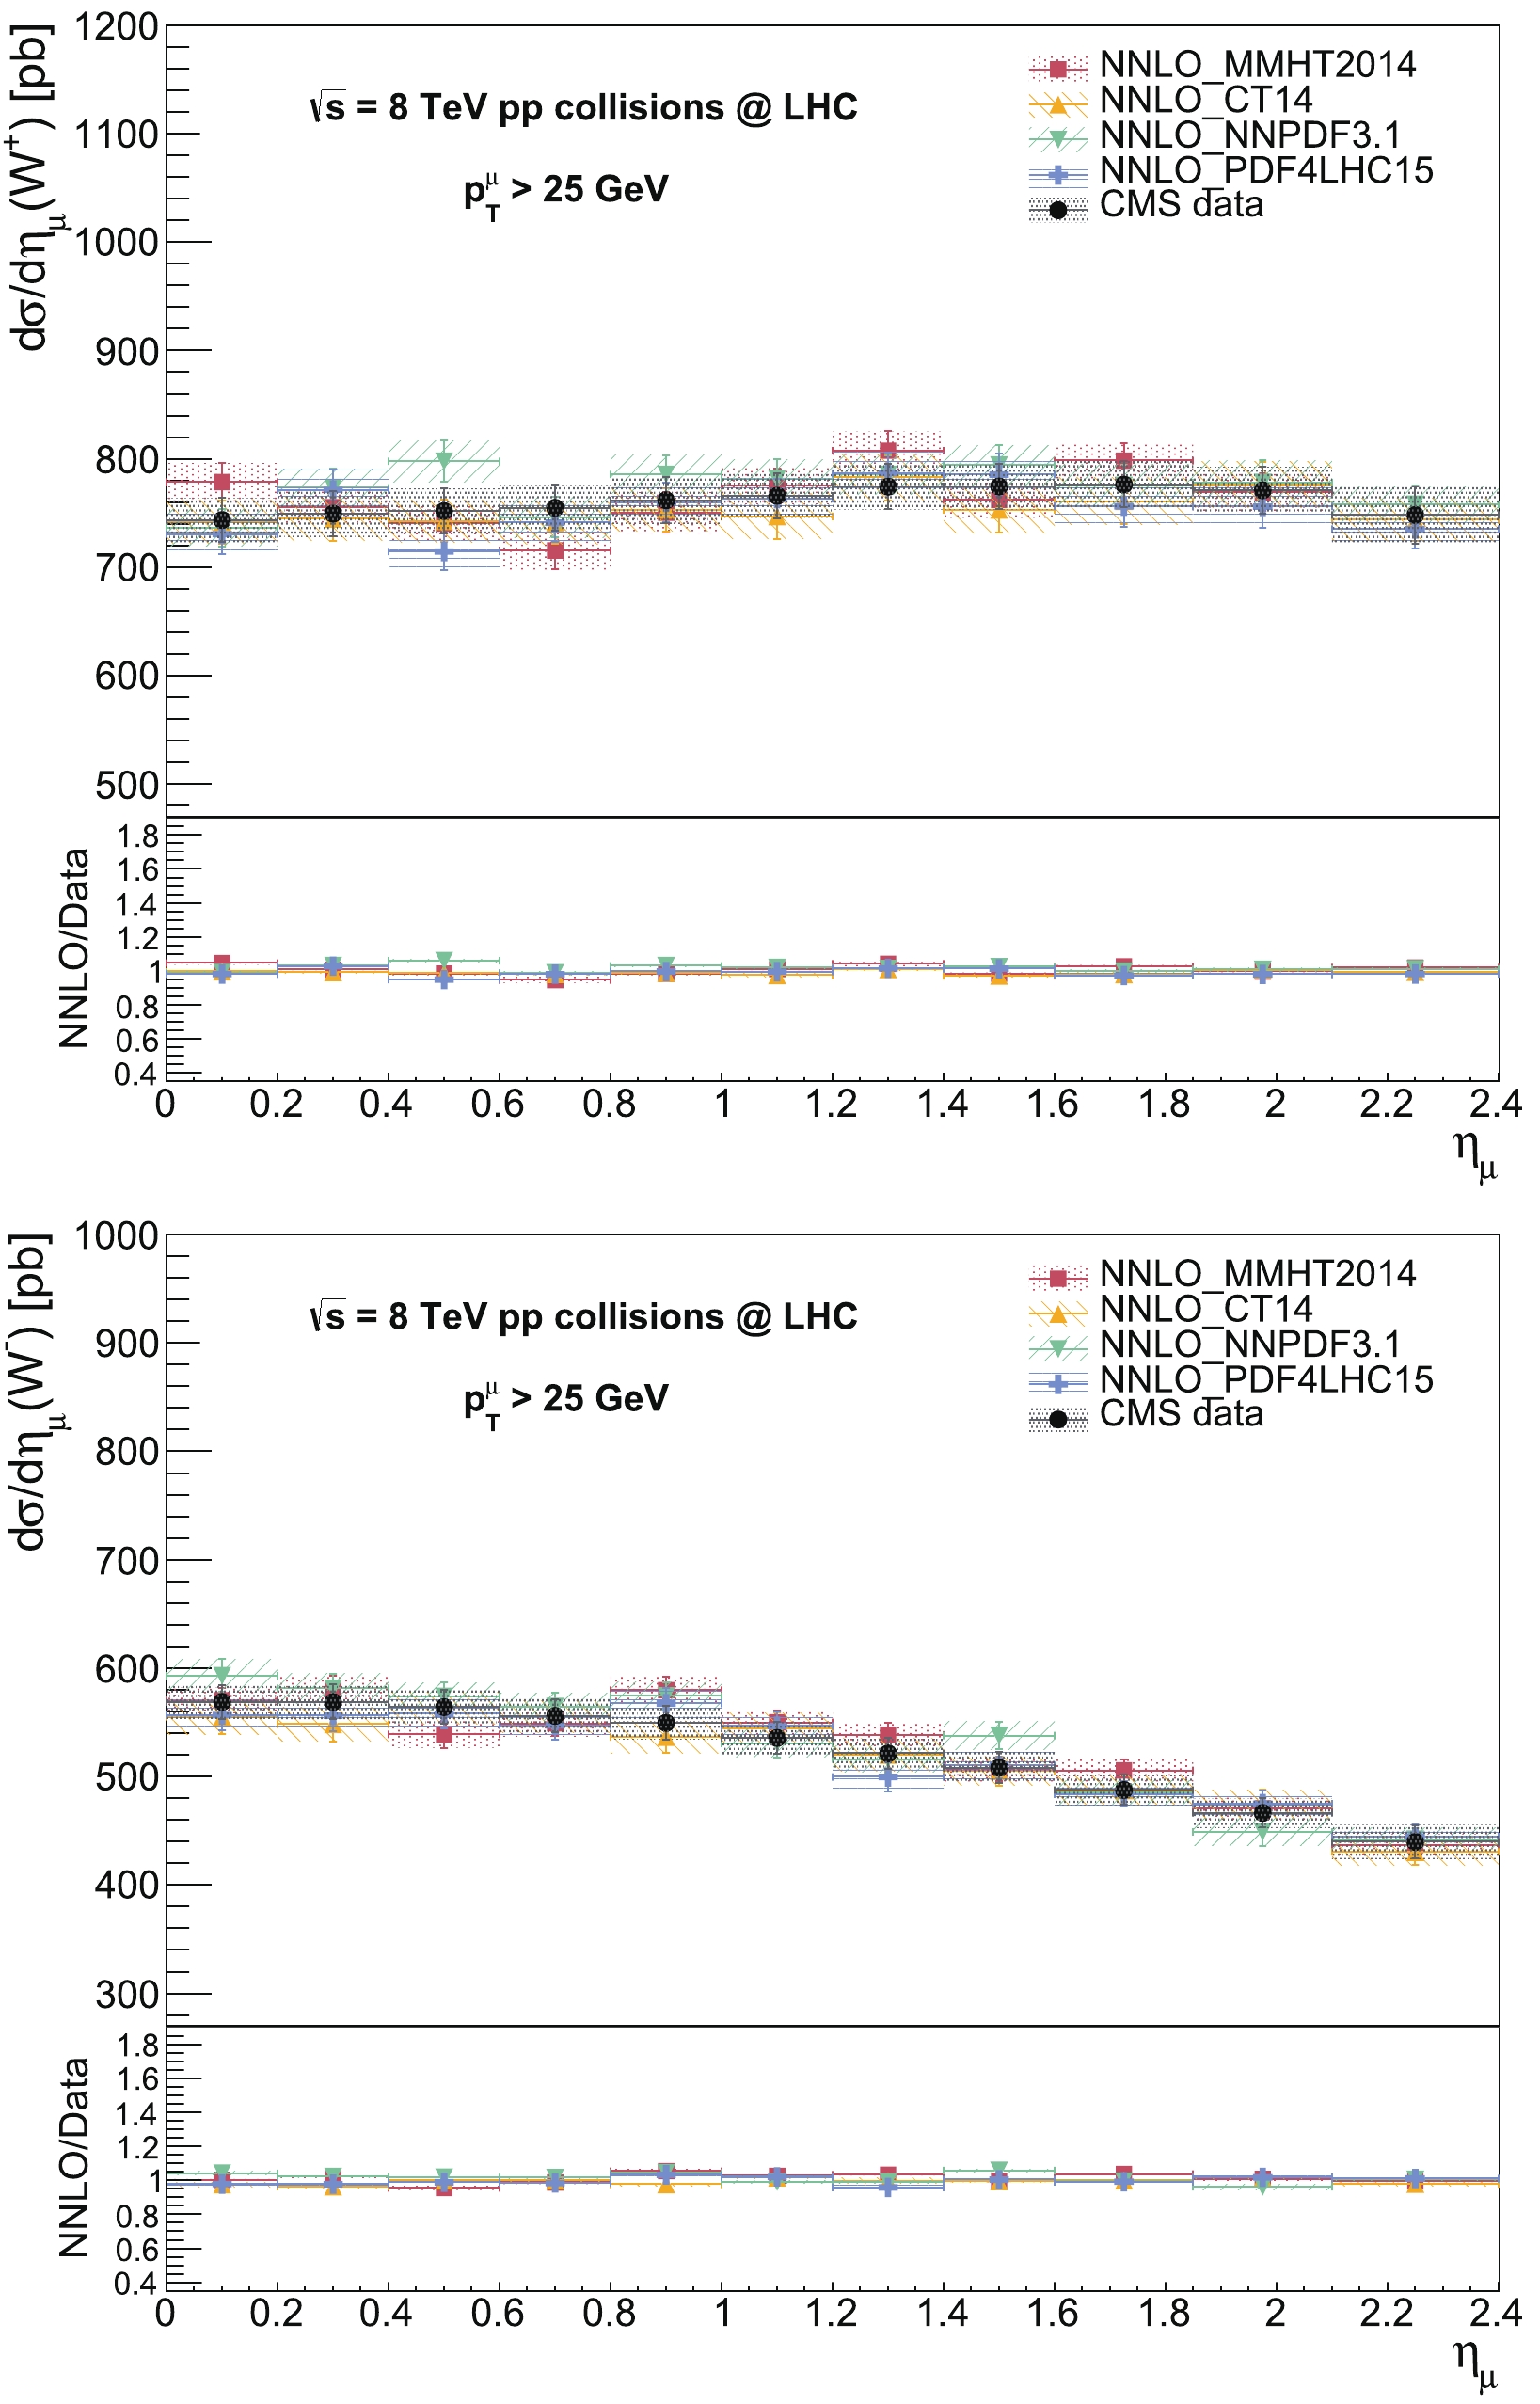
Figure 1. (color online) Predicted differential cross section distributions for the
$ W^{+} $ (top) and$ W^{-} $ (bottom) processes as a function of the$ \eta_{\mu} $ and their comparisons with the CMS data at 8 TeV. The predictions are obtained at the NNLO accuracy using MMHT2014, CT14, NNPDF3.1, and PDF4LHC15 PDF sets. The predictions include total theoretical uncertainties from the quadratic sum of scale, PDF, and$ \alpha_s $ uncertainties, whereas the data include the total experimental uncertainty. In the lower panels, the ratios of the predictions to the data for the differential cross section distributions are also displayed.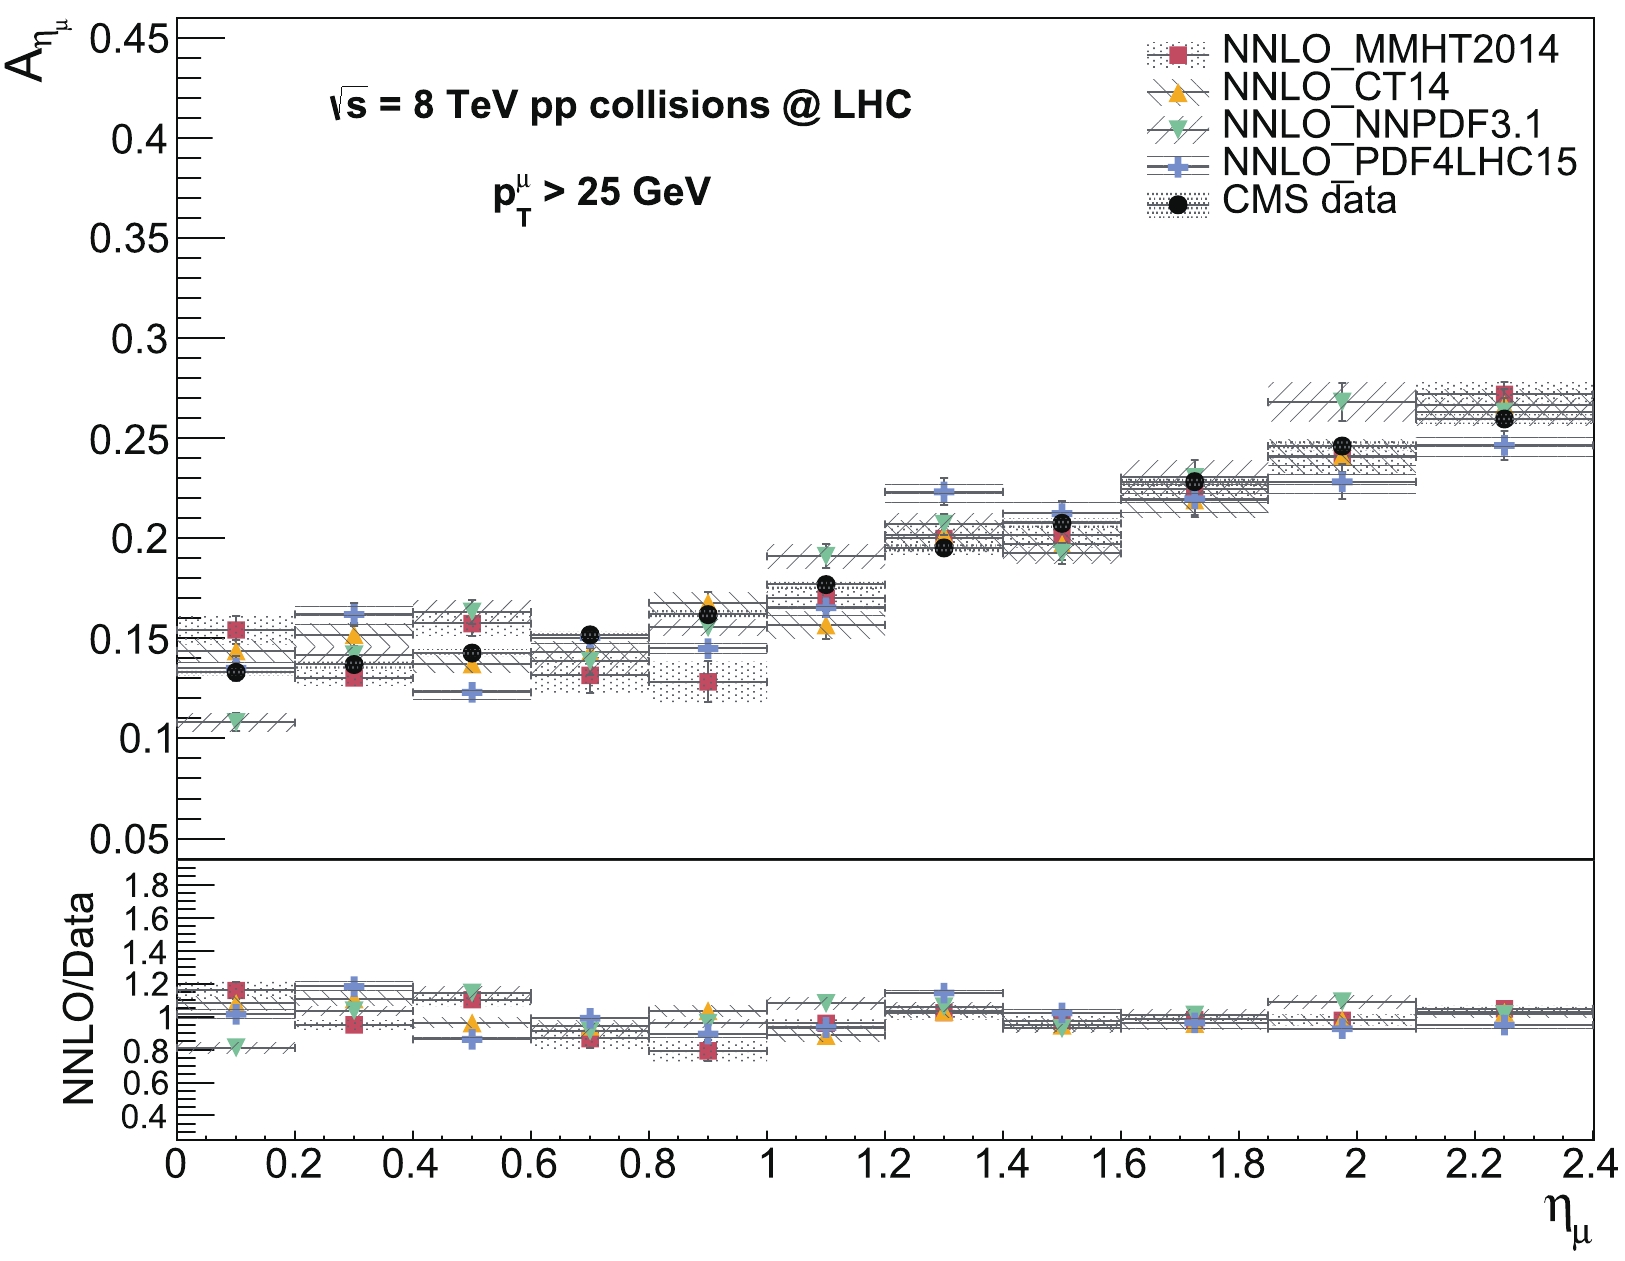
Figure 2. (color online) NNLO predictions for the muon charge asymmetry
$ A_{\eta_{\mu}} $ variable from the MMHT2014, CT14, NNPDF3.1, and PDF4LHC15 PDF sets as a function of the$ \eta_{\mu} $ . The predictions are compared with the CMS data in the central region$ 0 \leqslant \eta_{\mu} \leqslant 2.4 $ at 8 TeV. The predictions include the total theoretical uncertainties from the quadratic sum of scale, PDF, and$ \alpha_s $ uncertainties, whereas the data include the total experimental uncertainty. In the lower panel, the ratios of the predictions to the data for the$ A_{\eta_{\mu}} $ are also displayed.The NNLO predictions are also compared with the 8 TeV data from the reference LHCb measurement [17] which was performed in the
$ \mu $ decay mode in the forward acceptance region. The fiducial phase space requirement of$ p^{\mu}_{T}> $ 20 GeV in the forward region$ 2.0 \leqslant \eta_{\mu} \leqslant 4.5 $ is imposed to compare with the LHCb data for the$ A_{\eta_{\mu}} $ variable. The bin edges of$ \eta_{\mu} $ are used identically from the LCHb measurement as (2.00, 2.25), (2.25, 2.50), (2.50, 2.75), (2.75, 3.00), (3.00, 3.25), (3.25, 3.50), (3.50, 4.00), and (4.00, 4.50). The total theoretical and experimental uncertainties are included to the central results for the predictions and data, respectively. Comparisons of the predicted$ A_{\eta_{\mu}} $ distributions from various PDF sets with the data are shown in Fig. 3. The predictions are generally in good agreement with the data within uncertainties throughout the$ \eta_{\mu} $ ranges. The prediction using CT14 tends to be slightly more consistent with the data over the results obtained using other PDF sets. The predicted results from all the PDF sets show no significant deviation from the FEWZ NNLO predictions that are presented in the LHCb measurement.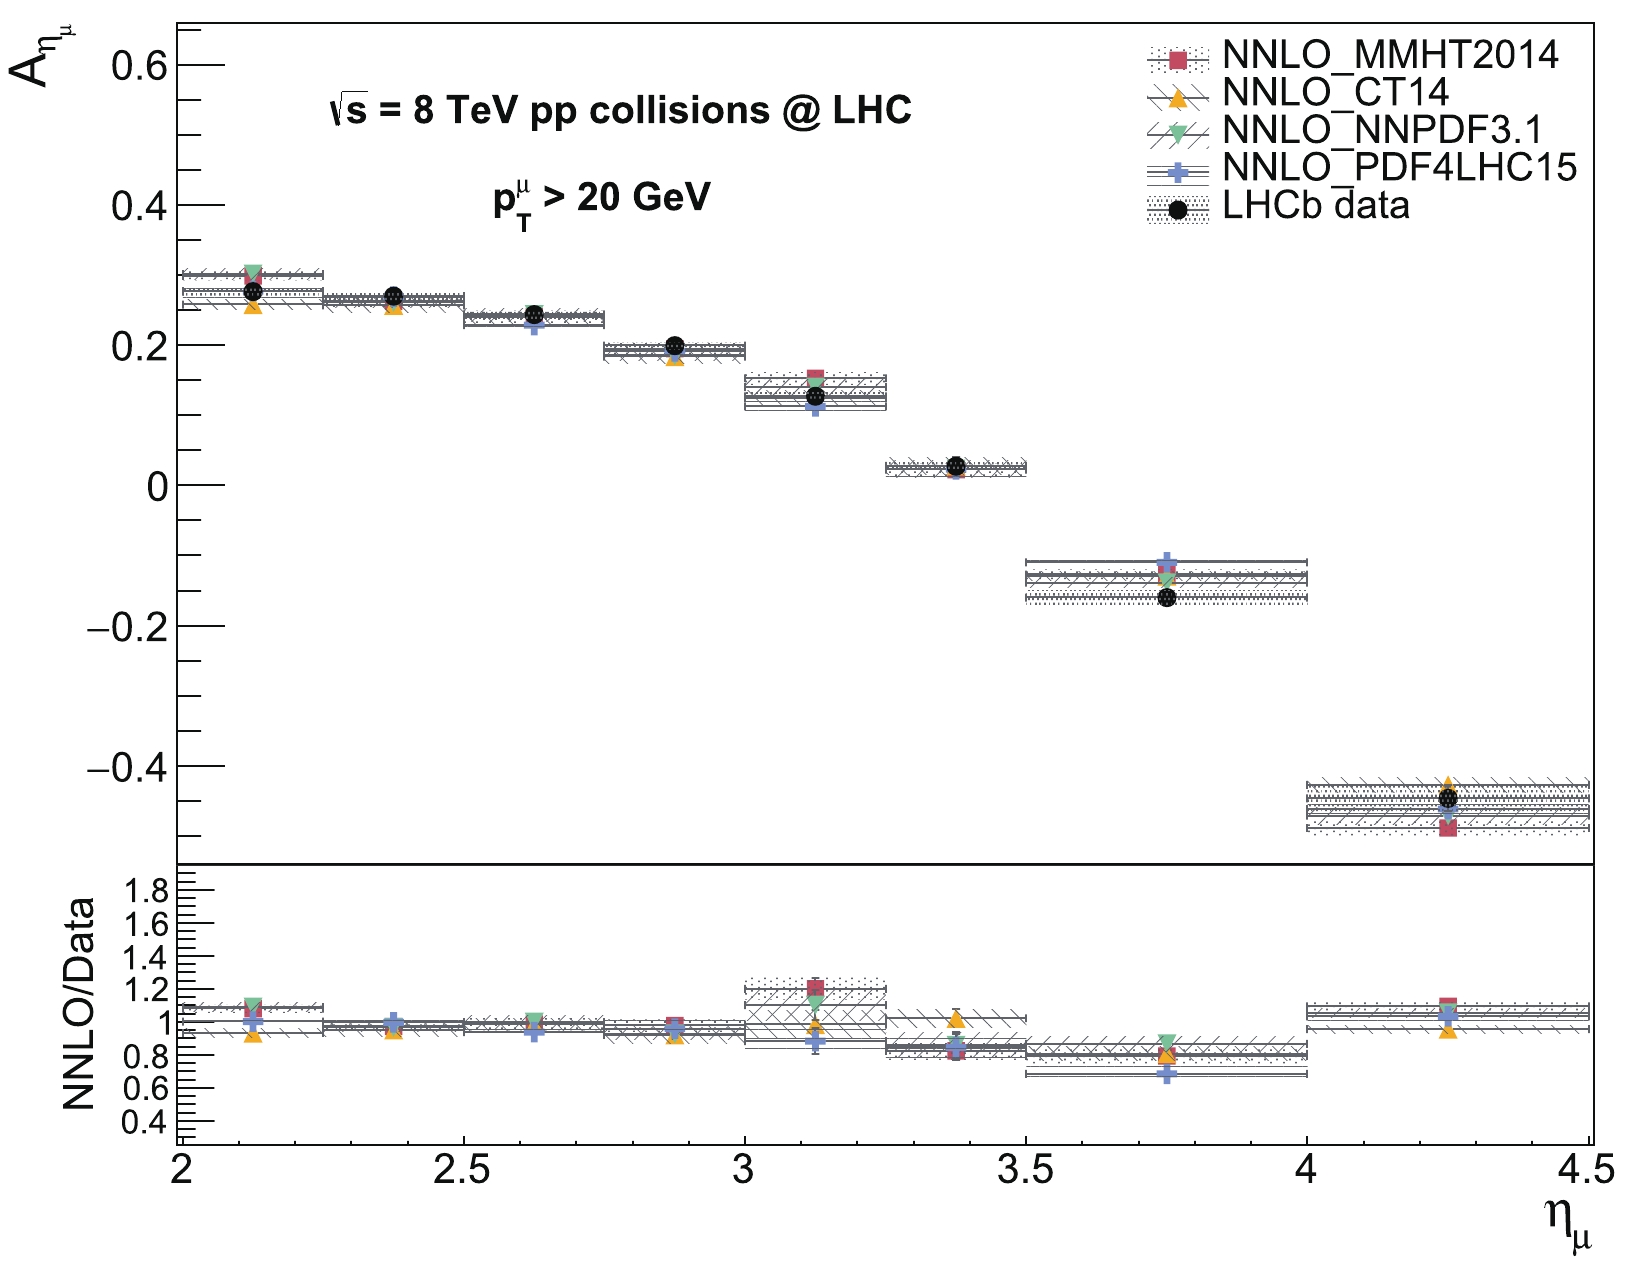
Figure 3. (color online) NNLO predictions for the
$ A_{\eta_{\mu}} $ variable from the MMHT2014, CT14, NNPDF3.1, and PDF4LHC15 PDF sets as a function of the$ \eta_{\mu} $ . The predictions are compared with the LHCb data in the forward region$ 2.0 \leqslant \eta_{\mu} \leqslant 4.5 $ at 8 TeV. The predictions include the total theoretical uncertainties, whereas the data include the total experimental uncertainty. In the lower panel, the ratios of the predictions to the data for the$ A_{\eta_{\mu}} $ are also displayed.To conclude here, the NNLO calculations are validated with the data for the predicted distributions of the differential cross sections and
$ A_{\eta_{l}} $ variable in the$ \mu $ decay mode at 8 TeV. The predictions exhibit no significant deviations from the CMS and LHCb data within the quoted uncertainties in both the central and forward regions,$ 0 \leqslant \eta_{l} \leqslant 2.4 $ and$ 2.0 \leqslant \eta_{l} \leqslant 4.5 $ . The predicted results obtained using the CT14 PDF set reproduce data more consistently among several PDF sets that are being tested. The predictions are also observed to be in agreement with the FEWZ NNLO results reported in the CMS and LHCb measurements. These 8 TeV comparisons encourage the extension of the NNLO calculations by the MATRIX+RadISH framework to 13 TeV, the current center-of-mass energy of the LHC, where the impact of several$ p^{l}_{T} $ thresholds to the$ W $ boson charge asymmetry variables can be assessed further. The validation of the NNLO calculations in the$ e $ decay mode for the forward region$ 2.0 \leqslant \eta_{e} \leqslant 4.25 $ using the 8 TeV LHCb data was reported before in Ref. [35]. -
The 13 TeV charge asymmetry predictions from the perturbative QCD calculations of the
$ W^{+} $ and$ W^{-} $ boson differential cross sections are reported in this section. The predictions are obtained at NNLO accuracy for the$ A_{\eta_{l}} $ variable, where$ l $ is either$ \mu $ or$ e $ , by employing$ p^{l}_{T} > $ 20, 25, 30, and 40 GeV thresholds in both the central and forward phase space regions$ 0 \leqslant \eta_{l} \leqslant 4.5 $ . The total theoretical uncertainties are estimated using the procedure as described in Sec. II.C. The CT14 PDF set at the NNLO accuracy is used in the calculations. The bin edges for the$ \eta_{l} $ are used identically from the 8 TeV CMS measurement for the central region and are chosen for broader ranges to ensure more stable numerical results in the forward region as (0.00, 0.20), (0.20, 0.40), (0.40, 0.60), (0.60, 0.80), (0.80, 1.00), (1.00, 1.20), (1.20, 1.40), (1.40, 1.60), (1.60, 1.85), (1.85, 2.10), (2.10, 2.40), (2.40, 2.70), (2.70, 3.00), (3.00, 3.50), (3.50, 4.00), and (4.00, 4.50). The predicted$ A_{\eta_{l}} $ distributions from the different low-$ p^{l}_{T} $ thresholds are shown in Fig. 4. The predicted$ A_{\eta_{l}} $ numerical values corresponding to Fig. 4 are also listed in Table 1. The$ A_{\eta_{l}} $ distributions increase towards$ \eta_{l} $ bins of 3.00-3.50 where they begin to turn down for lower values through very forward bins. The$ A_{\eta_{l}} $ distribution clearly exhibits dependence on the minimum value of the$ p^{l}_{T} $ in both the central and forward regions. The$ A_{\eta_{l}} $ values decrease in going from a lower$ p^{l}_{T} $ threshold to a higher$ p^{l}_{T} $ threshold in the central region, whereas this correlation is reversed in the most forward two bins from 3.50-4.50. This means that the lepton charge asymmetry is higher in the central region but decreases more rapidly in the most forward region when using a lower$ p^{l}_{T} $ threshold.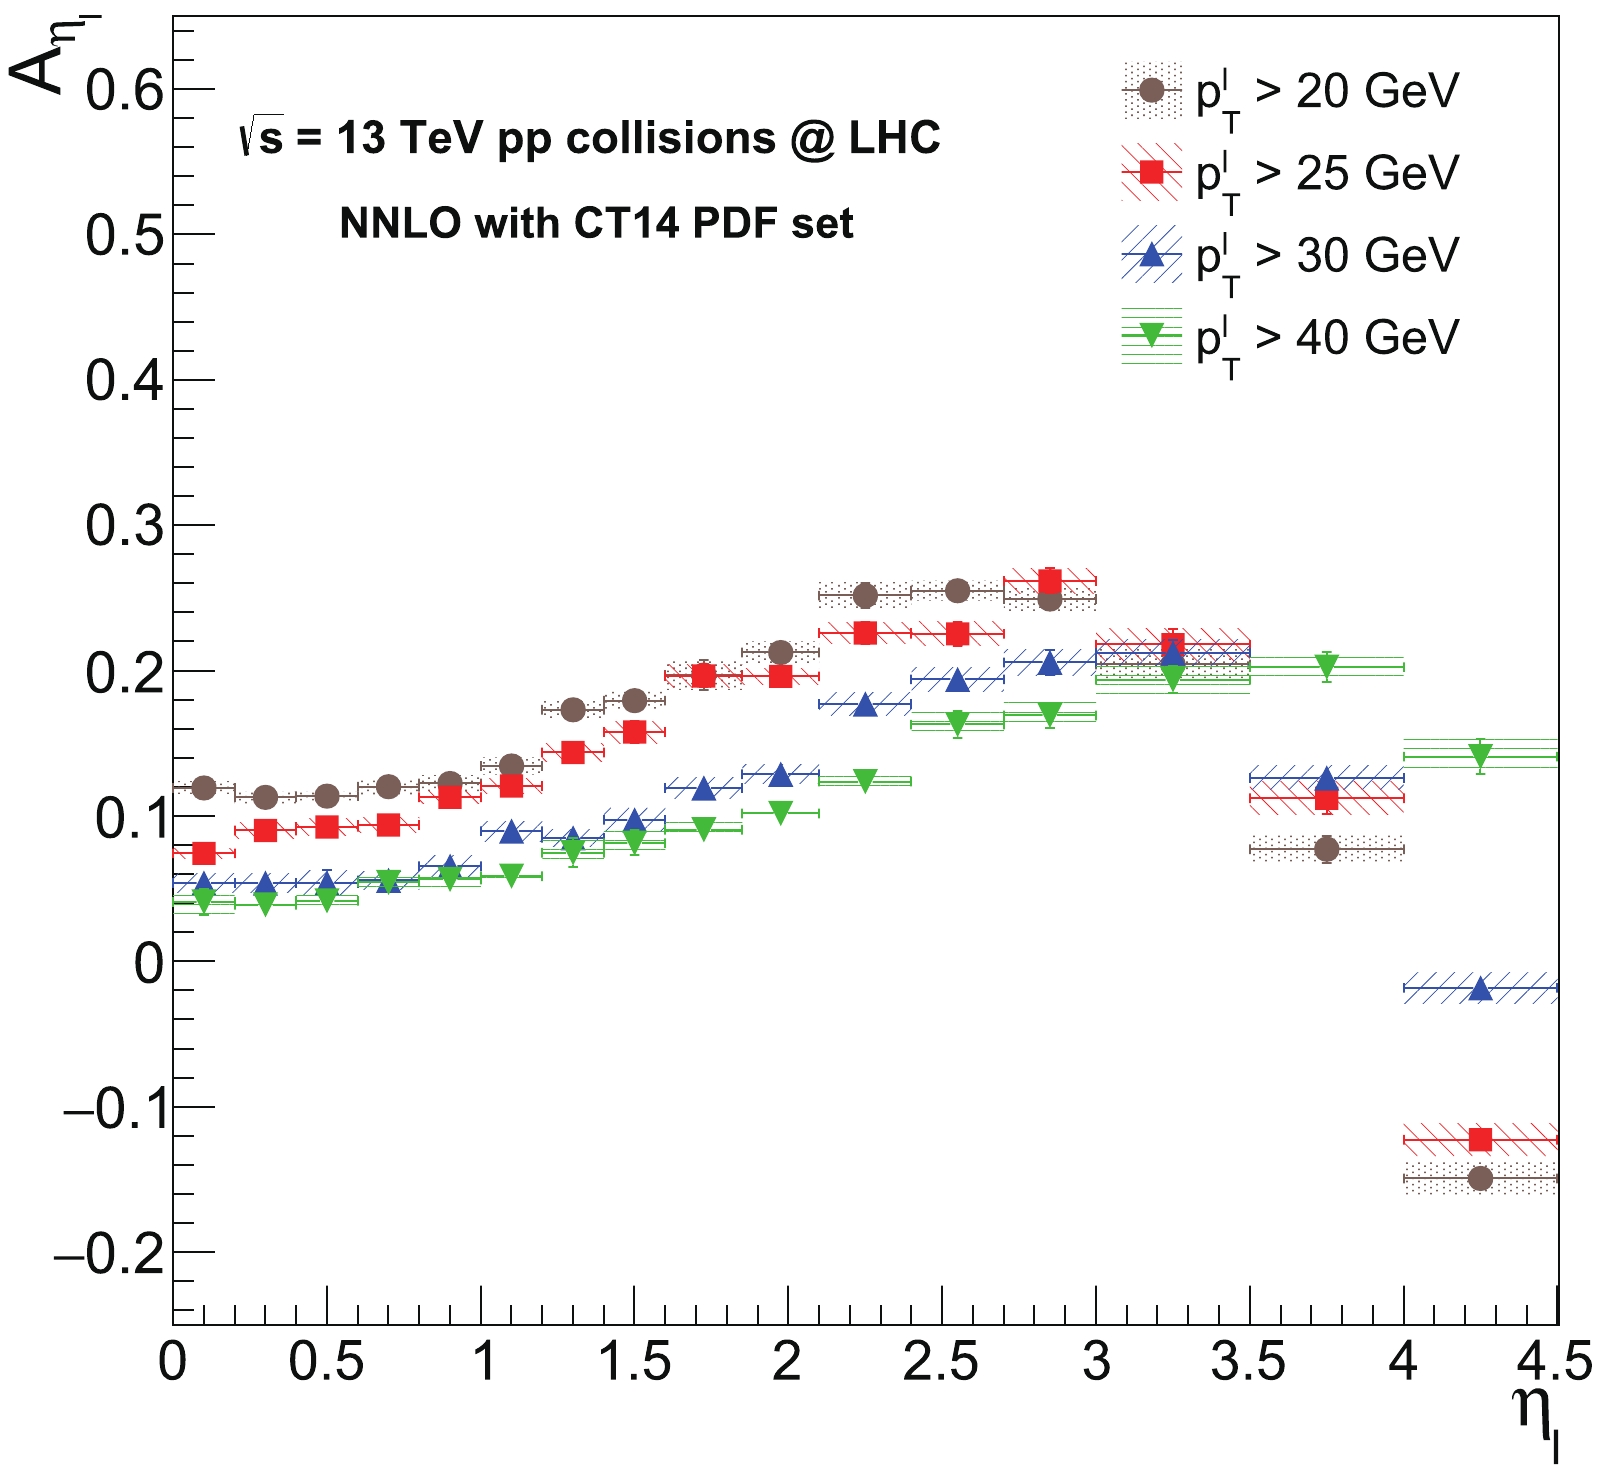
Figure 4. (color online) The 13 TeV predicted distributions for the
$ A_{\eta_{l}} $ variable from different low-$ p^{l}_{T} $ thresholds$ p^{l}_{T} > $ 20, 25, 30, and 40 GeV in bins of the$ \eta_{l} $ . The NNLO predictions are obtained in both central and forward regions using the CT14 PDF set. The total theoretical uncertainties are also included for the distributions.$ \eta_{l} $ 

$ p^{l}_{T} > \; 20\;{\rm{ GeV}}$ 

$ p^{l}_{T} > \; 25\;{\rm{ GeV}}$ 

$ p^{l}_{T} > \; 30\;{\rm{ GeV}}$ 

$ p^{l}_{T} > \; 40\;{\rm{ GeV}}$ 

0.00-0.20 11.93±0.4 07.43±0.4 05.39±0.7 04.09±0.9 0.20-0.40 11.28±0.4 09.00±0.5 05.39±0.6 03.89±0.4 0.40-0.60 11.37±0.3 09.25±0.6 05.40±0.8 04.17±0.6 0.60-0.80 12.02±0.5 09.39±0.5 05.74±0.6 05.44±0.5 0.80-1.00 12.24±0.5 11.30±0.4 06.55±0.7 05.64±0.7 1.00–1.20 13.45±0.6 12.07±0.5 08.96±0.7 05.87±0.5 1.20-1.40 17.31±0.6 14.37±0.6 08.50±0.6 07.48±0.9 1.40-1.60 17.94±0.6 15.78±0.7 09.74±0.8 08.14±0.9 1.60-1.85 19.70±1.0 19.63±0.8 11.93±0.7 09.05±0.7 1.85-2.10 21.25±0.8 19.61±0.6 12.87±0.6 10.17±0.5 2.10-2.40 25.16±0.9 22.60±0.7 17.71±0.8 12.37±0.6 2.40-2.70 25.50±0.7 22.53±0.8 19.40±0.8 16.29±0.9 2.70-3.00 24.93±0.8 26.17±0.8 20.57±0.8 16.92±0.8 3.00-3.50 20.42±1.0 21.79±1.1 21.21±0.9 19.37±0.9 3.50-4.00 07.72±0.9 11.22±1.1 12.62±0.8 20.25±1.0 4.00–4.50 -14.93±1.1 -12.27±1.1 -01.82±1.0 14.09±1.2 Table 1. Predicted values for the lepton charge asymmetry (in percent)
$ A_{\eta_{l}} $ (%) at NNLO accuracy using CT14 PDF sets at 13 TeV. The predictions are reported for different$ p^{l}_{T} $ thresholds in the$ \eta_{l} $ bins. The predictions include the total theoretical uncertainties.The charge asymmetry predictions are also obtained directly for the
$ A_{y_{W}} $ variable at the NNLO accuracy as a function of$ y_{W} $ , where$ y_{W} $ is calculated from the rapidities of the decay lepton and neutrino. Similarly, the fiducial phase space requirements and$ y_{W} $ bin edges for the$ A_{y_{W}} $ predictions are used from the$ A_{\eta_{l}} $ predictions at 13 TeV. The predicted$ A_{y_{W}} $ distributions from different low-$ p^{l}_{T} $ thresholds are compared as shown in Fig. 5. The predicted numerical values from Fig. 5 are also listed in Table 2. The$ A_{y_{W}} $ distributions increase consistently towards higher ranges of the$ y_{W} $ regardless of the$ p^{l}_{T} $ threshold. Contrary to the$ A_{\eta_{l}} $ variable, the$ A_{y_{W}} $ variable does not discriminate clearly among the predictions from different$ p^{l}_{T} $ thresholds in the central region. However, the prediction with$ p^{l}_{T} > $ 40 GeV tends to be slightly lower than the other predictions in the central region. The distributions start to increase more rapidly for a lower threshold in the forward bins, where the distribution with the$ p^{l}_{T} > $ 40 GeV threshold is predicted to be the lowest one in the bins. The$ A_{y_{W}} $ distribution increases the most with the lowest threshold$ p^{l}_{T} > $ 20 GeV in the forward bins. The correlation between the$ A_{\eta_{l}} $ and$ A_{y_{W}} $ variables become more apparent in the forward region when the distribution shapes approach each other with increasing values of the$ p^{l}_{T} $ . Therefore, a higher$ p^{l}_{T} $ threshold relates the$ A_{\eta_{l}} $ variable to the$ A_{y_{W}} $ variable increasingly in the forward region. The$ A_{\eta_{l}} $ distribution with the highest$ p^{l}_{T} $ threshold also approaches the$ A_{y_{W}} $ distribution more in the central region. This observation can be supported by the explanation that the average angle between the$ W $ boson and decay lepton decreases when$ p^{l}_{T} $ is increased. As a result, the correlation between the$ A_{\eta_{l}} $ and$ A_{y_{W}} $ variables is enhanced. The$ A_{\eta_{l}} $ distribution using a higher threshold in the low-$ p^{l}_{T} $ region probes the$ A_{y_{W}} $ more by allowing a finer dependence on the$ x $ values, where a unique set of inputs for the PDF determination can be obtained. Finally, the total theoretical uncertainty of the$ A_{y_{W}} $ prediction at the NNLO is compared with the total experimental uncertainty of a recent measurement preformed at the LHC [36], in which the W boson asymmetry is reported for the$ y_{W} $ at 13 TeV. The theoretical uncertainties, which are in the range ~2%-14% in the presence of the threshold$ p^{l}_{T} > $ 25 from Table 2, are found to be smaller than or comparable to the total experimental uncertainty of the$ A_{y_{W}} $ measurement in the$ 0 \leqslant y_{W} \leqslant 2.5 $ range. The total experimental uncertainty increases towards higher ranges in the central$ y_{W} $ region, and therefore, the$ A_{y_{W}} $ measurements are anticipated to be challenging in the forward region$ 2.0 \leqslant y_{W} \leqslant 4.5 $ in terms of the experimental precision to be achieved.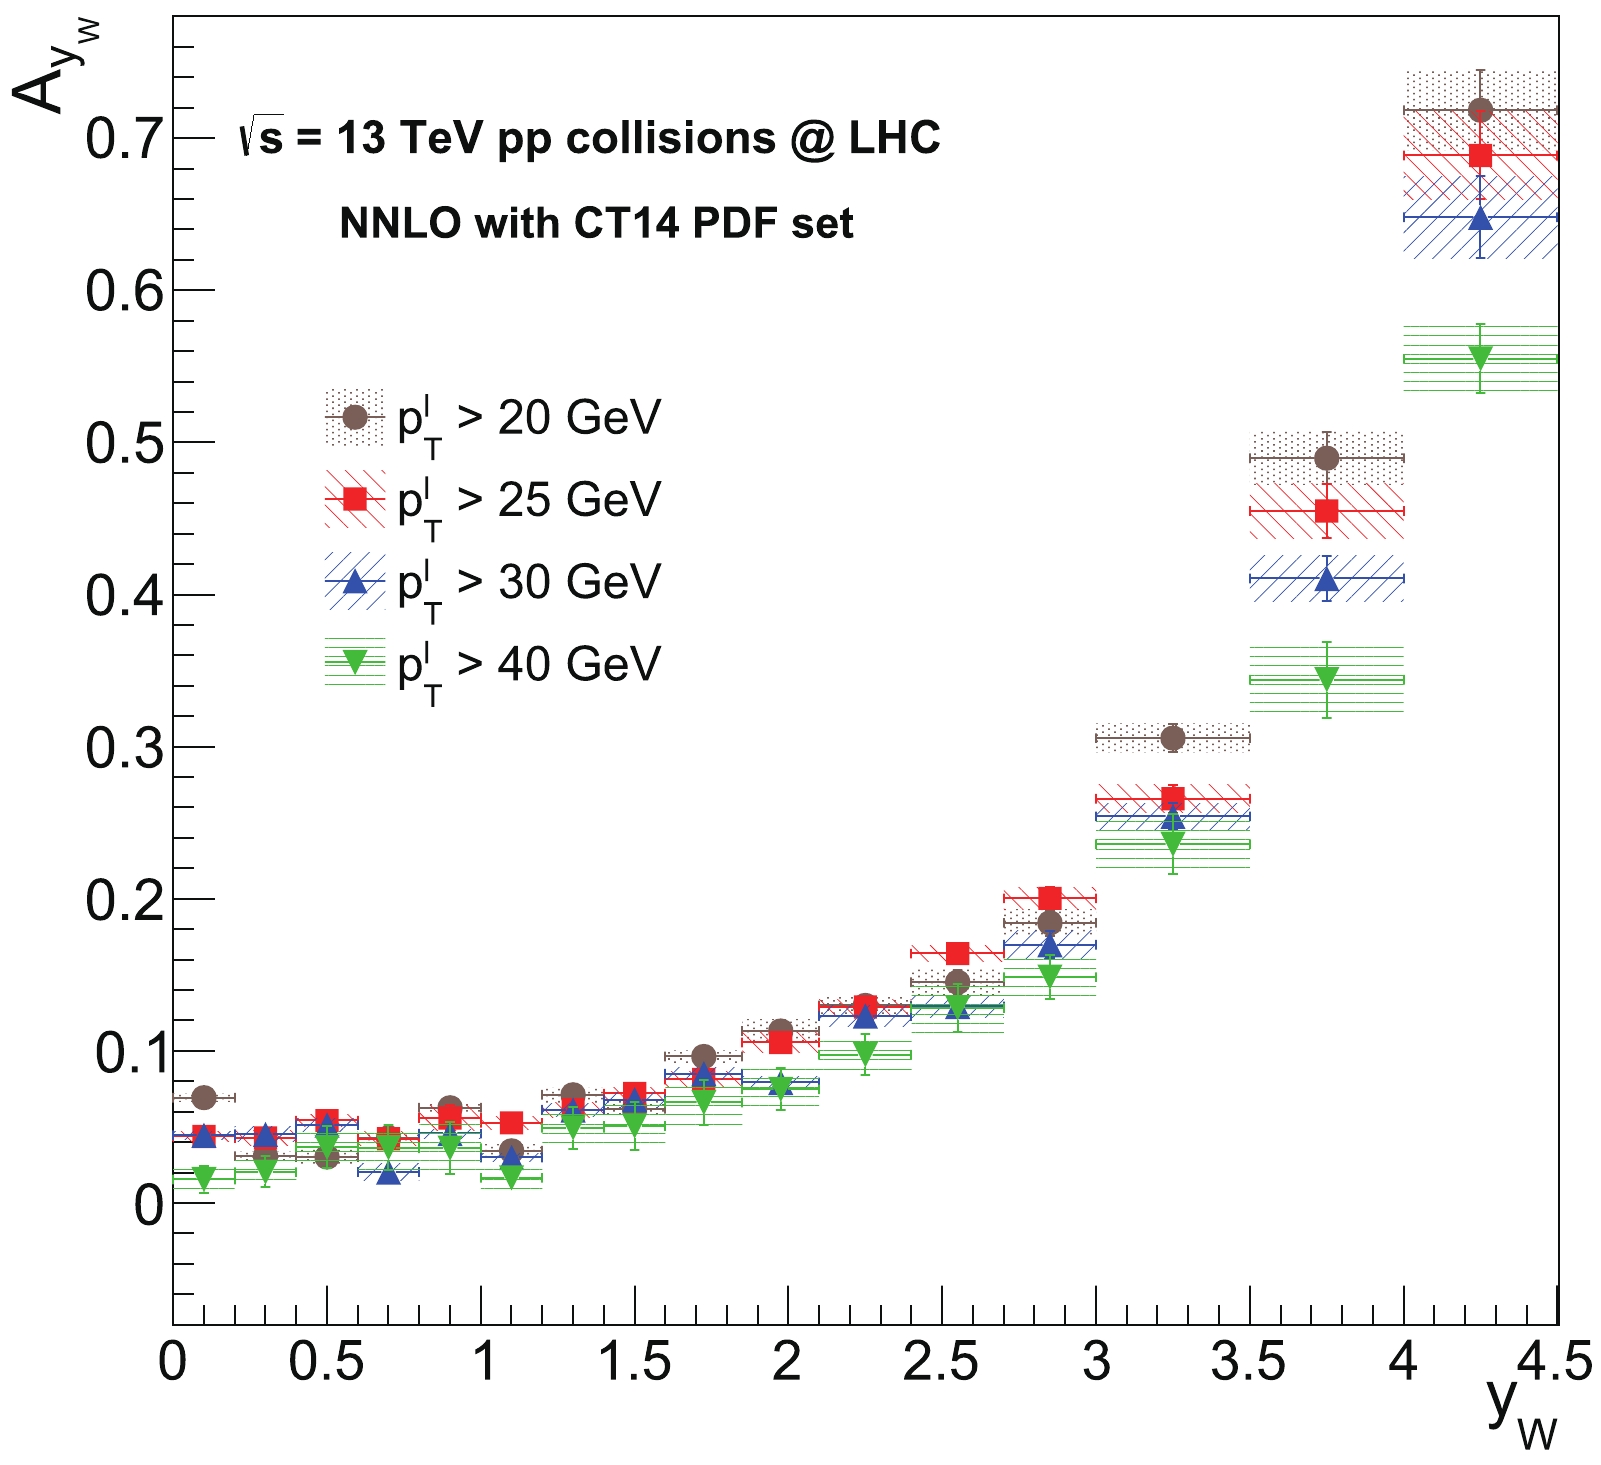
Figure 5. (color online) 13 TeV predicted distributions for the
$ A_{y_{W}} $ variable from different low-$ p^{l}_{T} $ thresholds$ p^{l}_{T} > $ 20, 25, 30, and 40 GeV in bins of the$ y_{W} $ . The NNLO predictions are obtained in both the central and forward regions using the CT14 PDF set. Total theoretical uncertainties are also included for the distributions.$ y_{W} $ 

$ p^{l}_{T} > \; 20\;{\rm{ GeV}}$ 

$ p^{l}_{T} > \; 25\;{\rm{ GeV}}$ 

$ p^{l}_{T} > \; 30\;{\rm{ GeV}}$ 

$ p^{l}_{T} > \; 40\;{\rm{ GeV}}$ 

0.00–0.20 06.93±0.3 04.38±0.4 04.46±0.3 01.55±0.9 0.20–0.40 03.08±0.3 04.28±0.5 04.52±0.5 02.04±1.0 0.40–0.60 03.03±0.5 05.42±0.4 05.13±0.4 03.66±1.3 0.60–0.80 04.30±0.2 04.23±0.5 02.05±0.6 03.64±1.5 0.80–1.00 06.27±0.3 05.60±0.8 04.57±0.3 03.61±1.7 1.00–1.20 03.44±0.4 05.27±0.4 03.00±0.3 01.66±0.8 1.20–1.40 07.12±0.5 06.14±0.5 06.12±0.4 04.95±1.4 1.40–1.60 06.19±0.5 07.20±0.4 06.80±0.5 05.07±1.5 1.60–1.85 09.64±0.4 08.13±0.5 08.51±0.4 06.61±1.5 1.85–2.10 11.32±0.7 10.56±0.7 07.93±0.4 07.47±1.4 2.10–2.40 13.00±0.5 12.90±0.5 12.30±0.6 09.75±1.4 2.40–2.70 14.52±0.8 16.40±0.5 12.92±0.7 12.83±1.6 2.70–3.00 18.42±0.8 20.03±0.7 16.99±0.9 14.85±1.5 3.00–3.50 30.57±0.9 26.57±0.9 25.42±0.8 23.59±1.9 3.50–4.00 48.97±1.7 45.50±1.8 41.06±1.5 34.40±2.5 4.00–4.50 71.84±2.6 68.87±2.9 64.80±2.7 55.50±2.3 Table 2. Predicted values of the
$ W $ boson charge asymmetry (in percent)$ A_{y_{W}} $ (%) at the NNLO accuracy using CT14 PDF sets at 13 TeV. The predictions are reported for different$ p^{l}_{T} $ thresholds in bins of the$ y_{W} $ . The predictions include the total theoretical uncertainties. -
The charge asymmetry predictions are provided in the previous section for the variables that are defined in terms of the
$ \eta_{l} $ and$ y_{W} $ . The charge asymmetry can also be predicted in terms of the$ p^{W}_{T} $ using an analogous definition with regards to Eqs. (1) and (2) as$ A_{p^{W}_{T}} = \frac{{\rm d}\sigma(W^+\rightarrow l^+\nu)/{\rm d}p^{W}_{T}-{\rm d}\sigma(W^-\rightarrow l^-\bar{\nu})/{\rm d}p^{W}_{T}}{{\rm d}\sigma(W^+\rightarrow l^+\nu)/{\rm d}p^{W}_{T}+{\rm d}\sigma(W^-\rightarrow l^-\bar{\nu})/{\rm d}p^{W}_{T}} $

(4) to acquire more insight into the
$ W $ boson production asymmetry in the presence of different$ p^{l}_{T} $ thresholds. The$ A_{p^{W}_{T}} $ variable can reveal additional information for the impact of using various$ p^{l}_{T} $ thresholds on the predicted asymmetry in bins of the$ p^{W}_{T} $ . The$ A_{p^{W}_{T}} $ predictions at 13 TeV are first obtained at the NNLO to test the dependency on low-$ p^{l}_{T} $ thresholds of$ p^{l}_{T} > $ 20, 25, 30, and 40 GeV. The predictions are obtained for the region$ 0 \leqslant \eta_{l} \leqslant 4.5 $ in the$ p^{W}_{T} $ range 0–150 GeV as shown in Fig. 6. The predicted numerical values at the NNLO from Fig. 6 are also listed in Table 3. The$ A_{p^{W}_{T}} $ distributions consistently decrease towards higher bin ranges of the$ p^{W}_{T} $ at all$ p^{l}_{T} $ thresholds except for the highest bin. However, the distribution is flatter at the lowest threshold of 20 GeV. The$ A_{p^{W}_{T}} $ distribution obviously decreases from the prediction using a lower threshold to the prediction using a higher threshold in$ p^{l}_{T} $ throughout the entire$ p^{W}_{T} $ region. Therefore, the increasing$ p^{l}_{T} $ threshold yields lower$ A_{p^{W}_{T}} $ values in both the central and forward regions. These results already emphasize that the$ p^{W}_{T} $ and$ p^{l}_{T} $ are closely correlated kinematic variables.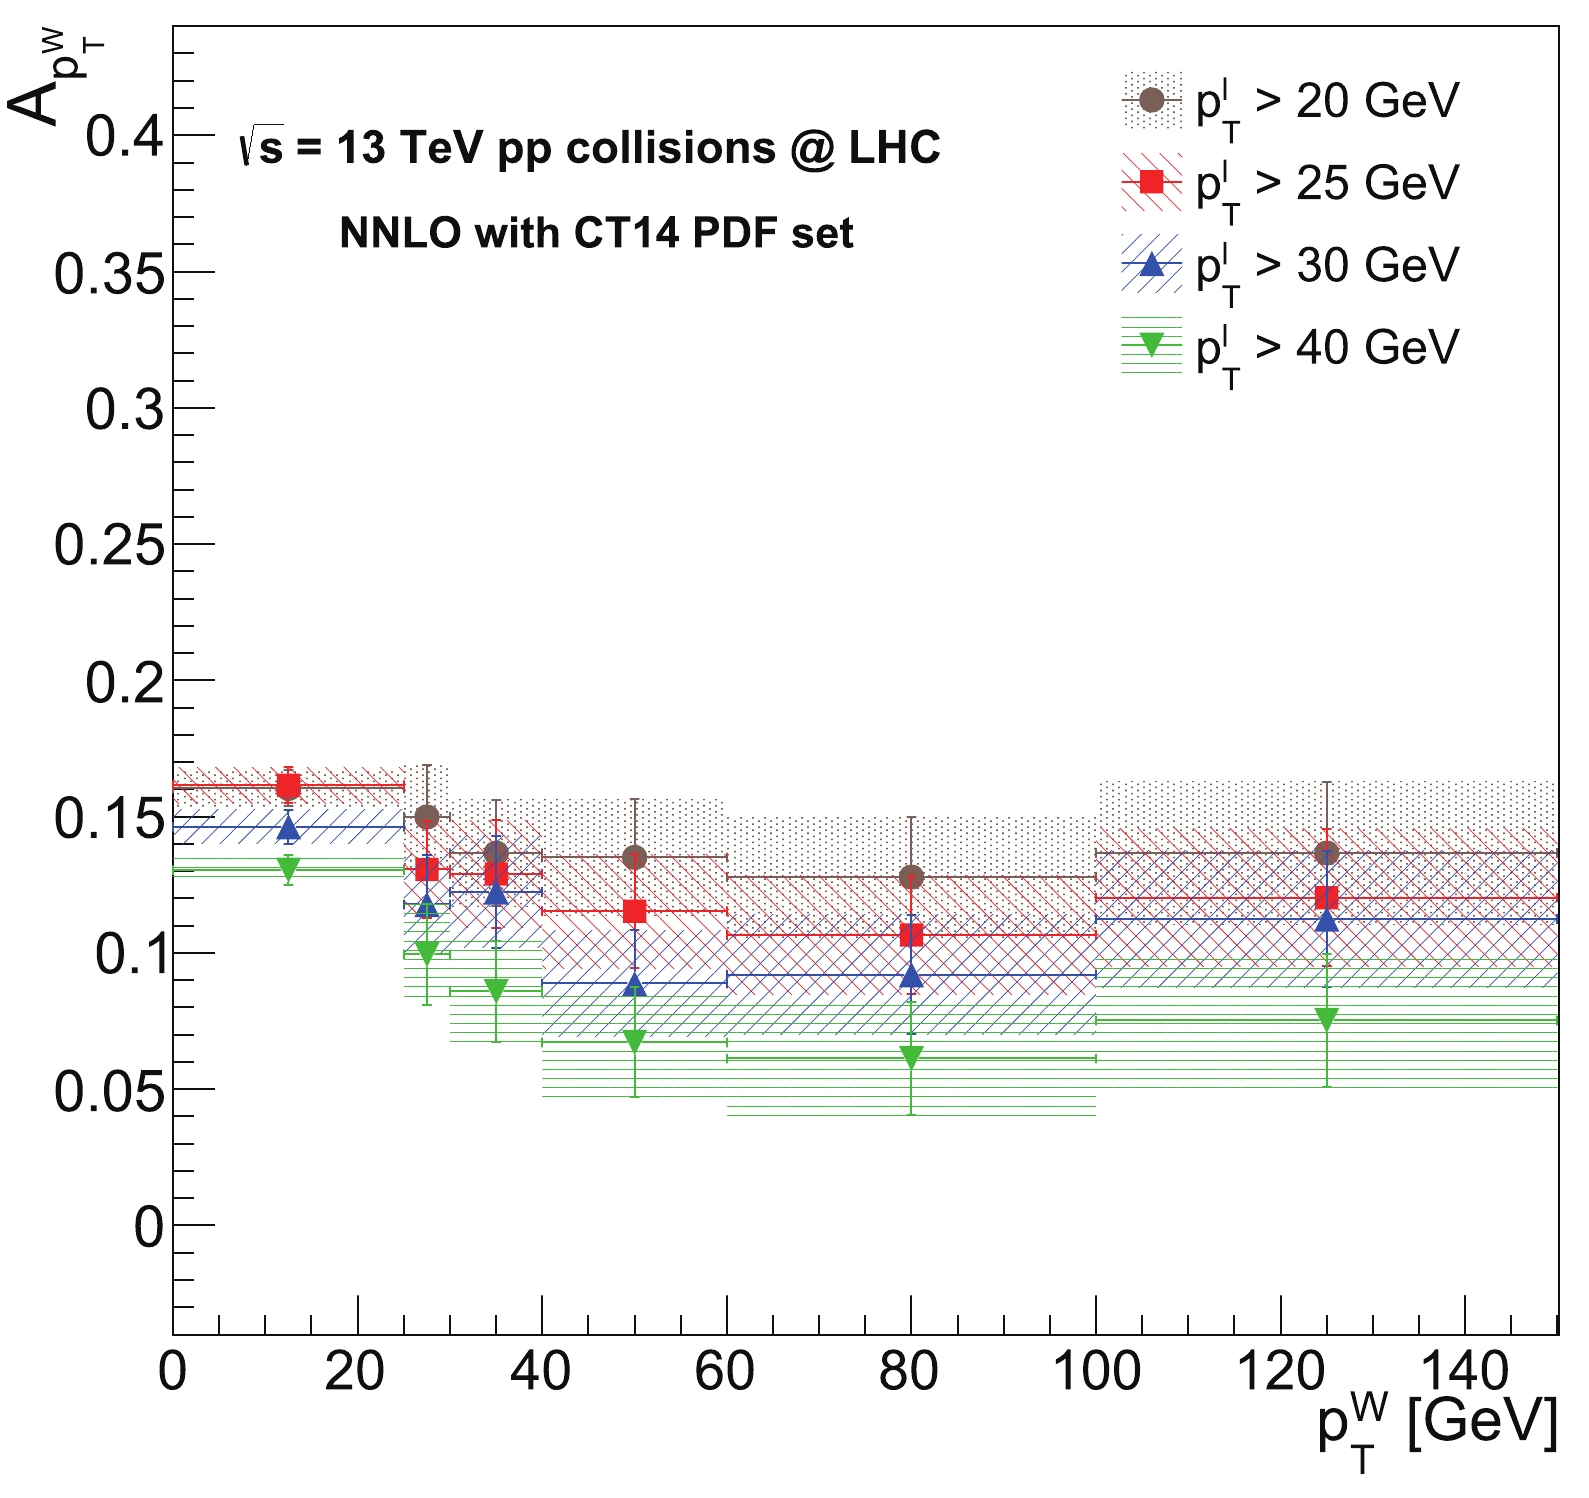
Figure 6. (color online) The 13 TeV predicted distributions for the
$ A_{p^{W}_{T}} $ variable based on different low-$ p^{l}_{T} $ thresholds$ p^{l}_{T} > $ 20, 25, 30, and 40 GeV in bins of the$ p^{W}_{T} $ . The predictions at the NNLO accuracy are obtained in both the central and forward regions using the CT14 PDF set. Total theoretical uncertainties are also included for the distributions.$ p^{W}_{T} $ 

$p^{l}_{T} > 20\;{\rm{ GeV} }$ 

$p^{l}_{T} > 25\;{\rm{ GeV} }$ 

$p^{l}_{T} > 30\;{\rm{ GeV} }$ 

$p^{l}_{T} > 40\;{\rm{ GeV} }$ 

0-25 16.04±0.7 16.15±0.6 14.63±0.6 13.04±0.6 25-30 15.00±1.9 13.06±1.8 11.78±1.8 09.94±1.8 30-40 13.67±1.9 12.90±1.9 12.24±2.0 08.58±1.8 40-60 13.50±2.1 11.53±2.1 08.88±1.9 06.72±2.0 60-100 12.79±2.2 10.66±2.2 09.20±2.2 06.12±2.0 100-150 13.67±2.6 12.03±2.5 11.25±2.5 07.52±2.4 Table 3. Predicted values for the charge asymmetry (in percent)
$ A_{p^{W}_{T}} $ (%) at the NNLO accuracy using the CT14 PDF set at 13 TeV. The predictions are reported for different$ p^{l}_{T} $ thresholds in the bins of the$ p^{W}_{T} $ . The predictions include the total theoretical uncertainties.Next, the
$ A_{p^{W}_{T}} $ distributions at 13 TeV are obtained using the matched calculation of the resummation with the fixed-order NNLO to have more accurate predictions. The$ p^{W}_{T} $ distribution is affected by soft and collinear gluon radiation at low values, where the fixed-order calculations are unable to sufficiently account for it. Thereby, the resummation of large logarithmic corrections is also necessary to model$ p^{W}_{T} $ more accurately at low values. The differential cross sections of the W+ and$ W^{-} $ bosons as a function of the$ p^{W}_{T} $ are predicted by the matched prediction at the NNLO+N3LL accuracy to achieve more reliable$ A_{p^{W}_{T}} $ predictions. The$ A_{p^{W}_{T}} $ distributions that are predicted at the NNLO+N3LL accuracy by employing different$ p^{l}_{T} $ thresholds are shown in Fig. 7. In Table 4, the predicted numerical values from Fig. 7 are presented. Similarly, the predicted values decrease continuously with the increasing$ p^{l}_{T} $ threshold apart from the highest bin, as being also tested at a higher accuracy of NNLO+N3LL. The highest threshold yields the lowest$ A_{p^{W}_{T}} $ values through the entire$ p^{W}_{T} $ ranges. Therefore, it is shown that the$ A_{p^{W}_{T}} $ predictions also depend on the$ p_{T} $ threshold applied on the decay lepton, which can be attributed to the V-A structure of the$ W $ boson couplings to fermions.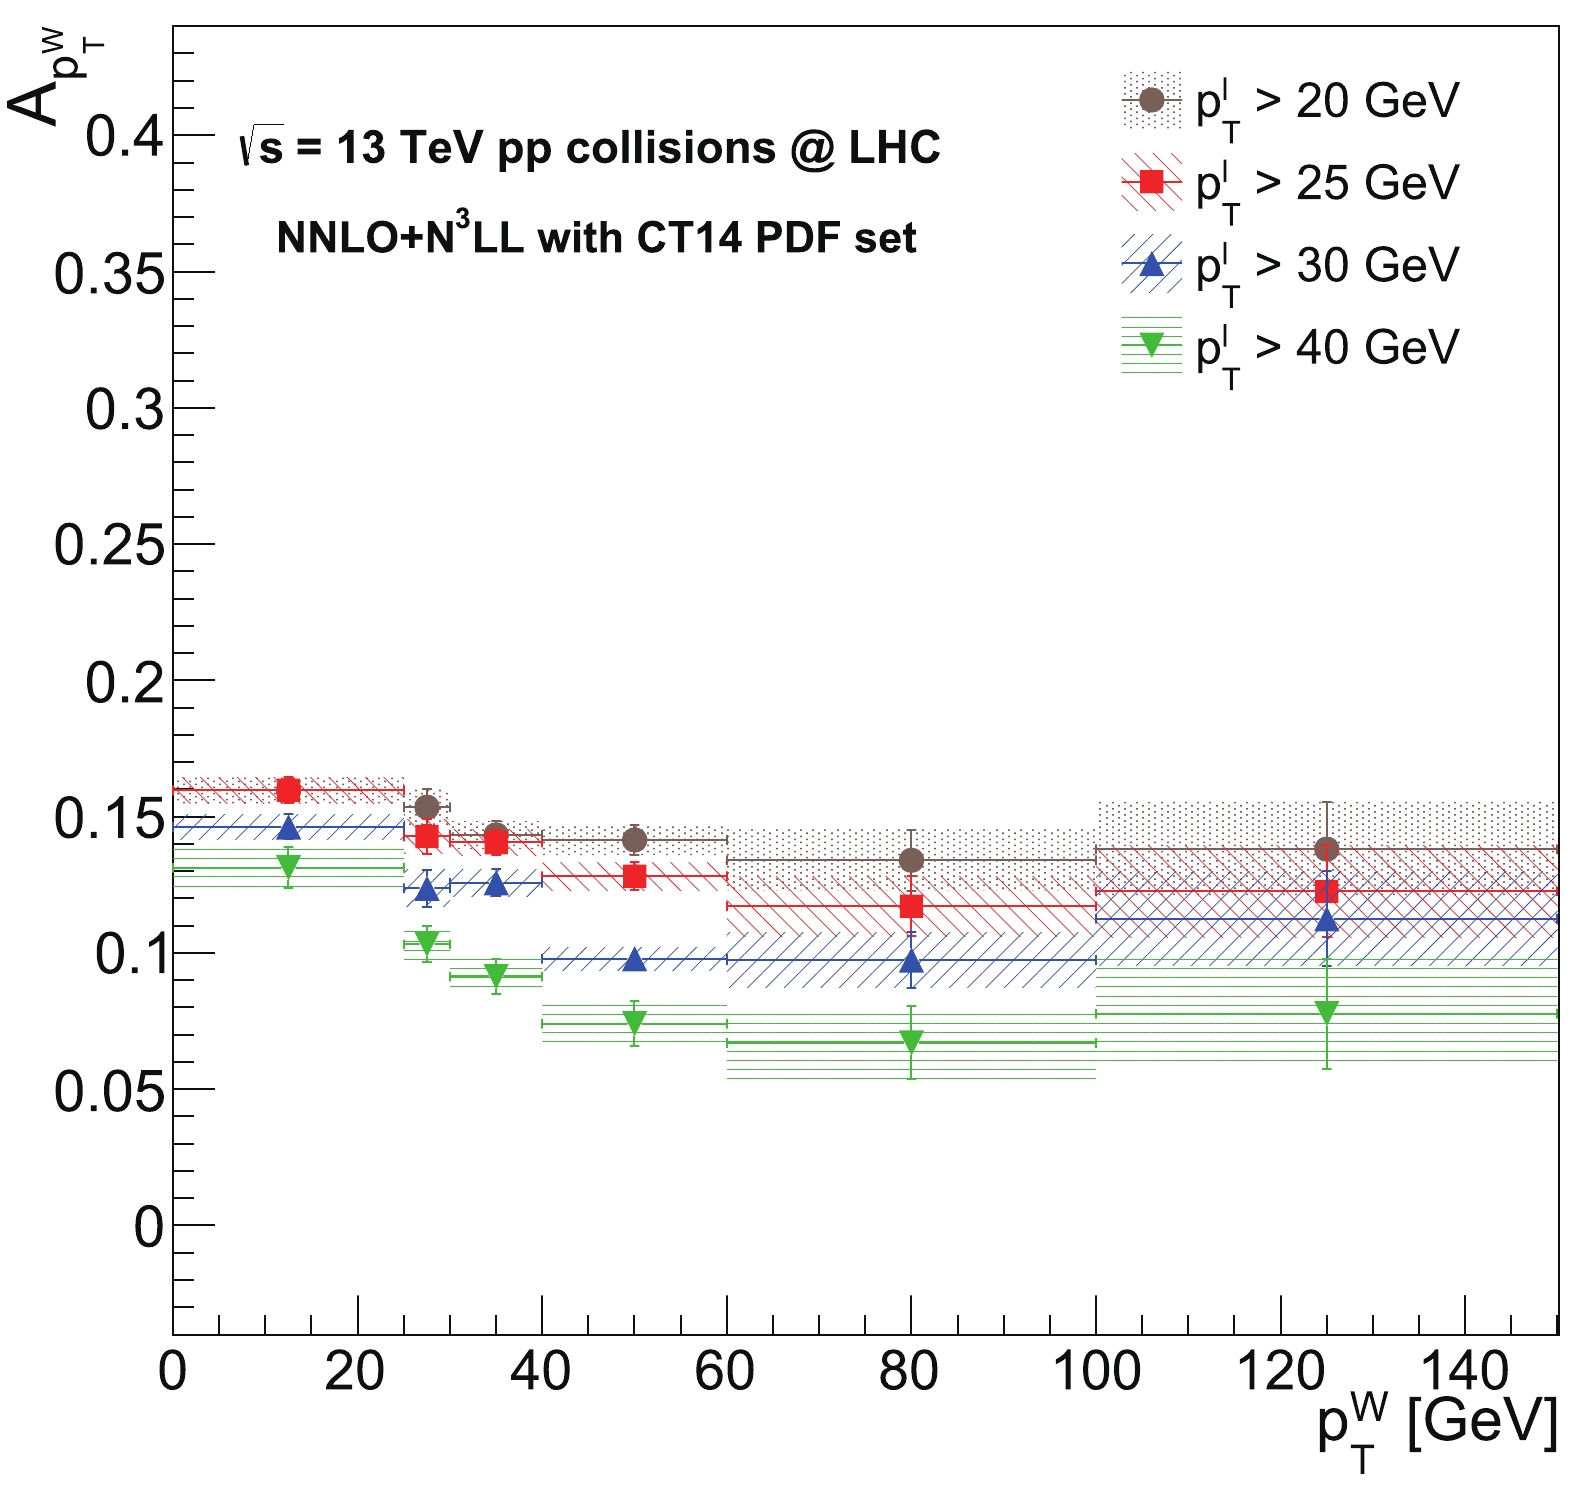
Figure 7. (color online) 13 TeV predicted distributions for the
$ A_{p^{W}_{T}} $ variable based on different low-$ p^{l}_{T} $ thresholds$ p^{l}_{T} > $ 20, 25, 30, and 40 GeV in bins of the$ p^{W}_{T} $ . The merged predictions at the NNLO+N3LL accuracy are obtained in both the central and forward regions using the CT14 PDF set. Total theoretical uncertainties are also included for the distributions.$ p^{W}_{T} $ 

$p^{l}_{T} > 20\;{\rm{ GeV} }$ 

$p^{l}_{T} > 25\;{\rm{ GeV} }$ 

$p^{l}_{T} > 30\;{\rm{ GeV} }$ 

$p^{l}_{T} > 40\;{\rm{ GeV} }$ 

0-25 15.97±0.5 15.97±0.5 14.62±0.5 13.13±0.8 25-30 15.35±0.7 14.27±0.6 12.38±0.7 10.32±0.7 30-40 14.34±0.5 14.05±0.5 12.58±0.5 09.13±0.6 40-60 14.15±0.5 12.82±0.5 09.79±0.4 07.40±0.8 60-100 13.40±1.1 11.72±1.1 09.75±1.0 06.70±1.3 100-150 13.81±1.7 12.26±1.7 11.25±1.7 07.77±2.0 Table 4. Predicted values for the charge asymmetry (in percent)
$ A_{p^{W}_{T}} $ (%) at the NNLO+N3LL accuracy using the CT14 PDF set at 13 TeV. The predictions are reported for different$ p^{l}_{T} $ thresholds in bins of the$ p^{W}_{T} $ . The predictions include total theoretical uncertainties.To this end, the experimental uncertainty of the normalized differential cross section as a function of the
$ p^{W}_{T} $ is checked from the CMS measurement [37] to anticipate a comparison between the experimental uncertainty that can be achieved and the theoretical uncertainty estimated at the NNLO(+N3LL) accuracy for the$ A_{p^{W}_{T}} $ at 13 TeV. Experimental uncertainty including both systematic and statistical components is ~1.2%-6.0%, whereas the total theoretical uncertainty range is 2.1%-9.0% (1.5%-6.0%) in the NNLO (NNLO+N3LL) predictions for the differential cross section of the$ p^{W}_{T} $ in the range 0-150 GeV. Therefore, experimental uncertainty is anticipated to be lower than (comparable to) the theoretical uncertainty in the NNLO (NNLO+N3LL) predictions of the$ A_{p^{W}_{T}} $ at 13 TeV. -
In this paper, a dedicated study of the theoretical predictions for the
$ W $ boson charge asymmetries in$ pp $ collisions was presented. The predictions were obtained with the inclusion of NNLO corrections in perturbative QCD for both the central and forward phase space regions$ 0 \leq \eta_{l} \leq 4.5 $ . This phase space region for the charge asymmetries allows the probing of the relative$ u $ and$ d $ quark distributions in the proton at very small and large$ x $ values. The predictions that were based on various PDF models were compared with the CMS and LHCb data for the lepton charge asymmetry$ A_{\eta_{l}} $ in the muon decay mode at 8 TeV. The$ A_{\eta_{l}} $ (%) distributions are generally observed to be in good agreement with the 8 TeV data within the quoted uncertainties. The distributions using the CT14 PDF set are shown to reproduce data slightly better over the other PDF sets that are being tested. These comparisons enabled the justification of the predictions and encouraged the extension of the study to 13 TeV, which is the current center-of-mass energy of$ pp $ collisions at the LHC.The predicted distributions were presented for the charge asymmetries
$ A_{\eta_{l}} $ and$ A_{y_{W}} $ at the NNLO accuracy of 13 TeV. Various increasing low-$ p^{l}_{T} $ thresholds$ p^{l}_{T} > $ 20, 25, 30, and 40 GeV in the region$ 0 \leqslant \eta_{l} \leqslant 4.5 $ are used to assess the impact on the predicted asymmetries. The$ A_{\eta_{l}} $ distributions from different$ p^{l}_{T} $ thresholds increase in the central region and decrease in the forward region. The$ A_{\eta_{l}} $ distribution exhibits clear dependency to$ p^{l}_{T} $ , where it increases more in correlation with decreasing threshold in the central region up to the$ \eta_{l} $ bin 3.0-3.5. After this bin, the$ A_{\eta_{l}} $ distribution decreases more with lower threshold in the very forward range 3.5-4.5. The predicted$ A_{\eta_{l}} $ is observed to be the lowest (highest) in the central (forward) region with the highest threshold$ p^{l}_{T} > $ 40 GeV that is being tested. Furthermore, the charge asymmetry distributions that are obtained directly with the$ A_{y_{W}} $ are observed to increase continuously towards higher ranges of the$ y_{W} $ . The$ A_{y_{W}} $ is predicted to be larger at higher$ y_{W} $ bins which can be attributed to the increasing ratio of the$ u $ and$ d $ quark distribution functions while probing the valence quarks more in the higher bins. Contrary to the$ A_{\eta_{l}} $ , the$ A_{y_{W}} $ distribution does not strongly discriminate among different thresholds in most of the central ranges. The$ A_{y_{W}} $ distribution increases more in correlation with the lower threshold in the forward$ y_{W} $ bins, where it is lower with the$ p^{l}_{T} > $ 40 GeV threshold. In the$ A_{\eta_{l}} $ and$ A_{y_{W}} $ predictions, it has been clearly shown that$ A_{\eta_{l}} $ distribution gets closer to the$ A_{y_{W}} $ distribution in the presence of the highest threshold$ p^{l}_{T} > $ 40 GeV in both the central and forward regions. This observation is in support of the point that the average angle between the$ W $ boson and the decay lepton is decreased with a higher$ p^{l}_{T} $ requirement, and as a result, the correlation between the$ A_{\eta_{l}} $ and$ A_{y_{W}} $ is enhanced accordingly.The 13 TeV distributions are also reported for the charge asymmetry in bins of the
$ p^{W}_{T} $ ,$ A_{p^{W}_{T}} $ , at both the NNLO and NNLO+N3LL, where the accuracy is remarkably improved in the matched predictions. The predicted distributions decrease continuously towards the higher$ p^{W}_{T} $ ranges apart from the very last bin at 100-150 GeV. The$ A_{p^{W}_{T}} $ distribution is observed to exhibit clear dependency to the$ p^{l}_{T} $ threshold as anticipated. It has been shown that the distribution remains flat at the lowest threshold of 20 GeV while it decreases more in correlation with the increasing threshold. Based on the results presented, it was shown that$ A_{p^{W}_{T}} $ can be used as an alternate probe for the$ W $ boson charge asymmetries.Finally, the study shows the potential impact of the
$ p^{l}_{T} $ dependence in the$ W $ boson leptonic decay in terms of the charge asymmetries. The predicted results can further be used for improving the existing constraints on the ratio of$ u $ and$ d $ quark distribution functions in the range$ 10^{-4} < x < 1 $ , evaluation of differences among PDF models, and contribution in general to accurate PDF determinations.
Impact of lepton pT threshold on charge asymmetry predictions for inclusive W boson production in pp collisions at 13 TeV
- Received Date: 2021-04-15
- Available Online: 2021-08-15
Abstract: This paper presents the impact of the lepton transverse momentum


 DownLoad: