


 Abstract
 HTML
HTML Reference
 Related
 PDF
PDF


-
Clustering is one of the notable dynamical attributes of an atomic nucleus exhibiting regular patterns, despite the complexities associated with nuclear many-body systems. The prediction of cluster decay dates back to the theoretical investigation of Sandulescu et al. in 1980 [1], in which the shell closure effect of one of the reactants was used to reproduce a cold reaction on the basis of fragmentation theory [2]. Subsequently, Rose and Jones [3] validated the findings, where cluster radioactivity was established as a highly asymmetric spontaneous disintegration of radioactive nuclei in which the particle emitted is heavier than
$ ^4 $ He and still smaller than the lightest fission fragments. Thus far, the emission of$ ^{14} $ C,$ ^{18,20} $ O,$ ^{23} $ F,$ ^{22,24-26} $ Ne,$ ^{28,30} $ Mg, and$ ^{32,34} $ Si clusters from various trans-lead nuclei ($ ^{221} $ Fr –$ ^{242} $ Cm) have been observed [4]. The emitted clusters in this region are usually associated with the double magic nucleus$ ^{208}_{82} $ Pb or nuclei in its vicinity as daughters. Taking into account the kinematics of cluster emission, previous studies [5, 6] have revealed that, like α-decay and spontaneous emission, the rate at which clusters are emitted from odd-parent nuclei is confronted with more structural obstacles than the rate of cluster emissions from its neighboring even-even isotopes. Furthermore, it has been shown that there is a substantial difference between the observed kinetic energy and the Q-value of the cluster decay, suggesting a considerable recoil effect [7].From the theoretical viewpoint, cluster radioactivity follows the description of the Gamow model of α-decay, which hinges on the quantum tunneling effect. This description can be grouped into two main categories according to the treatment of cluster emission, i.e., fission and α-like models. The fission models, e.g., the analytic super asymmetric fission model (ASAFM) of Poenaru et al. [8, 9], assume that the parent nucleus undergoes continuous deformation until it penetrates the confining interaction barrier and thus attains the saddle configuration. This approach takes no cognizance of the preformation of the cluster within the parent nucleus before its emission. In other words, the preformation probability (
$ P_0 $ ) is taken as unity. In contrast, the α-like models such as the preformed cluster-decay model (PCM) [10–12], which is rooted in the quantum mechanical fragmentation theory (QMFT), assume that clusters are composed of several nucleons pre-born within the parent nucleus before tunneling through the potential barrier. Thus, realistic values of$ P_0 $ can be calculated, and as a result, the experimental half-lives can be accurately reproduced. The literature [13–17] is replete with different expressions to estimate$ P_0 $ , and the predictive powers of most are restricted to a certain region of the nuclear chart or fitted with arbitrary constants without a clear link/relevance to the kinematics and the underlying concept of cluster emission.This concept was investigated in the derivation of our newly proposed preformation formula [18], and it was extended in the present study to reproduce the experimentally measured half-lives of cluster decay. Additionally, by exploring the mechanism and kinematics in the decay channel, we contemplate that a certain amount of energy must be expended during cluster formation just before its emission, in contrast to previous studies [19, 20], where emphasis was placed on the kinetic energy but the recoil energy was assumed to be negligible. An assumption such as Levinger's approximation [21], where the recoil energy is considered too low, becomes invalid for natural radioactivity in which heavy ions are emitted [22]. Hence, this study aims to investigate the systematic contribution of the decay energy into three distinct parts, accounting for cluster preformation, emission or tunneling, and the residual energy with which the daughter nucleus recoils. Furthermore, the relative separation between the decay fragments denoted ΔR is used to account for the effect of neck formation that determines the first turning point for barrier penetration within the PCM [23], which is used for the present investigation. This barrier is formed by the interplay of the Coulomb and nuclear potentials.
The Coulomb potential can be simply estimated as the ratio of the product of the charges of the decay fragments (emitted cluster and the daughter nucleus) to the sum of their radii. However, obtaining the nuclear potential typically involves the use of phenomenological [24, 25] or microscopic approaches [26, 27]. In addition to the fundamental approaches [28, 29], the R3Y nucleon-nucleon (NN) potential [30, 31], which stems from the relativistic mean-field (RMF) Lagrangian using the NL
$ 3^* $ parameter set, is employed in the present study, along with the phenomenological M3Y NN potential [32]. The RMF theory is apt for handling the ground and excited-state properties of the atomic nuclei [33–35]. The$Q$ -values are also calculated from the RMF (NL$ 3^* $ ) and are compared with the macroscopic-microscopic WS3 [36] and those obtained from the experimental binding energy data [37]. The WKB approximation is used to estimate the penetration probability P. The remainder of this paper is organized as follows: Sec. II gives a brief description of the theoretical framework, which includes the relativistic mean-field (RMF) and the folding procedure for the R3Y and M3Y NN potentials. The preformed cluster-decay model (PCM) and the new formula$ P_0 $ that produces a set of new equations are also presented. Section III presents the results in detail, along with corresponding discussions. Finally, the conclusions and a summary of this work are given in Sec. IV. -
The relativistic mean-field (RMF) Lagrangian is built from the interaction between the nucleonic field and the three mesonic fields, i.e., isoscalar-scalar σ, isoscalar-vector ω, and isovector-vector ρ, as well as the photon field
$ A_\mu $ , together with their respective coupling constants ($ g_\sigma $ ,$ g_\omega $ ,$ g_\rho $ ) [38–41]:$ \begin{aligned}[b] {\cal L}=&\overline\psi_ i\left\{{\rm i}\gamma^{\mu}\partial_{\mu}-M\right\}\psi_i+\frac{1}{2}\partial^{\mu}\sigma\partial_{\mu}\sigma\\ &-\frac{1}{2}m_{\sigma}^{2}\sigma^2-\frac{1}{3}g_2\sigma^3-\frac{1}{4}g_3\sigma^4-g_\sigma\overline{\psi}_i\psi_i\sigma\\ &-\frac{1}{4}\Omega^{\mu\nu}\Omega_{\mu\nu} +\frac{1}{2}m^2_\omega \omega^\mu \omega_\mu-g_\omega\overline{\psi}_i\gamma^\mu\psi_i \omega_\mu\\ &-\frac{1}{4}\vec B^{\mu\nu}.\vec B_{\mu\nu}+\frac{1}{2}m^2_\rho\vec \rho^\mu.\vec \rho_\mu-g_\rho\overline{\psi}_i\gamma^\mu\vec{\tau}\psi_i.\vec \rho^\mu\\ &-\frac{1}{4}F^{\mu\nu}F_{\mu\nu}-e\overline{\psi}_i\gamma^\mu(\frac{1-\tau_{3i}}{2})\psi_i A_\mu. \end{aligned} $

(1) The parameters
$ g_2 $ ,$ g_3 $ , and$ {{\rm e}^2}/{4\pi}$ are the coupling constants of the non-linear terms. The third component of the isospin is$ \tau_{3i} $ . M represents the mass of nucleons, whereas the masses of σ, ω, and ρ-mesons are$ m_\sigma $ ,$ m_\omega $ , and$ m_\rho $ , respectively, and the respective fields are$ \omega^{\mu} $ ,$ \vec \rho_\mu $ and$ A_\mu $ . It is worth noting that the contribution of the π-meson has been omitted in Eq. (1) in the calculation of the mean field as a result of its pseudo-scalar nature [39, 42]. A detailed description of the field tensors for$ \omega^{\mu} $ ,$ \vec \rho_\mu $ , and$ A_\mu $ fields can be found in Ref. [43] and the references therein. The field tensors are treated as classical fields; thus, the Dirac equation is obtained for the nucleons and simplified as$ \begin{equation} [-{\rm i}\alpha.\nabla+\beta(M^*+g_\sigma\sigma)+g_\omega\omega+g_\rho\tau_3\rho_3]\psi_i=\epsilon_i\psi_i.\\ \end{equation} $

(2) Similarly, the Klein-Gordon equations for the participating mesons are simplified as
$ \begin{aligned}[b] (-\nabla^2+m^2_\sigma)\sigma(r)=&-g_\sigma\rho_s(r)-g_2\sigma^2(r)-g_3\sigma^3(r),\\ (-\nabla^2+m^2_\omega)V(r)=&g_\omega\rho(r),\\ (-\nabla^2+m^2_\rho)\rho(r)=&g_\rho\rho_3(r). \end{aligned} $

(3) These equations are solved self consistently using the NL3
$ ^* $ parameter set. Within the limit of one-meson exchange for a heavy and static baryonic medium, the microscopic R3Y NN potential is obtained as$ \begin{aligned}[b] V_{\rm eff}^{\rm R3Y}(r)=&\frac{g^2_\omega}{4\pi}\frac{{\rm e}^{-m_\omega r}}{r}+\frac{g^2_\rho}{4\pi}\frac{{\rm e}^{-m_\rho r}}{r}-\frac{g^2_\sigma}{4\pi}\frac{{\rm e}^{-m_\sigma r}}{r}\\ &+\frac{g^2_2}{4\pi}r{\rm e}^{-2m_\sigma r} +\frac{g^2_3}{4\pi}\frac{{\rm e}^{-3m_\sigma r}}{r} +J_{00}(E)\delta(s), \end{aligned} $

(4) where
$ J_{00}(E)\delta(s) $ represents the pseudopotential of the zero range that denotes the exchange effect. Equation (4) is similar to the Reid-Elliott [32] phenomenological prescription called the M3Y NN potential, which is constructed to reproduce the element of the G matrix. The M3Y NN potential takes the form$ \begin{equation} V_{\rm eff}^{\rm M3Y}(r)=7999\frac{{\rm e}^{-4r}}{4r}-2134\frac{{\rm e}^{-2.5r}}{2.5r}+J_{00}(E)\delta(s). \end{equation} $

(5) The double folding technique [32] is employed to estimate the nuclear interaction potential
$ V_n(R) $ , which is expressed as$ \begin{equation} V_n(R)=\int {\rm d}r_c\int {\rm d}r_d \rho_c(\vec r_c)\rho_d(\vec r_d)V_{\rm eff}(\vec r_{cd}=\vec R+\vec r_d- \vec r_c), \end{equation} $

(6) where
$ \rho_c $ and$ \rho_d $ represent the nuclear matter densities of the cluster and daughter nuclei, respectively.$ V_n(R) $ given by Eq. (6) is combined with the Coulomb potential$V_C(R)=\dfrac{Z_{c}Z_d}{R}{\rm e}^2$ to obtain the total interaction potential$ \begin{equation} V(R)= V_n(R)+V_C(R) +V_\ell(R), \end{equation} $

(7) which is used to estimate the WKB penetration probability (as illustrated in Fig. 1) and therefore the half-lives of cluster decay using the preformed cluster decay model (PCM) [23]. Note that the contribution of the centrifugal potential
$ V_\ell(R)=\dfrac{\hbar^2\ell(\ell+1)}{2\mu R^2} $ (where$ \mu=m(A_cA_d/A) $ represents the reduced mass) is neglected in ground state-to-ground state transitions where the angular momentum is$ \ell=0 $ . The penetration probability of clusters across the tunneling path is given as
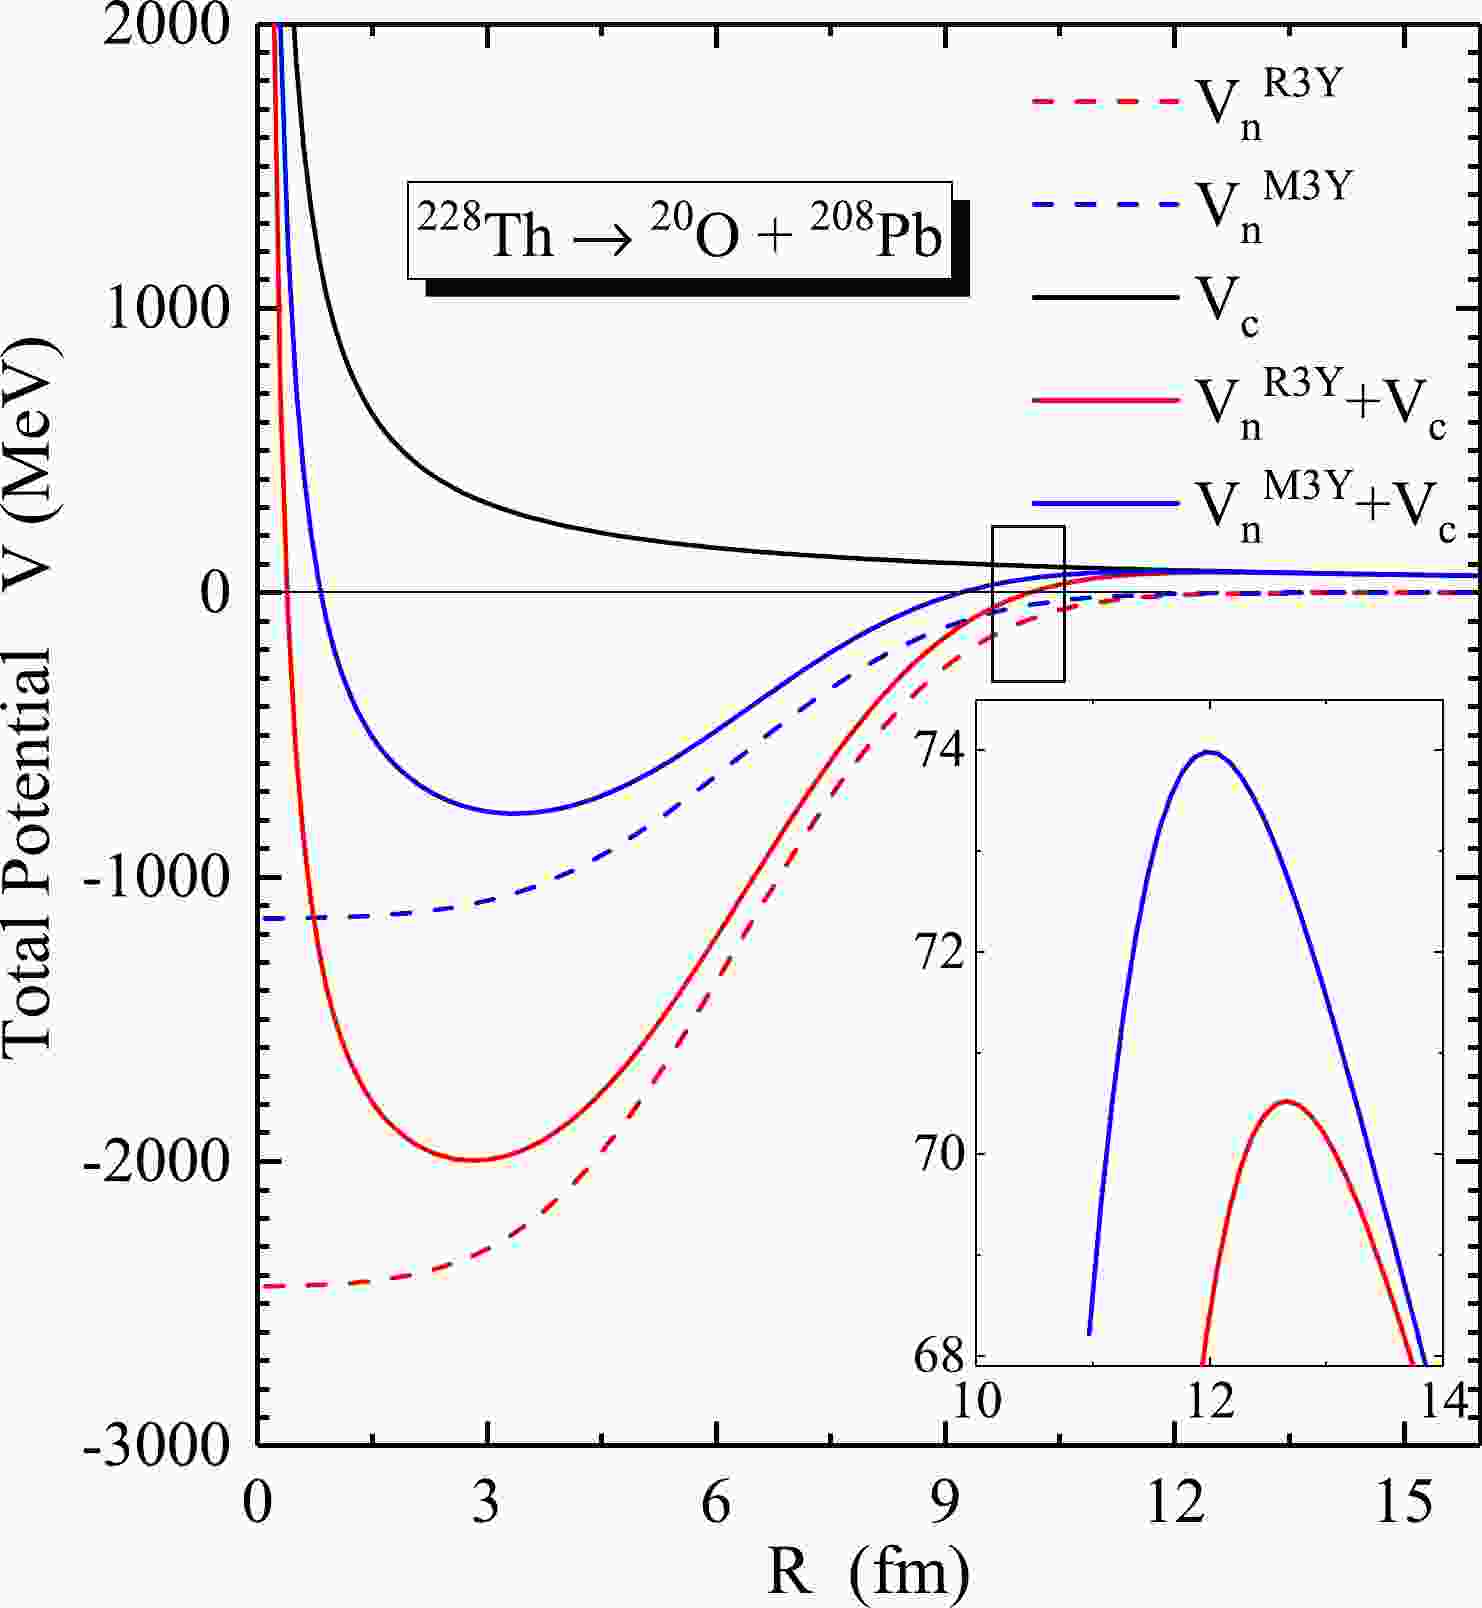
Figure 1. (color online) Schematic representation of the total nucleus-nucleus interaction potential V (MeV) and the respective contributions of the Coulomb and double-folded R3Y (NL
$ 3^* $ ) and M3Y nuclear potentials as a function of the radial separation R (fm) for a representative case of$ ^{228} $ Th$ \rightarrow ^{20} $ O +$ ^{208} $ Pb. The inset shows a magnified view of the barrier height and position.$ \begin{equation} P=P_aW_iP_b, \end{equation} $

(8) which involves a three-step process, as shown in Fig. 2. However,
$ W_i $ in Eq. (8) is estimated as unity, that is,$ W_i=1 $ , following the Greiner and Scheid de-excitation ansatz [44]. Thus,$ P=P_a P_b $ , where
Figure 2. (color online) Total interaction potential for the energetically favoured reaction
$ ^{228} $ Th$ \rightarrow ^{20} $ O +$ ^{208} $ Pb for both the M3Y and R3Y NN potentials, satisfying the criterion for cluster penetration$V(R_a) > Q_{\rm val}$ at ΔR = 1.0 fm (for relative comparison). The three-step penetration process of the interaction potential is also shown.$ \begin{eqnarray} P_a&=&\exp\left(-\frac{2}{\hbar}\int^{R_i}_{R_a}\{2\mu[V(R)-V(R_i)]\}^{1/2}{\rm d}R\right), \end{eqnarray} $

(9) and
$ P_b=\exp\left(-\frac{2}{\hbar}\int_{R_i}^{R_b}\{2\mu[V(R_i)-Q]\}^{1/2}{\rm d}R\right). $

(10) -
The decay half-life
$ T_{1/2} $ within the preformed cluster decay model (PCM) can be defined in terms of the decay constant λ, penetration probability P, and preformation probability$ P_0 $ with the expression$ \begin{equation} T_{1/2} =\frac{\ln2}{\lambda}, \quad \lambda= \nu_{0} P_0 P. \end{equation} $

(11) The assault frequency
$ \nu_0 $ has a nearly constant value of$ 10^{21} $ s$ ^{-1} $ and can be calculated as$ \begin{equation} \nu_{0}=\frac{\rm{ velocity }}{2R_0}=\frac{\sqrt{2E_{c}/\mu}}{2R_0}, \end{equation} $

(12) where
$ R_0 $ denotes the radius of the parent nucleus and$ E_{c} $ represents the kinetic energy of the emitted cluster. The$ Q $ -values are estimated from the ground state binding energies from the RMF, AME2016 [37], and WS3 [36] mass tables using the expression$ \begin{equation} Q=BE_d+BE_c-BE_p, \end{equation} $

(13) where
$ BE_p $ ,$ BE_d $ , and$ BE_c $ represent the binding energies of the parent and daughter nuclei and the emitted cluster, respectively.Instead of the primitive cluster-mass dependent preformation formula of Blendowske and Walliser [13], here, we have paid close attention to the relationships among various theoretically established properties/factors that influence cluster preformation, such as the cluster mass
$ A_c $ [45], the mass and charge asymmetries$ \eta_A=(A_d- A_c)/(A_d+A_c) $ and$ \eta_Z=(Z_d-Z_c)/(Z_d+Z_c) $ (because the emission of the same cluster from different parent nuclei as well as different clusters from the same parent nucleus is an experimentally observed fact [2, 4, 46]), the relative separation between the centres of the fragments$ r_B= 1.2(A_c^{1/3}+A_d^{1/3}) $ [5, 47], and the Q-value [48]. Therefore, we have proposed a new formula$ P_0 $ [18]:$ \begin{equation} \log P_0 = -\frac{aA_c\eta_A}{r_B}-Z_c\eta_Z+bQ+c, \end{equation} $

(14) where a, b, and c are the fitting parameters in Table 1. The precision measure is evaluated using the expression
$ \chi^2 $ .System Constant Parameters $ \chi^2 $ c

a b c M3Y R3Y e-e 11.98 0.037 3.56a 0.078 0.409 11.98 0.037 1.52b 0.060 0.130 o-A 16.12 0.119 4.02 0.071 0.109 a From our observation, all systems with $^{208}$ Pb daughters, which corresponds to the double magic shell closure, require a larger value of parameter c.

b The value of parameter c is smaller for systems with non-$^{208}$ Pb daughters.

c The$\chi^2$ values are very small because preference is given to experimentally measured cluster-decays yielding Pb-daughters only. Moreover, this validates the newly proposed Eq. (14).

Table 1. Fitting parameters a, b, and c for the preformation formula in Eq. (14) for known experimentally favoured cluster decays. The chi-squared (
$ \chi^2 $ ) for the half-life predictions of the M3Y and R3Y interactions are given in columns 5 and 6, respectively (see text for details). Note that odd-odd cluster emitters have not been experimentally observed.$ \begin{equation*} \chi^2=\sum\limits^{n}_{i=1} \frac{\left[\log_{10}^{\rm Expt.}T_{1/2}-\log_{10}^{\rm cal}T_{1/2}\right]^2}{\log_{10}^{\rm cal}T_{1/2}} \end{equation*} $

for 14 even-even nuclei and 5 odd-A nuclei, whose values are also given in Table 1. As explained in the
$ 3^{\rm rd} $ footnote of the table, it is worth mentioning that only the experimentally measured systems yielding Pb-daughters are preferentially considered in this fundamental study. Moreover, it is interesting to note that the third term on the right-hand side of Eq. (14) opens a new window to probe the contributions of the decay energy. In other words, the term$ bQ $ gives a quantitative description of energy contributed in cluster formation. Thus, for the first time, the Q-value is presented in terms of its usage/disbursement in the kinematics of cluster emission as$ \begin{eqnarray} Q=\overbrace{\underbrace{ bQ}_{\substack{\text{energy }\\ \text{contributed in}\\ \text{cluster formation}}}+\underbrace{\kappa\sqrt{Q}}_{\substack{\text{energy }\\ \text{contributed in}\\ \text{cluster emission}}}}^{E_c}+\underbrace{E_d}_{\substack{\text {recoil}\\ \text{energy of}\\ \text{daughter nucleus}}} \end{eqnarray} $

(15) where
$ \kappa\sqrt{Q} $ represents the energy contributed in cluster emission. Furthermore, following the work of Gupta et al. [45], the kinetic energy of the emitted cluster is expressed as$ \begin{eqnarray} E_c=\frac{A_d}{A}Q=bQ+\kappa\sqrt{Q}. \end{eqnarray} $

(16) Simplification yields
$ \begin{equation} \kappa=\sqrt{Q}\left(\frac{A_d}{A}-b\right). \end{equation} $

(17) The quantity κ in Eq. (17) refers to the tunneling factor. Detailed explanations and implications of the newly derived Eqs. (14)–(17) are typified, analysed, and discussed in the subsequent section.
-
The decay properties of
$ ^{14} $ C,$ ^{18,20} $ O,$ ^{23} $ F,$ ^{22-26} $ Ne,$ ^{28-30} $ Mg, and$ ^{34} $ Si clusters emitted from various heavy nuclei lead to the formation of daughters of Pb isotopes. The effect of double-shell closure in terms of the$ ^{208} $ Pb daughter is analysed using the theoretical formalism discussed in the previous section. The relativistic mean-field theory (RMF) is employed here, being an efficient tool to reproduce the ground state properties of the decaying parent nuclei. The RMF-based R3Y (NL$ 3^* $ ) and the phenomenological M3Y NN interactions are folded with their respective RMF densities to deduce the nuclear interaction potential. As a representative case, Fig. 1 illustrates the individual contributions of the nuclear and Coulomb potentials, which collectively form the total interaction potential$ V (=V_c+V_n) $ for$ ^{228} $ Th$ \rightarrow ^{20} $ O +$ ^{208} $ Pb for the cases of R3Y (NL$ 3^* $ ) and M3Y interactions. -
From Fig. 1, it is observed that the total interaction potential V and nuclear potential
$ V_n (R) $ display similar characteristics for both R3Y and M3Y NN potentials. However, the difference lies in their qualitative description, which is apparent in the central region [38, 49] but decreases proportionately with the radial separation R. Moreover, the R3Y and M3Y NN interactions are characterized by different barrier properties; hence, the barrier height of the R3Y can be relatively low (approximately 3.6 MeV), which is more attractive, as shown in the inset.The cluster penetration process for the energetically favoured reactions, taking
$ ^{228} $ Th$ \rightarrow ^{20} $ O +$ ^{208} $ Pb as a representative case, is shown in Fig. 2. The three-step procedure involved is initiated by barrier penetration at the first turning point$ R_a $ up to the point$ R_i $ and followed by a de-excitation (given in the excitation model of Greiner and Scheid [44] for heavy cluster emissions as$ W_i = 1 $ ) from$ V(R_i) $ ; thereafter, the cluster penetrates from$ R_i $ to point$ R_b $ such that$V(R_b)=Q_{\rm val}$ . It is imperative to note that this process is significantly influenced by the decay energy Q-value, which must be positive. Although this description is not altogether new, the contribution of the Q-value to the energy contributed during cluster preformation (captured by the proposed preformation formula) is separately estimated/analyzed for the first time. The figure further stresses the disparity in the barrier properties of the M3Y and R3Y NN potential, as mentioned previously. Here, for relative comparison, the neck-length parameter is kept at ΔR = 1.0 fm for both NN potentials. Consequently, there is a significant difference between their respective barrier peak/height$ V_B $ and its derivatives, such as the barrier lowering parameter$ \Delta V_B $ and the driving potential$V(R_a)-Q_{\rm val}$ .The barrier lowering parameter
$ \Delta V_B $ is an inherent feature of the pre-formed cluster decay model (PCM) that encapsulates various modifications in the barrier region, especially those caused by the neck length values [50]. Figure 3 illustrates the profile of$ \Delta V_B $ with respect to the neutron number N of the$ ^{230,232,233,235} $ U isotopes at different values of the neck length parameter ΔR that lie within the proximity potential limit [51–53]. Considering the predictions from the M3Y (open symbols) and R3Y (solid symbols) potentials separately, it is clear that the barrier lowering parameter is largely influenced by the neck configuration; therefore, its modification increases with ΔR. Thus,$ \Delta V_B $ dictates the tunnel tunneling path of the cluster, and it is usually negative, because the penetration point is always below$ V_B $ .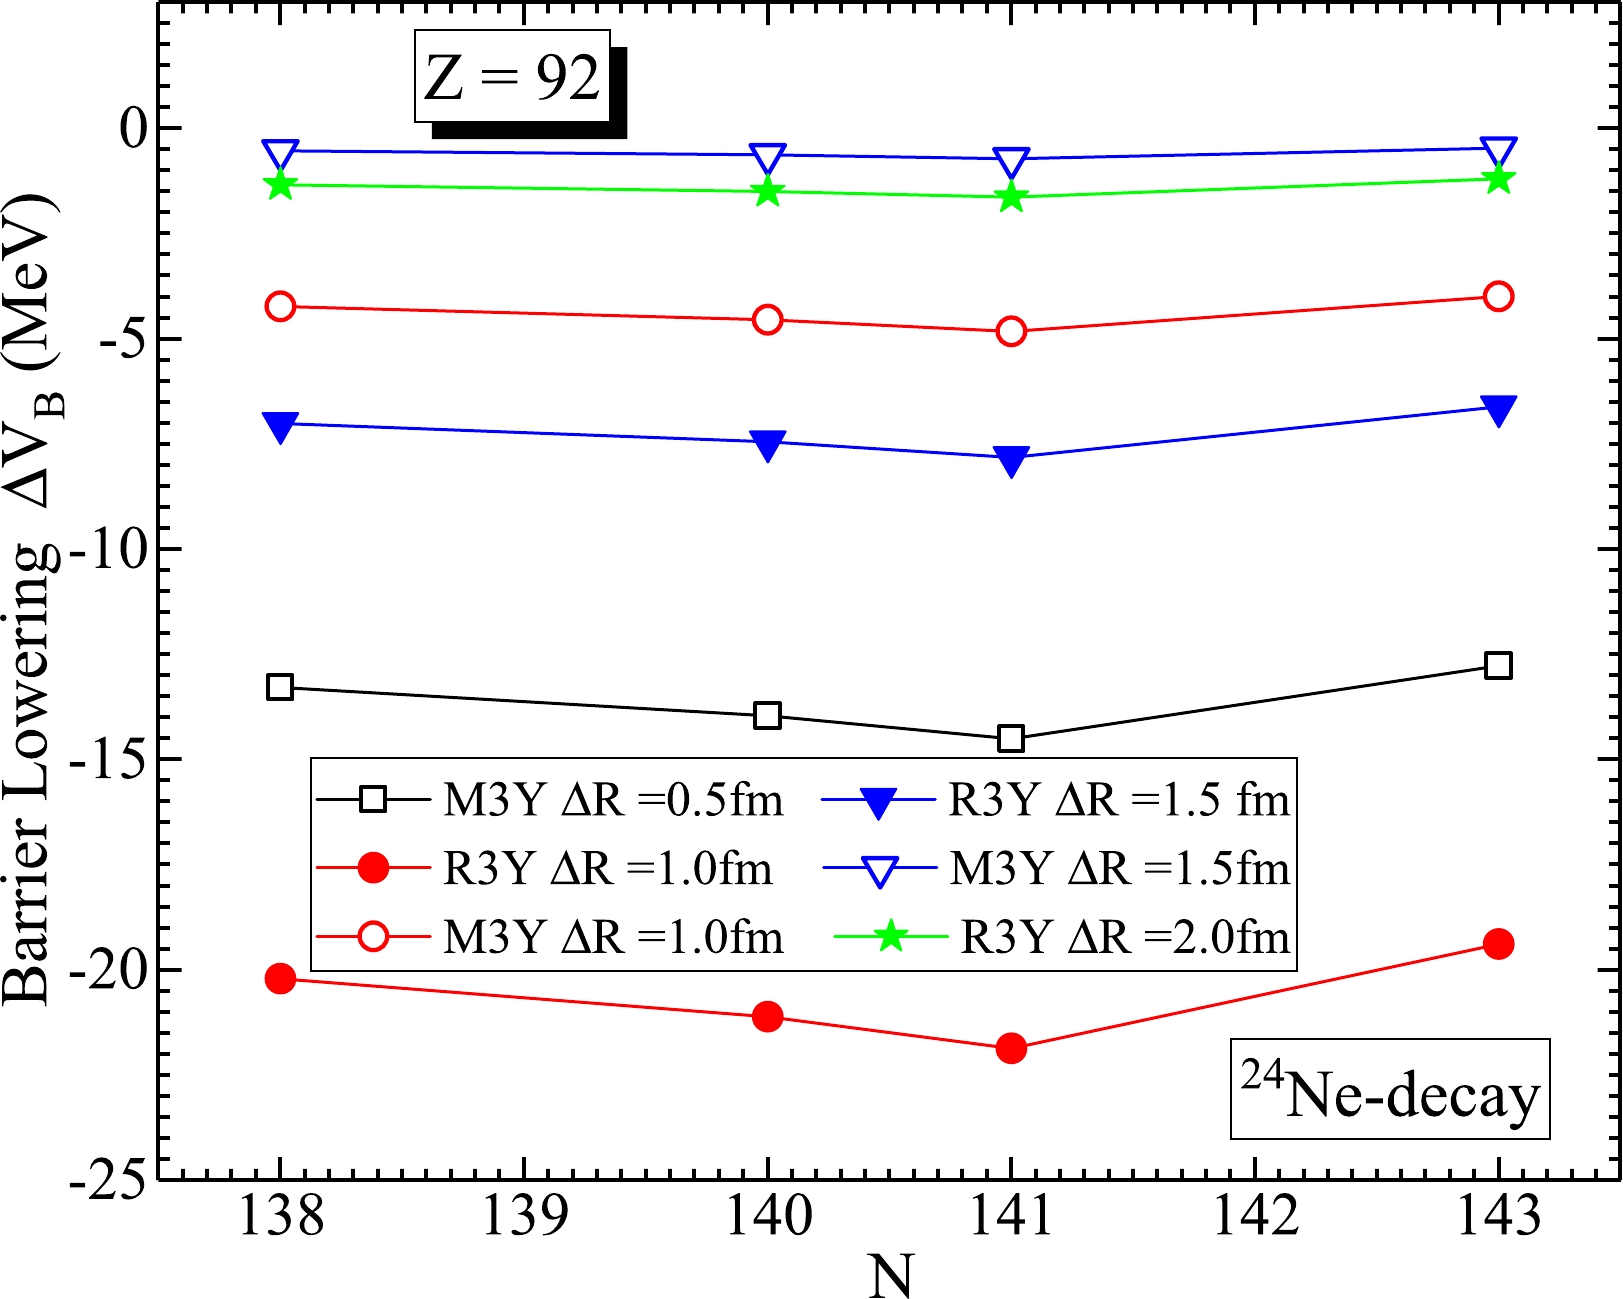
Figure 3. (color online) Barrier lowering parameter
$ \Delta V_B $ (MeV) of$ ^{24} $ Ne emission of$ ^{230,232,233,235} $ U isotopes at different values of the neck-length parameter ΔR.Similarly, the difference between the interaction potential and the energy available for the cluster decay process is referred to as the driving potential
$V_d (= V(R_a)-Q_{\rm AME}$ ). Figure 4 shows the variation of$V_d $ as a function of the neutron number of$^{230,232,233,235} $ U isotopes at different neck-lengths ($\Delta$ R). It is worth mentioning that the Q-value ($Q_{\rm AME}$ ) used here is calculated from the experimental binding energy data [37] only for the sake of accuracy. In several studies, the minima in$ V_d $ were used to indicate the most probable decay channels; here, variations are made in order to decide on the most appropriate neck length, especially for the recently developed R3Y interaction. We have previously demonstrated that ΔR = 0.5 fm [23, 54] is suitable for the M3Y interaction in cluster decay studies. However, this ΔR value is not energetically favorable in the case of R3Y, owing to its unique barrier charactertistics (see Refs. [55–57] for details on the predictability range of both R3Y and M3Y interactions). Despite the change in ΔR, a regular pattern is maintained in the driving potential profile for both interactions. Other than these variations, ΔR is fixed at 1.0 fm for R3Y in the remaining part of this paper for the sake of comparison.
Figure 4. (color online) Driving potential
$V(R_a)-Q_{\rm AME}$ (MeV) of$ ^{24} $ Ne emission as a function of the neutron number of$ ^{230,232,233,235} $ U isotopes at different neck-lengths (ΔR). -
A careful inspection of the
$ 4^{\rm th} $ column of Table 1 and its footnote shows that the constant parameter 'c' (see Eq. (14)) is highly susceptible to the shell and/or sub-shell effect and thus is higher for all the systems having$ ^{208} $ Pb-daughter shell closure. In other words, 'c' can be used to indicate the signature of shell and/or sub-shell closure over an isotopic chain. The shell effect is shown in the last column of Table 2, where the same group of different isotopes of the particular nucleus is characterized by a unique Q-value and recoil energy. In such cases, the recoil energy of the daughters for double magic$ ^{208}{\rm Pb} $ is higher than those of the neighboring isotopes. Furthermore, Fig. 5 (upper panel) shows the variation of the recoil energy of the daughter nuclei w.r.t. the corresponding neutron number$ N_d $ for different Q-values calculated from the RMF and$Q_{\rm RMF}$ (dashed line with blue star), in comparison with the binding energies of Wang et al. [37] denoted as$Q_{\rm AME}$ (solid line with black square), as well as the WS3 given by Liu et al. [36] denoted as$Q_{\rm WS3}$ (dotted line with red circle). The profile shows a regular pattern for the three sets of Q-values, which directly influences their magnitude. However, in all cases, the peaks are observed for the magic and/or close shell neutron number$ N=126 $ .Parent
nucleiCluster
clusterDaughter
nuclei$Q_{\rm AME}$ 

/MeV$ \log_{10}T_{1/2} $ 

$ P_0 $ 

Eq. (14)bQ
/MeVκ $ \kappa\sqrt{Q} $ 

/MeVEc
/MeVEd
/MeVExpt. M3Y R3Y $ ^{221} $ Ra

$ ^{14} $ C

$ ^{207} $ Pb

32.40 13.39 13.95 14.22 $ 9.19\times10^{-18} $ 

3.86 4.65 26.49 30.34 2.05 $ ^{222} $ Ra

$ ^{14} $ C

$ ^{208} $ Pb

33.05 11.01 11.12 11.94 $ 8.82\times10^{-16} $ 

1.22 5.17 29.74 30.96 2.08 $ ^{223} $ Ra

$ ^{14} $ C

$ ^{209} $ Pb

31.83 15.06 14.71 15.40 $ 8.22\times10^{-18} $ 

3.79 4.62 26.04 29.83 2.00 $ ^{224} $ Ra

$ ^{14} $ C

$ ^{210} $ Pb

30.53 15.86 16.58 17.10 $ 6.71\times10^{-18} $ 

1.13 4.98 27.50 28.63 1.91 $ ^{226} $ Ra

$ ^{14} $ C

$ ^{212} $ Pb

28.20 21.19 20.31 20.60 $ 5.68\times10^{-18} $ 

1.04 4.78 25.41 26.45 1.75 $ ^{226} $ Th

$ ^{18} $ O

$ ^{208} $ Pb

45.73 $ > 15.30 $ 

17.31 17.63 $ 9.84\times10^{-20} $ 

1.69 5.97 40.39 42.09 3.64 $ ^{228} $ Th

$ ^{20} $ O

$ ^{208} $ Pb

44.72 20.72 20.54 22.28 $ 3.78\times10^{-21} $ 

1.65 5.85 39.15 40.80 3.92 $ ^{230} $ U

$ ^{22} $ Ne

$ ^{208} $ Pb

61.39 19.57 19.91 19.48 $ 4.46\times10^{-23} $ 

2.27 6.80 53.25 55.52 5.87 $ ^{231} $ Pa

$ ^{23} $ F

$ ^{208} $ Pb

51.89 26.02 25.67 25.34 $ 5.65\times10^{-26} $ 

6.17 5.63 40.55 46.72 5.17 $ ^{230} $ U

$ ^{24} $ Ne

$ ^{206} $ Pb

61.35 $ > 18.20 $ 

23.68 23.18 $ 2.47\times10^{-26} $ 

2.27 6.73 52.68 54.95 6.40 $ ^{232} $ U

$ ^{24} $ Ne

$ ^{208} $ Pb

62.31 21.08 20.58 20.94 $ 2.92\times10^{-24} $ 

2.31 6.79 53.56 55.86 6.45 $ ^{233} $ U

$ ^{24} $ Ne

$ ^{209} $ Pb

60.49 24.84 24.39 24.55 $ 2.30\times10^{-26} $ 

7.20 6.05 47.06 54.26 6.23 $ ^{234} $ U

$ ^{24} $ Ne

$ ^{210} $ Pb

58.83 25.92 26.11 26.11 $ 1.97\times10^{-26} $ 

2.18 6.60 50.62 52.79 6.03 $ ^{235} $ U

$ ^{24} $ Ne

$ ^{211} $ Pb

57.36 27.62 28.29 26.44 $ 1.06\times10^{-26} $ 

6.85 5.90 44.65 51.51 5.86 $ ^{234} $ U

$ ^{26} $ Ne

$ ^{208} $ Pb

59.41 25.92 25.02 26.61 $ 1.63\times10^{-25} $ 

2.20 6.57 50.61 52.81 6.60 $ ^{236} $ U

$ ^{26} $ Ne

$ ^{210} $ Pb

56.69 $ > 25.9 $ 

30.10 31.66 $ 1.16\times10^{-27} $ 

2.10 6.42 48.35 50.45 6.25 $ ^{236} $ Pu

$ ^{28} $ Mg

$ ^{208} $ Pb

79.67 21.67 21.48 21.40 $ 5.99\times10^{-27} $ 

2.95 7.54 67.27 70.22 9.45 $ ^{238} $ Pu

$ ^{30} $ Mg

$ ^{208} $ Pb

76.80 25.70 25.10 25.18 $ 4.59\times10^{-28} $ 

2.84 7.33 64.27 67.12 9.68 $ ^{242} $ Cm

$ ^{34} $ Si

$ ^{208} $ Pb

96.51 23.24 23.70 25.46 $ 3.80\times10^{-30} $ 

3.57 8.08 79.38 82.95 13.56 Table 2. Decay half-lives and preformation analysis of various experimentally observed clusters [4] forming different Pb-daughters. The Q-values are calculated using the binding energies from experimental data
$(Q_{\rm AME})$ [37]. Columns (8)–(13) are exclusively devoted to the cluster preformation and emission details from the proposed Eqs. (14)–(17).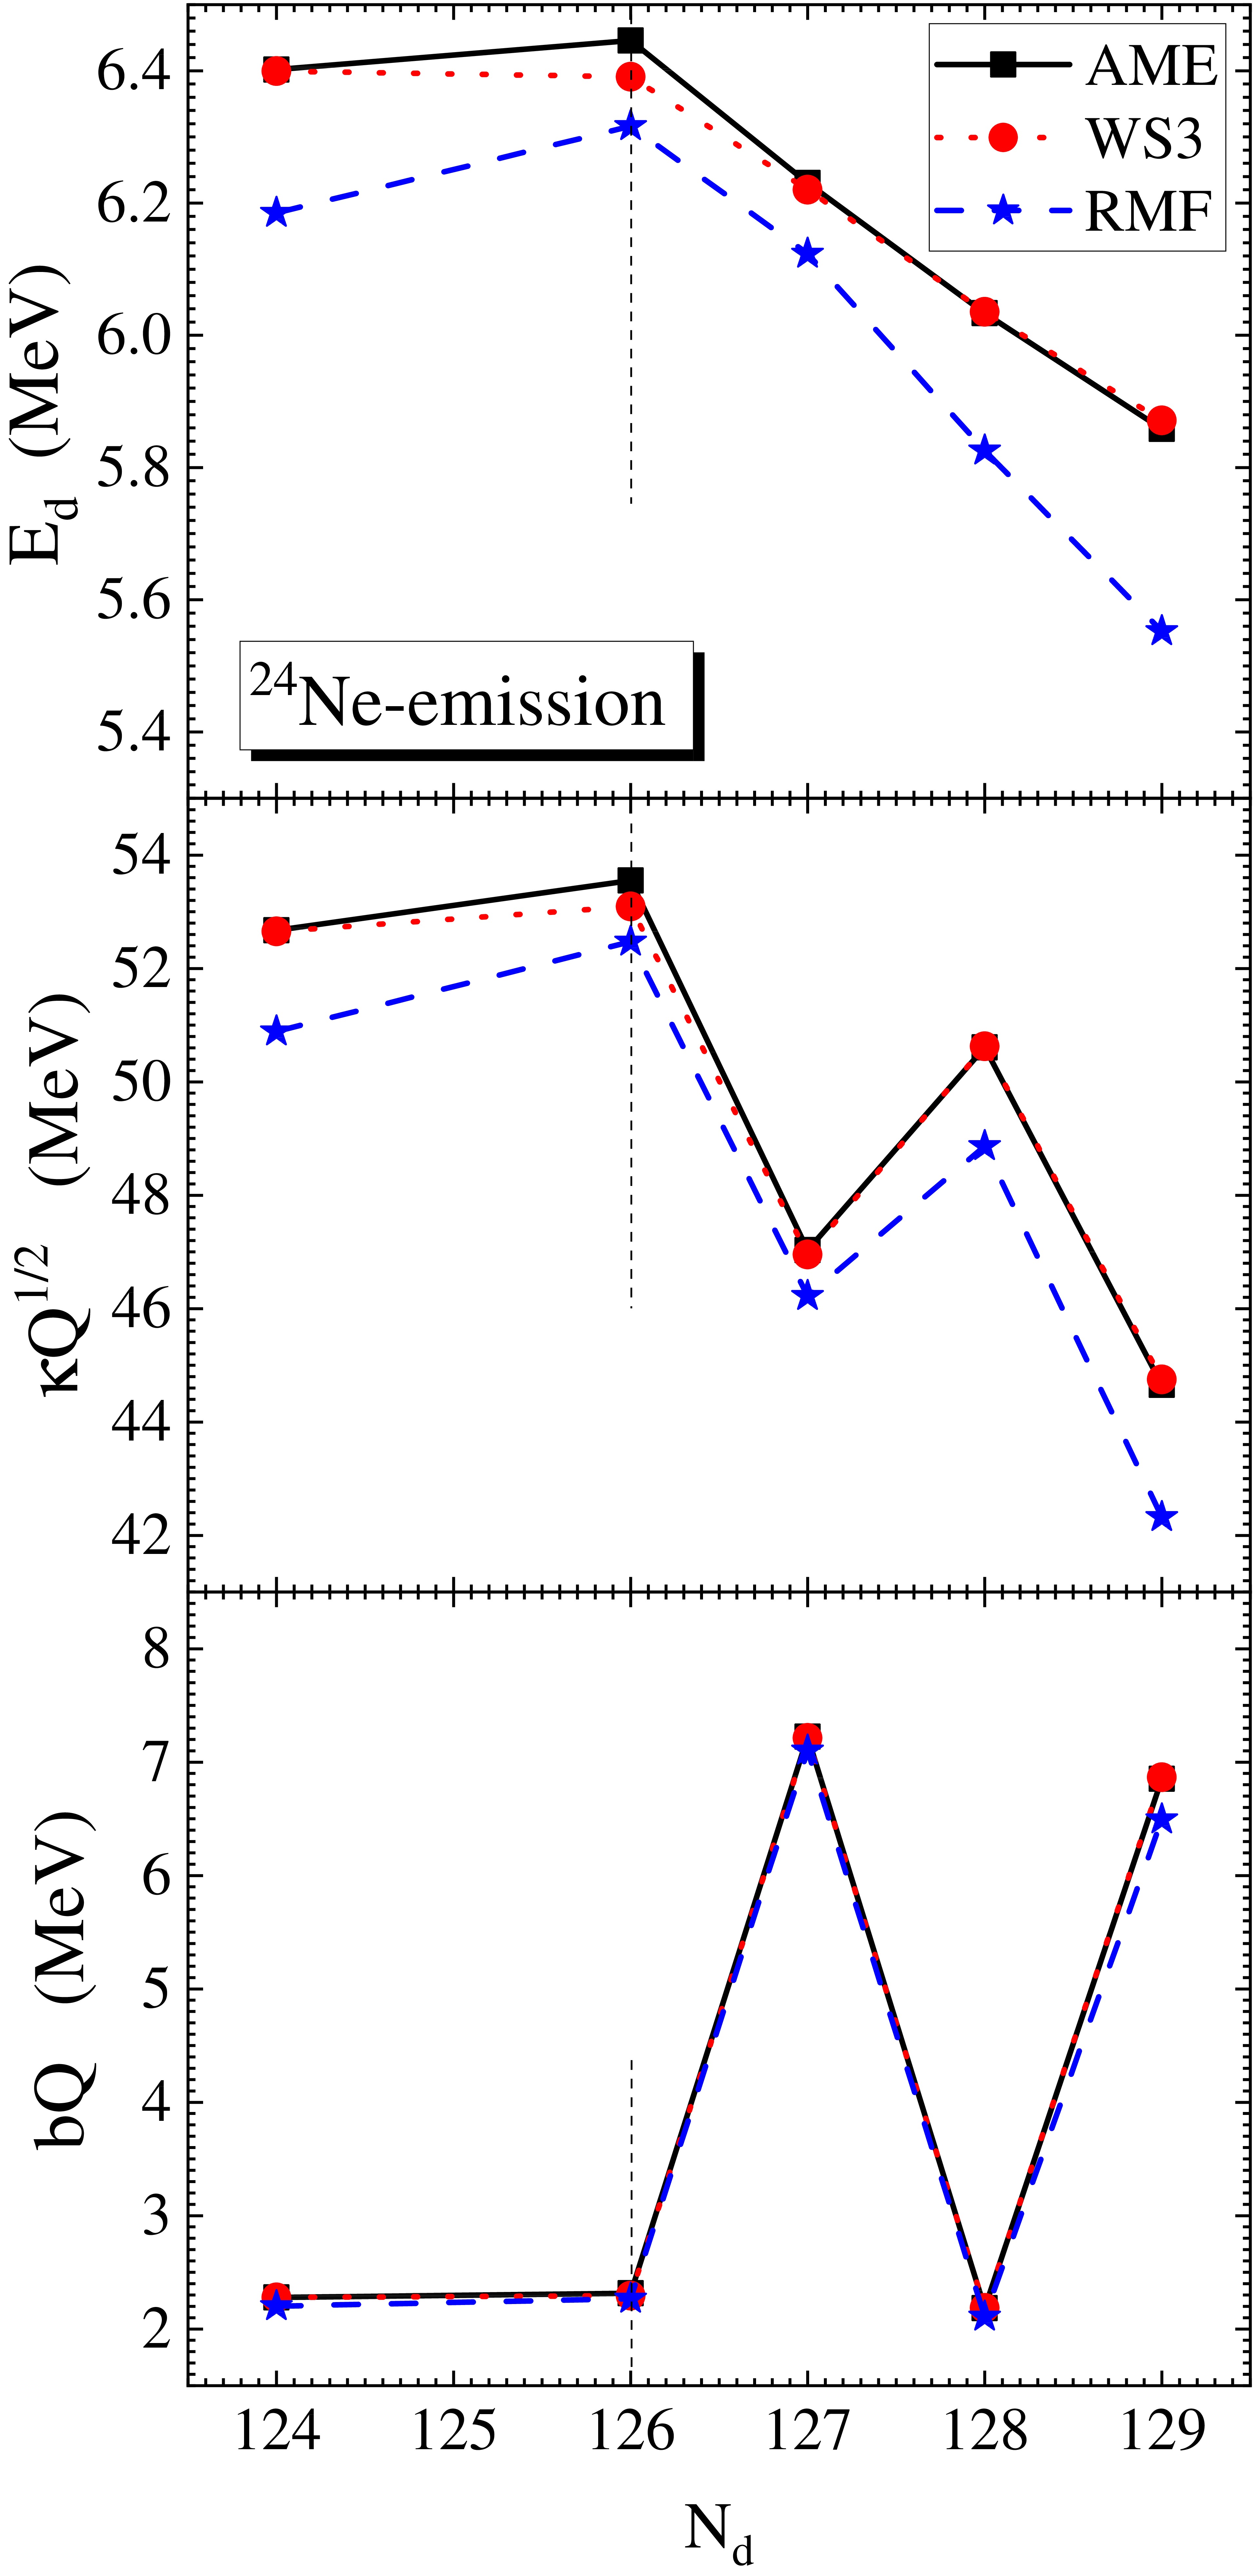
Figure 5. (color online) Variation of preformation properties: (a) recoil energy of the daughter nuclei, (b) cluster emission energy, and (c) weighted
$Q$ -values of various radium and uranium isotopes as a function of the neutron number of the daughters formed from$^{A}{\rm U}\rightarrow ^{24}{\rm Ne}+^{A-24}{\rm Pb}$ .Classically, the recoil energy of the daughter nuclei (
$ E_d $ ) can be correlated with the mass of the parent nuclei and the cluster in the outgoing channel. Here, we introduce a simple and intuitive system that governs the quantitative estimate of the recoil energy of the daughter nuclei (last column of Table 2) based on three distinct possibilities:First, we consider a case in which the same cluster is emitted from different parent nuclei. From these systems, one can observe that the heavier parent produces a lower recoil energy, provided that the daughters formed are not magic nuclei. For example, from the table, the reaction systems
$ ^{223} $ Ra$ \rightarrow ^{14} $ C+$ ^{209} $ Pb and$ ^{224} $ Ra$ \rightarrow ^{14} $ C+$ ^{210} $ Pb yield$ E_d $ = 2.00 and 1.91 MeV, respectively. This observation is found to be consistent, provided$ A_d $ is not a shell and/or subshell closure. Second, we consider emission of different clusters from the same parent nucleus. It is observed that massive clusters produce a relatively high recoil energy. For example, the reaction systems$ ^{234}{\rm U}\rightarrow $ $ ^{24} $ Ne+$ ^{210} $ Pb and$ ^{236} $ U$ \rightarrow ^{26} $ Ne+$ ^{210} $ Pb are associated with$ E_d $ = 6.03 and 6.25 MeV, respectively. Third, we consider the emission of the same cluster from different parent nuclei in which at least one of the daughters formed is a magic nucleus. We notice that the heavier parent can produce a higher or equal recoil energy. For example, the reaction systems$ ^{221} $ Ra$ \rightarrow ^{14} $ C+$ ^{207} $ Pb and$ ^{222}{\rm Ra} \rightarrow$ $ ^{14} $ C+$ ^{208} $ Pb yield$ E_d $ = 2.05 and 2.08 MeV, respectively. A similar finding is observed for the reaction systems$ ^{230} $ U$ \rightarrow ^{24} $ Ne+$ ^{206} $ Pb and$ ^{232} $ U$ \rightarrow ^{24} $ Ne+$ ^{208} $ Pb with$ E_d $ = 6.40 and 6.45 MeV, respectively. -
The dominance of the shell effect on the cluster emission energy
$ \kappa\sqrt{Q} $ is hinged on the formation of the double magic$ ^{208} $ Pb daughter nucleus in which the highest peak (at$ N = 126 $ ) is formed, as shown in Fig. 5(a). However, the usual peak at$ N = 128 $ is mainly attributed to the lower value of the parameter 'c' in Table 2, indicating the formation of non-double magic daughter nuclei. Thus, because the shell effect is weaker in such cases, the corresponding energy for the cluster tunneling process is amply increased. On this account, we define κ as the precise quantity/fractional amount of energy required to liberate a preformed cluster through the potential barrier. In other words, κ is the specific amount of energy with which the preformed cluster tunnels across the Coulomb-nuclear interaction barrier. Hence, κ can be termed as the tunneling factor. From Eq. (17), it is evident that κ is largely dependent on the mass of the parent and daughter nuclei and hence the emitted cluster. -
We reiterate that the weighted Q-value '
$ bQ $ ' is the share of the decay energy contributed during the cluster preformation process. The third panel of Fig. 5 depicts the weighted Q-value of$ ^{24} $ Ne cluster emission from even-even$ ^{230,232,234} $ U and even-odd$ ^{233,235} $ U isotopes as a function of the neutron number of their respective daughter nucleus. By composition,$ bQ $ can only be influenced by the Q-value and the parameter b. The predictions from the Q-values estimated using the experimental binding energies and those from the WS3 mass table have relatively good agreement with the RMF-deduced Q-values. For example, the difference in$Q_{\rm AME}$ and$Q_{\rm WS3}$ ranges between 0.1 and 0.5 MeV, whereas the$ Q_{\rm RMF} $ has a difference of approximately 1.0–3.0 MeV. However, despite the variation of the Q-values, the behaviors of the even(Z)-even(N) systems differ from those of the even(Z)-odd(N) systems. In other words, Fig. 5(c) shows that all the even-even systems have lower$ bQ $ values and follow the same trend, in contrast to the even-odd systems, which are marked with higher values. As such, it is apparent that the parameter b captures the odd-even staggering effect, as the presence of unpaired protons or neutrons in the open-shell radioactive cluster emitters is uniquely associated with higher b values (at$ N=127 $ and$ N=129 $ ) and thus influences the preformation probability. This fully agrees with the systematic study in Ref. [58]. The pairing effect for open-shell nuclei and the odd-even staggering effects, as well as their connection with the single-particle energies and orbital filling, were extensively discussed in Refs. [59–62]. Therefore, it is evident that careful determination of$ P_0 $ provides ample information about the nuclear structure and the kinematics of cluster emission. Using Eq. (14), a detailed calculation of the cluster preformation is carried out for heavy nuclei decaying to the double-shell closure$ ^{208} $ Pb-daughters and its neighbors. Thus, the credibility of the estimated$ P_0 $ is illustrated and discussed graphically. Because the preformation probability is not a direct experimentally observed quantity, one relies on the theoretical models for its deduction. -
Figure 6 (upper panels (a) and (b)) displays the calculated preformation probabilities of
$ ^{14} $ C and$ ^{24} $ Ne clusters from Ra and U isotopic chains, respectively, as a function of the neutron number of the corresponding Pb-daughter nuclei formed. From the figure, it is apparent that cluster preformation in heavy nuclei is usually accompanied by the appearance of a notable dip at$ N=126 $ . This agrees with the statistical analysis of Bonetti et al. [63] and Hodgson et al. [64] and with the theoretical findings in Refs. [65, 66] for α-particle preformation. The figure further indicates that the$ P_0 $ cannot maintain a constant magnitude for different nuclei, in contrast to the conjecture in Refs. [67, 68]. Thus, in both figures, the$ -\log P_0 $ values for similar cluster emissions from different isotopes of an element have a clear distinction. Taking the inverse of the$ -\log P_0 $ values in Figs. 6(a) and (b), the$ P_0 $ values fall in the range$ 0<P_0<1 $ . Hence, the treatment of$ P_0 $ as unity relegates the exclusive properties of the participating nuclei. A detailed inspection of both figures (and column 8 of Table 2) for$^{A}{\rm Ra}\rightarrow ^{14}{\rm C}+^{A-14}{\rm Pb}$ and$^{A}{\rm U}\rightarrow ^{24}{\rm Ne}+^{A-24}{\rm Pb}$ reveals that the cluster preformation probability$ P_0 $ at the double magic shell closure of the$ ^{208} $ Pb daughter is higher than those of its neighboring daughter nuclei with the order of approximately$ 10^2 $ and exhibits relatively short half-lives. This reflects the stability of the parents$ ^{222} $ Ra and$ ^{232} $ U against decays of the$ ^{14} $ C and$ ^{24} $ Ne clusters, respectively.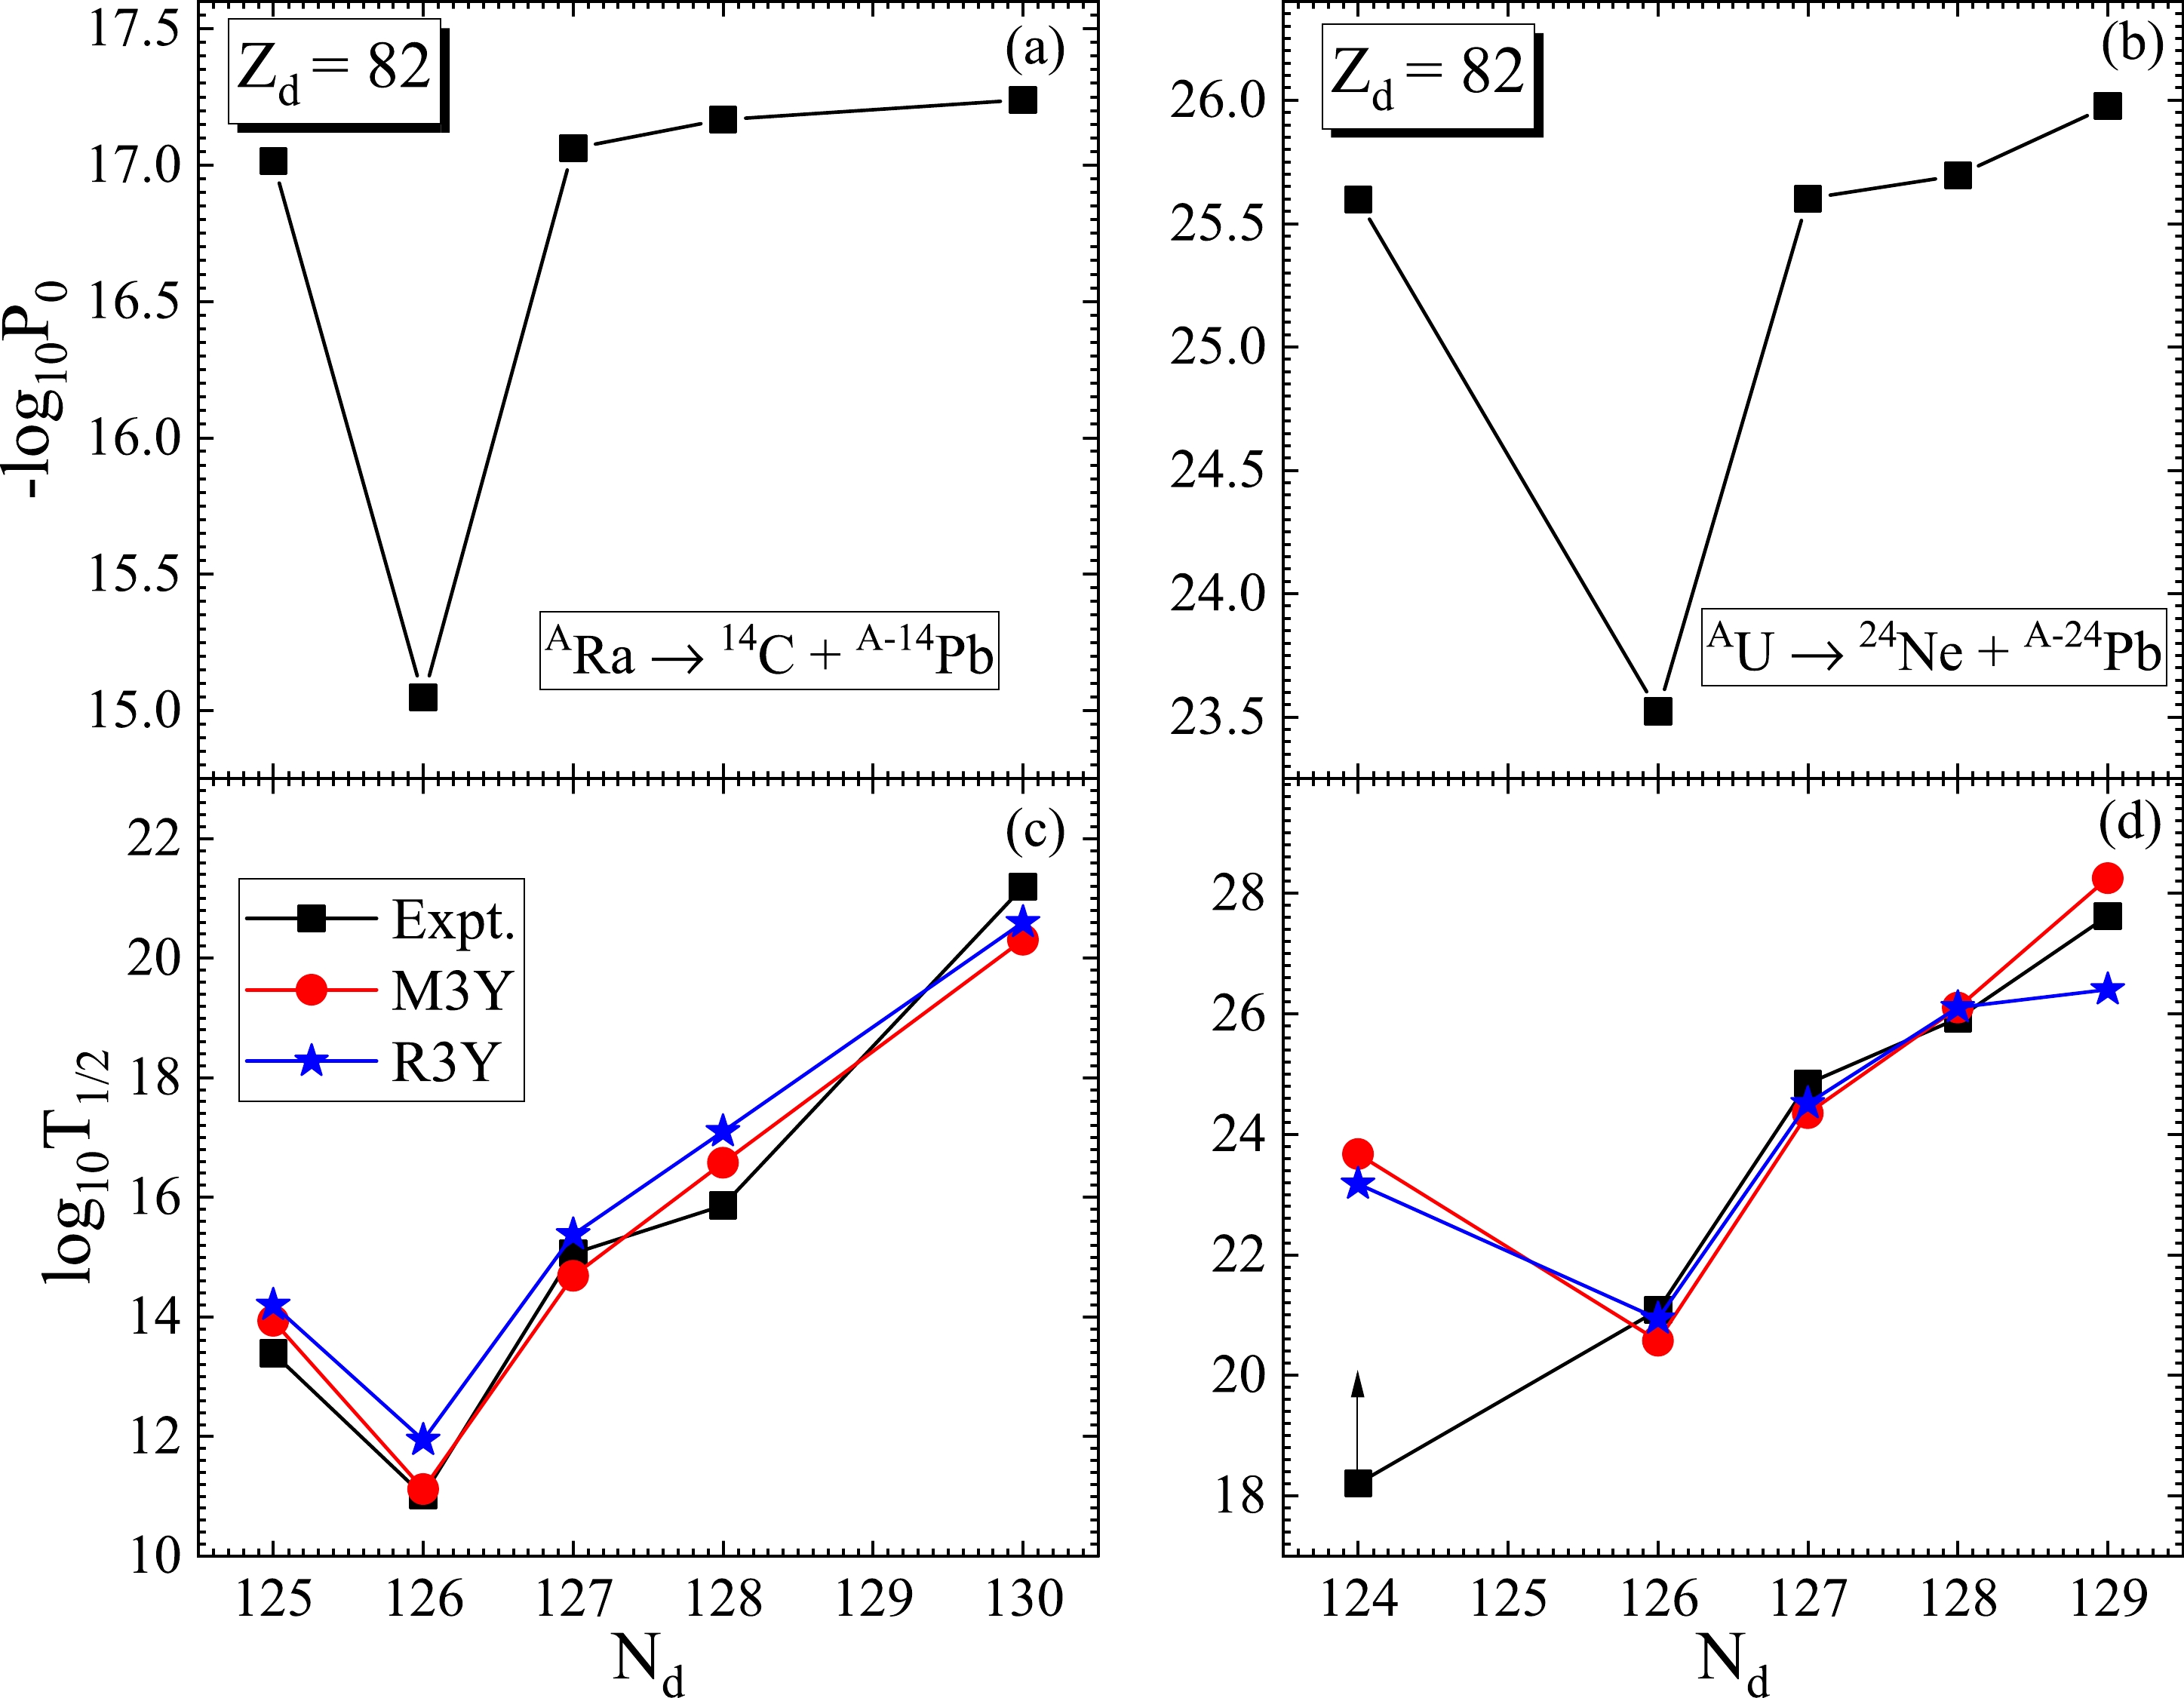
Figure 6. (color online) Variation of the preformation probability
$ P_0 $ and logarithmic half-lives$ \log_{10}T_{1/2} $ with$Q_{\rm AME}$ [37] only for$^{A}{\rm Ra}\rightarrow ^{14}{\rm C}+^{A-14}{\rm Pb}$ and$^{A}{\rm U}\rightarrow ^{24}{\rm Ne}+^{A-24}{\rm Pb}$ .Similarly, the half-lives theoretically determined using the M3Y and R3Y potentials are compared with the experimental data. As representative cases, Figs. 6(c) and (d) show the variation of the logarithmic half-lives
$ \log_{10} T_{1/2} $ for$ ^{14} $ C and$ ^{24} $ Ne cluster decay from Ra and U isotopes, respectively, as a function of the neutron number of the daughter ($ N_d $ ). In both instances, the minima in$ \log_{10} T_{1/2} $ are identified with the decay leading to the double magic daughter$ ^{208} $ Pb ($ Z_d=82 $ and$ N_d=126 $ ). In other words, the shell stabilises at magic daughter nuclei. This implies that the stability of the cluster emitters can be explained by the shell closure effect. Additionally, the half-lives of cluster emitters appear to increase w.r.t. the magnitude of the neutron number of the daughter nuclei formed until a magic number (or its neighbor) is attained. The M3Y and R3Y predictions are found to be consistent with the experimentally observed half-lives for all the systems under study. However, the cluster decay half-lives of certain systems (such as for$ N_d=124 $ in Fig. 6(d)) lack precise experimental measurement, for which only the lower limits were given (marked with an upward arrow). In that vein, the prediction of M3Y and R3Y agrees with the experimental lower limit and can be considered to be more probable from the theoretical point of view (as the deepest minima are usually associated with the double magic number$ N_d=126 $ ). The slight difference in the estimation of the M3Y and R3Y NN potentials reflects the uniqueness of their barrier characteristics. -
The proposed new preformation probability
$ P_0 $ formula captures several known theoretically established factors (such as the cluster mass$ A_c $ , mass and charge asymmetry ($ \eta_A $ and$ \eta_Z $ ), and Q-value) affecting the mechanism and kinematics of the cluster emissions. Additionally, for the first time, an expression for the contribution of the decay energy in terms of the cluster preformation, emission, and recoil energy is applied in the cluster radioactivity. Furthermore, we present a new set of criteria for estimating the recoil energy of daughter nuclei in the cluster radioactivity. Using the relativistic mean-field (RMF) approach, the cluster decay half-lives of various nuclei decaying to (or around)$ ^{208} $ Pb-daughters are calculated within the preformed cluster decay model (PCM). As a result, the stability of the cluster emitters is closely linked with the pairing and shell closure effect. Although the barrier properties of the phenomenological M3Y and microscopic R3Y NN potentials differ qualitatively, their respective predictions are found to agree relatively well with the experimentally measured half-lives. To gain comprehensive insight into the cluster decay dynamics, it is of future interest to systematically investigate the preformation properties and half-lives of systems yielding non-Pb daughters along with various proximity potentials with deformation and orientation effects. This study can also be extended to predict cluster radioactivity in the unknown territories of the superheavy mass region. The deformation of the decaying nucleus and/or the decay fragments is known to also play a significant role in cluster decays. However, this effect could be less significant at the point of cluster formation but more prominent at the scission point. The full-fledged calculation of the shape degree of freedom from the saddle-to-scission point will be considered in our future study.
Preformation probability and kinematics of cluster emission yielding Pb-daughters
- Received Date: 2023-12-23
- Available Online: 2023-07-15
Abstract: In the present study, the newly established preformation formula is applied for the first time to study the kinematics of the cluster emission from various radioactive nuclei, especially those that decay to the double shell closure


 DownLoad: