-
The atomic nucleus is a microscopic quantum many-body system, and its shape provides an intuitive understanding of nuclear spatial density distributions. Stable quadrupole-deformed nuclear shapes have been known to exist in the intrinsic frame for a long time [1]. With reflection symmetry breaking, some nuclei appear to have octupole deformation in the intrinsic frame, such as a pear shape [2]. The study of the pear-shaped nuclei has been linked to the frontiers of particle physics, nuclear physics, and atomic physics, since it provides a distinctive probe to test the charge-parity (CP) violation beyond the Standard Model [3].
The odd-mass octupole-deformed nuclei have attracted special interest as they have enhanced nuclear Schiff moments owing to the presence of the large octupole collectivity and nearly degenerate parity doublets [4]. The best candidates of such nuclei have been found in the light-actinide region, such as
$ ^{223} {\rm{Th}}$ [5] and$ ^{225} {\rm{Ra}}$ [6]. For a lighter mass region with$ A\sim $ 150, continuous efforts have also been devoted owing to its octupole double-magic character with proton and neutron numbers$ Z\sim56 $ and$ N\sim88 $ [2]. Indeed, the Coulomb excitation experiments of the octupole double-magic nucleus$ ^{144} {\rm{Ba}}$ and its neighbor$ ^{146} {\rm{Ba}}$ yield enhanced$ E3 $ matrix elements and provide direct evidence of octupole deformation [7, 8]. A further experimental study on level structures shows the coexistence of reflection asymmetric and symmetric shapes in the neutron-rich nucleus$ ^{144} {\rm{Ba}}$ [9]. For odd-mass nuclei in this mass region, although no direct experimental evidence of octupole deformation was found, the characteristics of octupole collectivity such as parity doublet bands have been systematically observed in nuclei such as$ ^{143,145} {\rm{Ba}}$ [10, 11],$ ^{145,147} {\rm{La}}$ [12, 13],$ ^{147} {\rm{Pr}}$ [14],$ ^{151} {\rm{Pm}}$ [15, 16], and$ ^{153,155} {\rm{Eu}}$ [17−20].The
$ N = 90 $ isotone$ ^{153} {\rm{Eu}}$ is a stable isotope. The excited level structure of$ ^{153} {\rm{Eu}}$ has been extensively studied experimentally by Coulomb excitations [19, 21, 22],$ ^{154} {\rm{Sm}}$ ($ d,3n $ ) [23], and$ ^{150} {\rm{Nd}}$ ($ ^{7} {\rm{Li}}$ ,$ 4n $ ) [17, 18] reactions. The positive-parity band built on the$ K = 5/2^+ $ ground state and the negative-parity band built on the$ K = 5/2^- $ state at 97.5 keV constitute two nearly degenerate bands, which combined with the strong$ E1 $ transitions linking them, show the prominent characteristics of parity doublet bands [17−19]. The bands have been extended up to spins as high as$ {39}/{2}^+ $ and$ {43}/{2}^- $ [18]. However, the difference between the orbital and rotational gyromagnetic factors, i.e., the$ g_K-g_R $ values, extracted from the$ B(M1)/B(E2) $ ratios [17, 18] and the measured lifetimes [19] were found to be different for the opposite parity states of doublet bands, indicating that the bands are not based on an intrinsic parity-mixed state. As the preponderance of$ E1 $ transitions and large electric-dipole moments seem unable to be interpreted in the frame of reflection-symmetric single-particle models, explaining these experimental observations in theory remains a challenge.A reflection-asymmetric triaxial particle rotor model (RAT-PRM) was recently developed, which included both triaxial and octupole degrees of freedom [24, 25]. The model has been applied to investigate the multiple chiral doublet bands with octupole correlations [24, 26, 27]. By analyzing the RAT-PRM Hamiltonian, a new symmetry for an ideal chirality-parity violation system was found and the corresponding selection rules of the electromagnetic transitions were derived [28]. Moreover, the RAT-PRM has been applied to investigate the energy spectra and electromagnetic properties of the possible parity doublet bands in some odd mass nuclei, such as
$ ^{73} {\rm{Br}}$ ,$ ^{79}{\rm{Se}} $ in$ A \sim $ 80 [29, 30],$ ^{143} {\rm{Ba}}$ ,$ ^{151} {\rm{Pm}}$ in$ A \sim $ 150 [10, 31], and$ ^{217} {\rm{Ra}}$ ,$ ^{223} {\rm{Th}}$ in$ A \sim $ 220 [32, 33] mass regions.This study will investigate the octupole correlations in the stable nucleus
$ ^{153} {\rm{Eu}}$ using RAT-PRM. The model is briefly introduced in Sec. II and the numerical details are presented in Sec. III. The calculated results for the positive- and negative-parity bands, such as the energy spectra and electromagnetic transitions are discussed in Sec. IV. A summary is given in Sec. V. -
The total RAT-PRM Hamiltonian [24] is the sum of the intrinsic Hamiltonian
$ \hat{H}_{\rm{intr.}}^{p(n)} $ for valence protons (neutrons) and the collective Hamiltonian$ \hat{H}_{\rm{core}} $ of a reflection-asymmetric triaxial rotor. The intrinsic Hamiltonian$ \hat{H}_{\rm{intr.}}^{p(n)} $ for valence nucleons is expressed as [34−36],$ \begin{aligned}[b] \hat{H}_{\rm{intr.}}^{p(n)} =\;& \sum\limits_{\nu>0} (\varepsilon_\nu^{p(n)}-\lambda_{p(n)}) (a_\nu^\dagger a_\nu+a_{\bar{\nu}}^\dagger a_{\bar{\nu}})\\ &- \frac{\Delta_{p(n)}}{2} \sum\limits_{\nu>0}(a_{\nu}^\dagger a_{\bar{\nu}}^\dagger + a_{\bar{\nu}}a_\nu), \end{aligned} $

(1) with
$ \lambda_{p(n)} $ representing the Fermi energy and$ \Delta_{p(n)} $ representing the pairing gap parameter. The single-particle energy$ \varepsilon_\nu^{p(n)} $ is obtained by diagonalizing a reflection-asymmetric triaxial single-particle Hamiltonian$ \hat{H}_{\rm{s.p.}}^{p(n)} $ [24], which has the form of the Nilsson Hamiltonian [37]. The core Hamiltonian$ \hat{H}_{\rm{core}} $ is expressed as,$ \hat{H}_{\rm{core}} = \sum\limits_{k = 1}^3\frac{\hat{R}_k^2}{2{\cal{J}}_k} +\frac{1}{2}E(0^-)(1-\hat{P}_c), $

(2) with
$ \hat{R}_k $ representing the angular momentum operators of the core and$ {\cal{J}}_k = {\cal{J}}_0\sin^2(\gamma-2k\pi/3) $ representing the moments of inertia (MoIs) of the irrotational flow type. In the second term, the core parity splitting parameter$ E(0^-) $ is treated as a free parameter, describing the excitation energy of the virtual$ 0^- $ state [38], and the core parity operator$ \hat{P}_c $ is the product of the single-particle parity operator$ \hat{\pi} $ and the total parity operator$ \hat{P} $ .The total RAT-PRM Hamiltonian is diagonalized numerically in the symmetrized strong coupling basis with good parity and angular momentum, which gives rise to the eigenvalues and eigen wavefunctions [24]. For the electric multipole transition calculations, the corresponding operators contain two terms [1, 24],
$ {\hat{\cal{M}}}(E\lambda,\mu) = \hat{q}_{\lambda\mu}^{(c)} + \hat{q}_{\lambda\mu}^{(p)} = \frac{3Ze}{4\pi}R_0^\lambda \beta_{\lambda\mu} + e_{\rm{eff}} \sum\limits_{i = 1}^nr_i^\lambda Y_{\lambda\mu}^*, $

(3) which consider contributions from core and valence particles. Here,
$ R_0 = 1.2A^{1/3} $ fm is the nuclear radius, and$ e_{\rm{eff}} $ is the effective charge. For the electric quadrupole ($ E2 $ ) transition calculations, the valence particle term in Eq. (3) is neglected, since it is much smaller than the core term [39]. For the magnetic dipole transition calculations, the corresponding operator is given as$ {\hat{\cal{M}}}(M1,\mu) = \sqrt{\frac{3}{4\pi}}\frac{e\hbar}{2Mc}\Big[(g_{p(n)}-g_R)\hat{j}^{p(n)}_{1\mu}\Big], $

(4) where
$ g_p $ and$ g_R $ are the effective gyromagnetic ratios for the valence proton (neutron) and collective core, respectively, and$ \hat{j}_{1\mu} $ denotes the spherical tensor in the laboratory frame. -
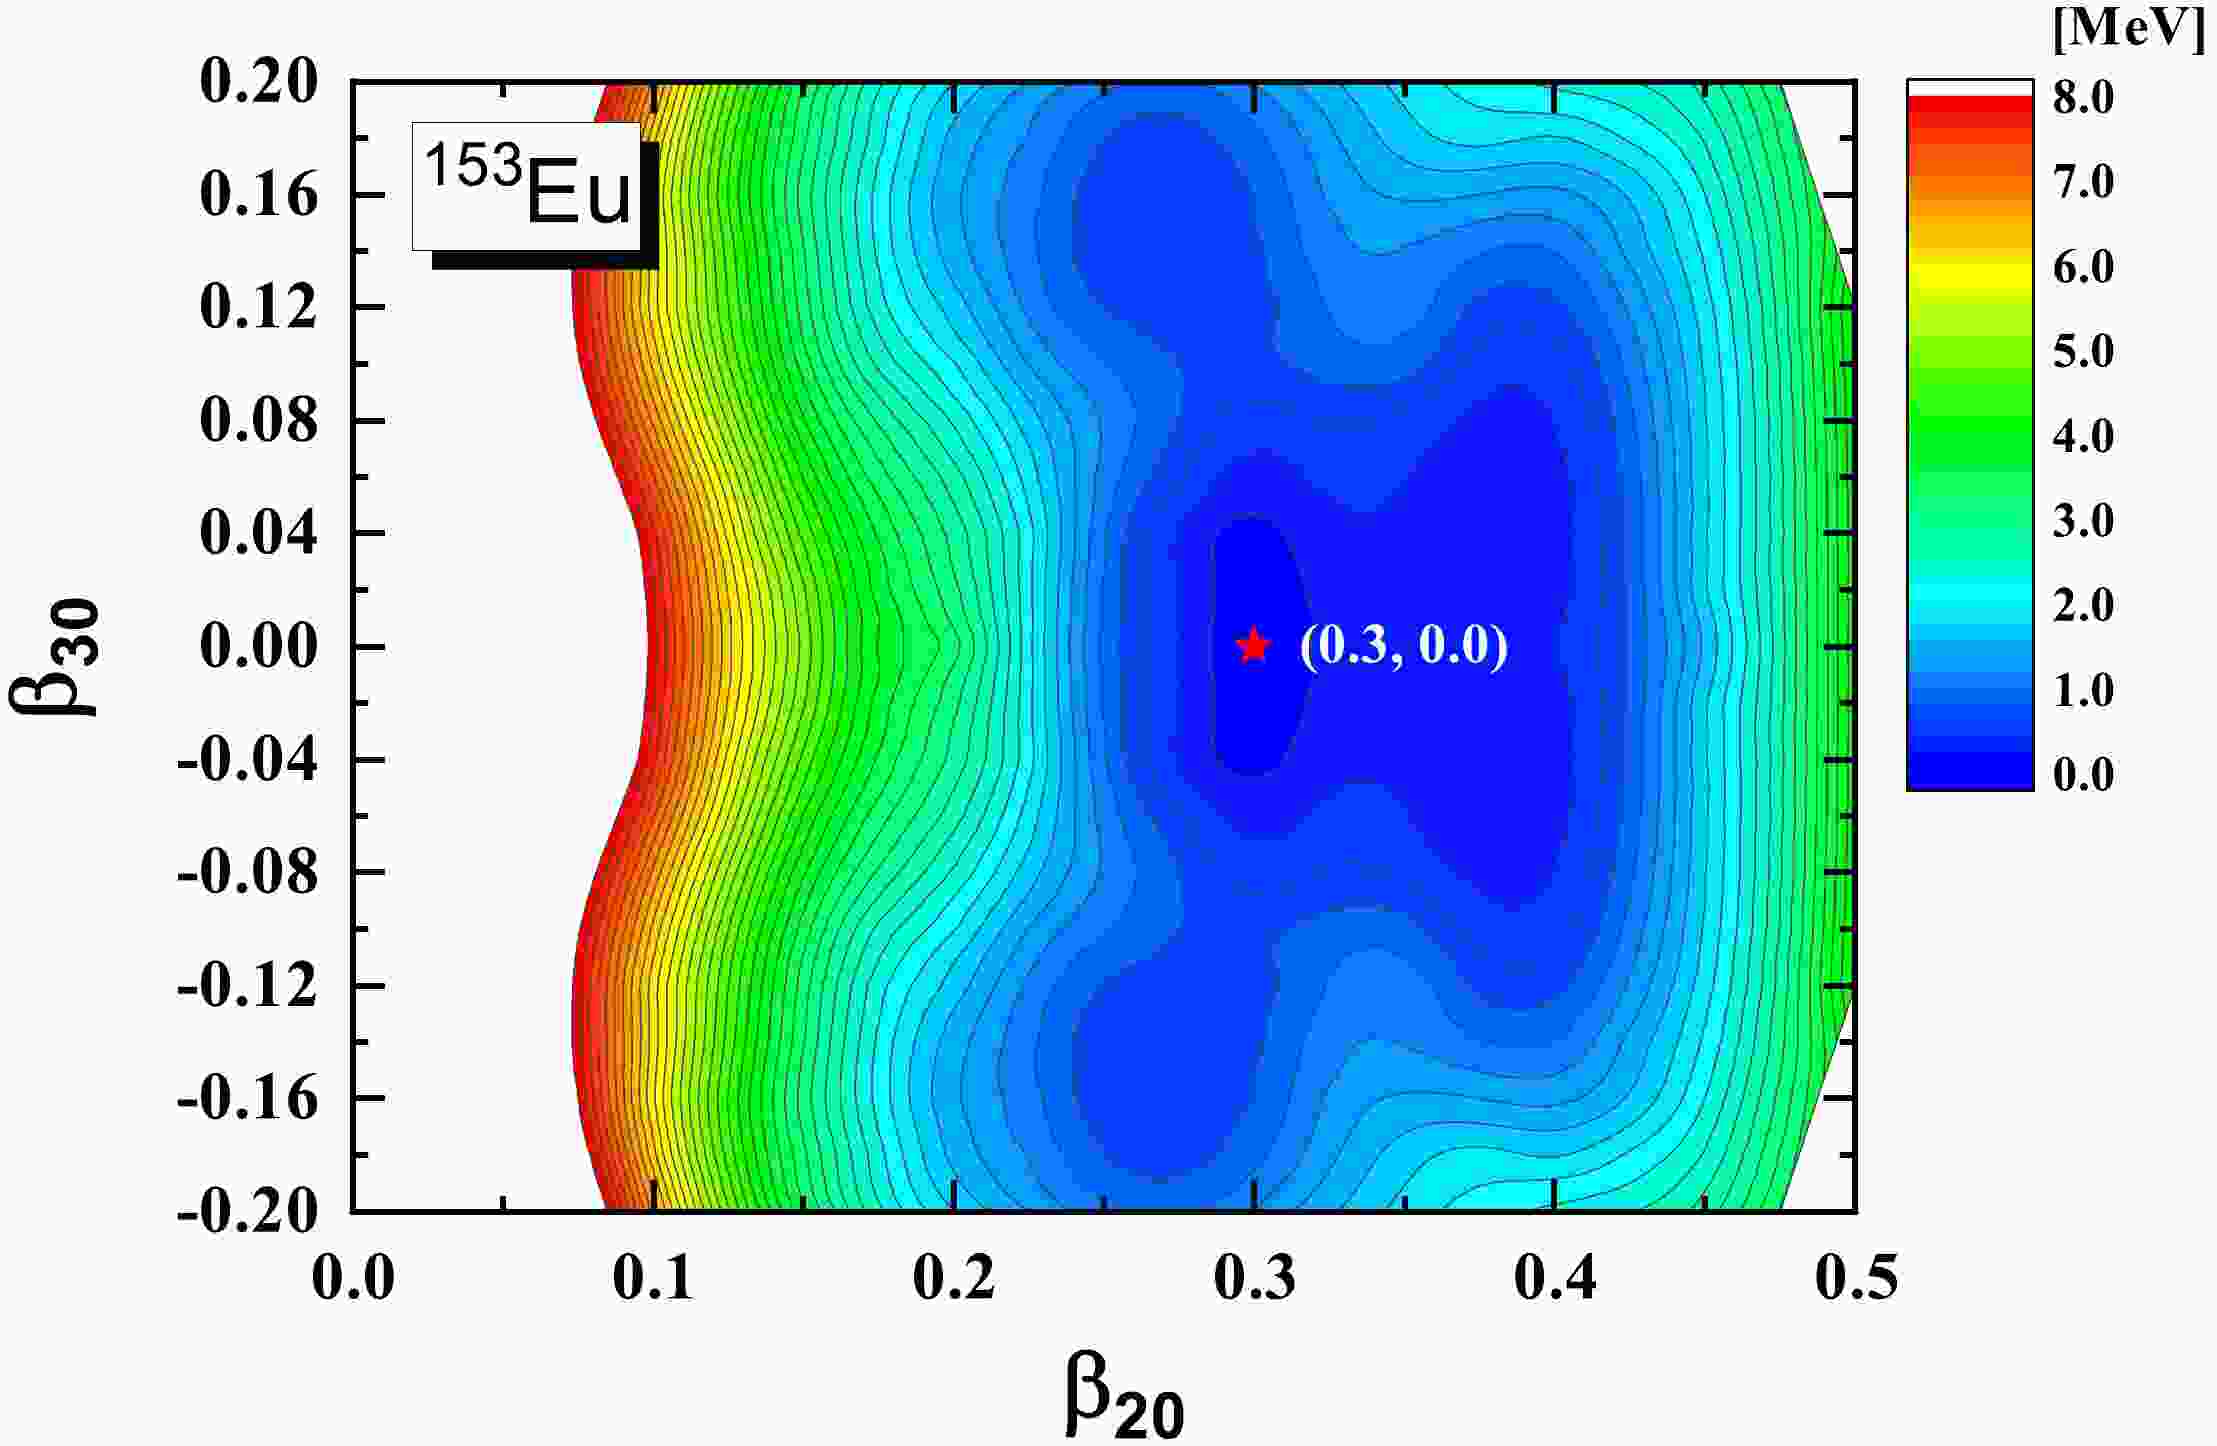
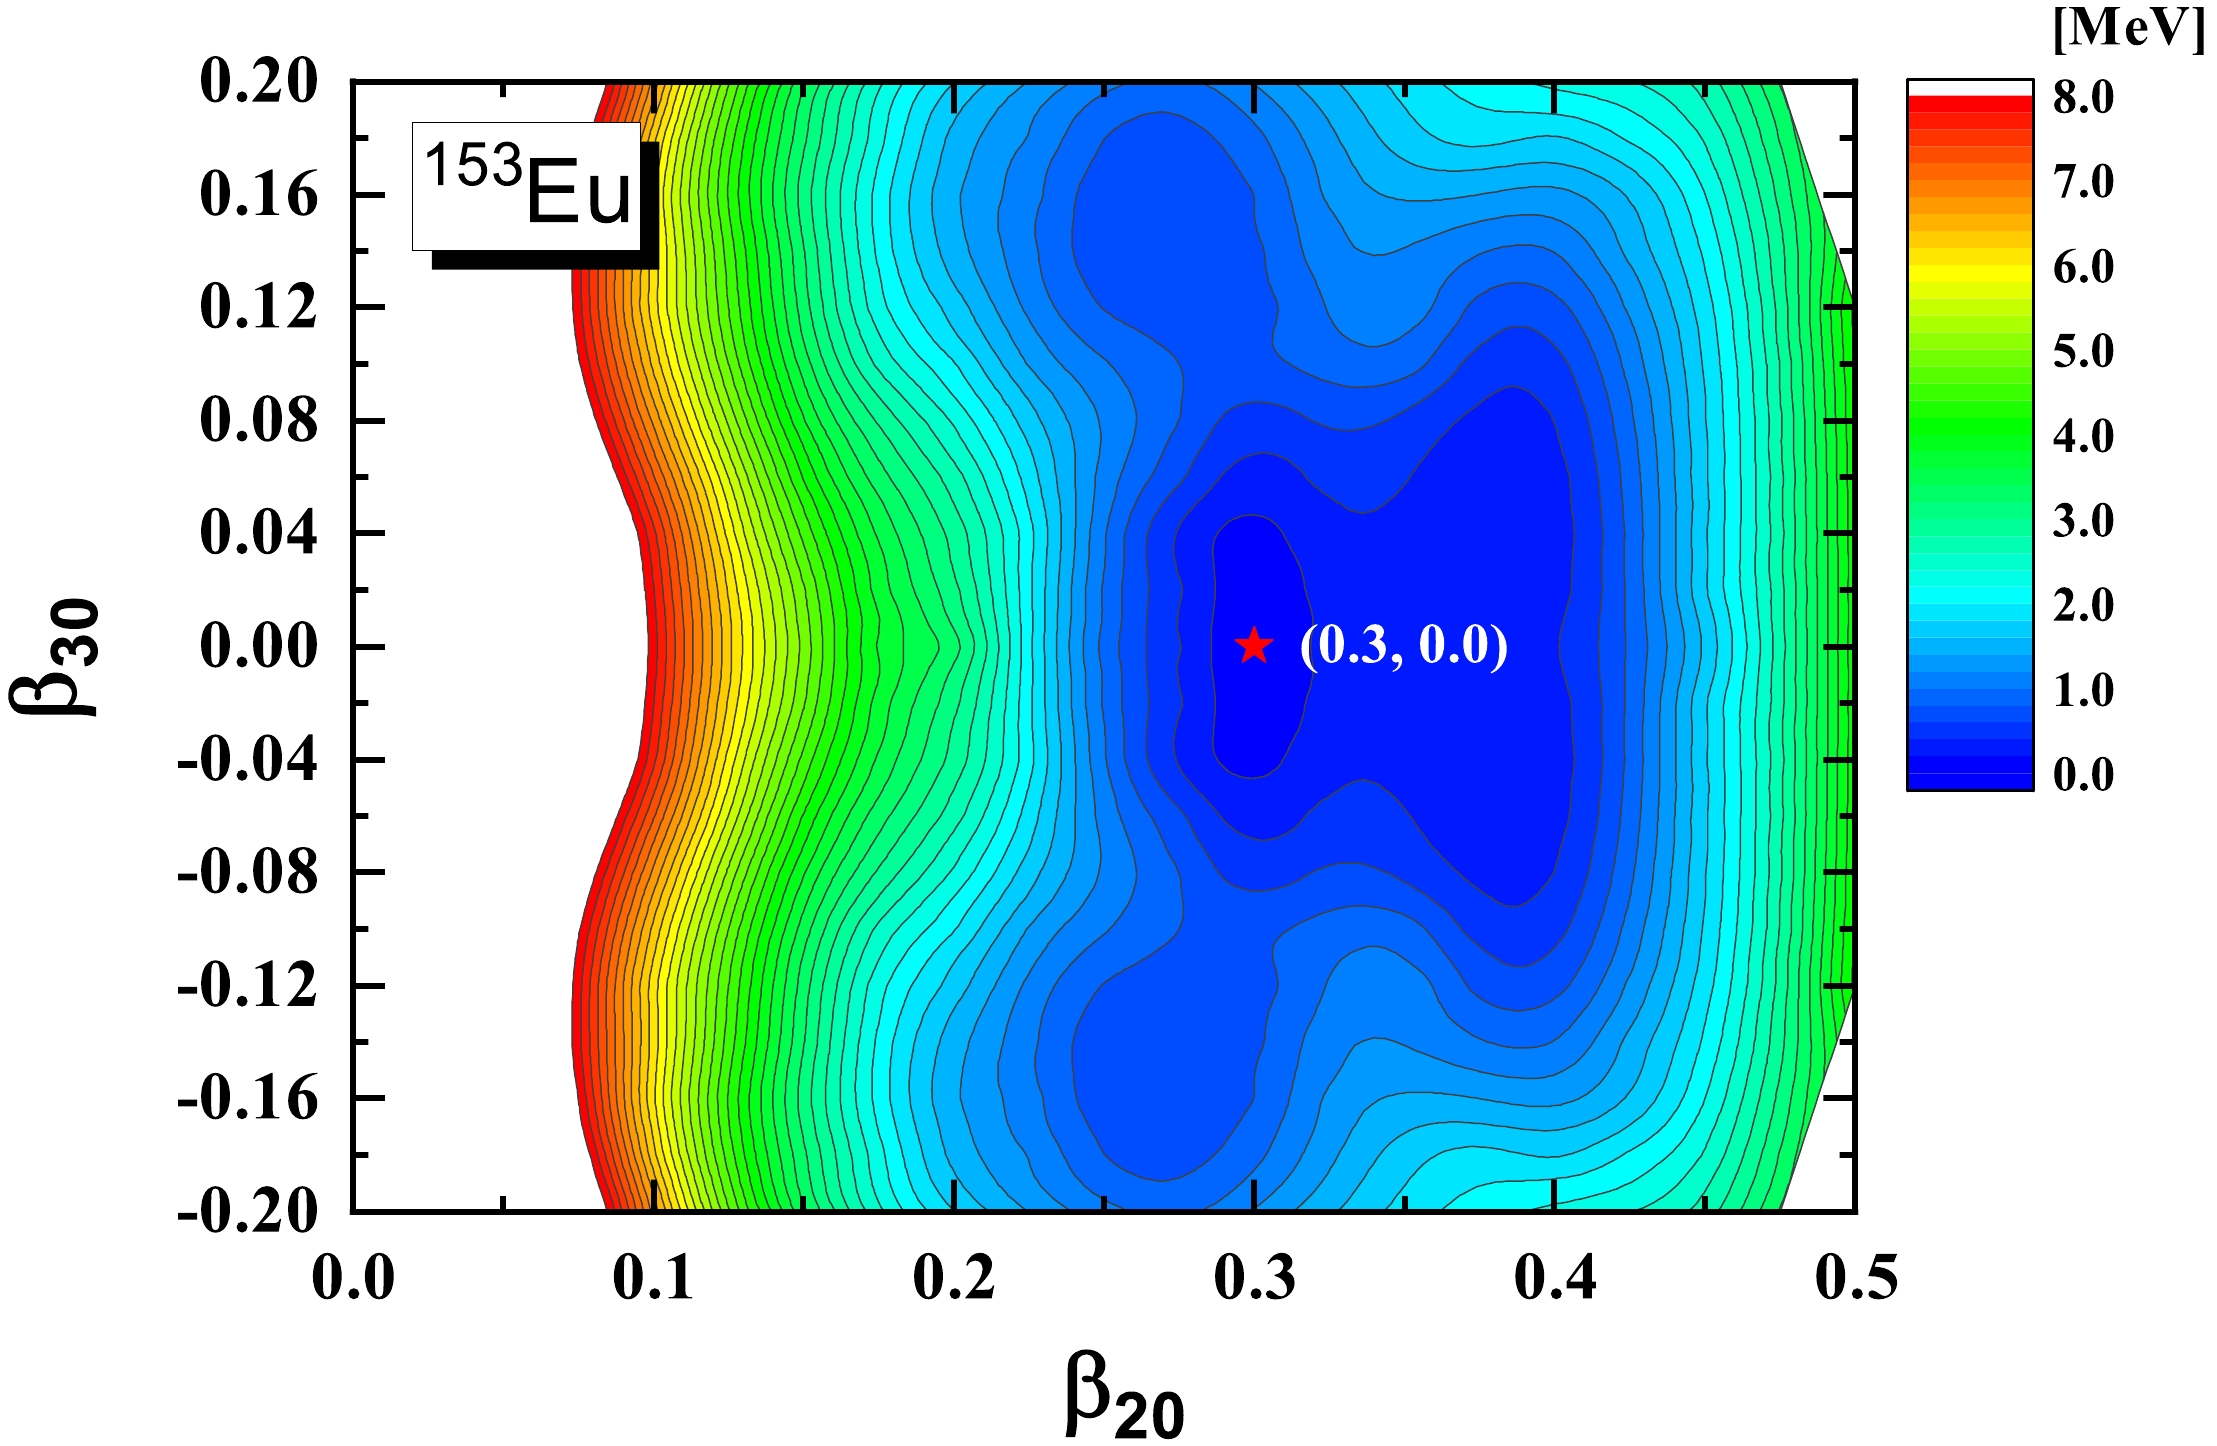
The deformation parameters in the present RAT-PRM calculation of
$ ^{153} {\rm{Eu}}$ are based on the microscopic covariant density functional theory (CDFT) in a 3D lattice [40] with the successful point coupling density functional PC-PK1 [41]. Figure 1 shows the potential energy surface (PES) in the$ (\beta_{20}, \beta_{30}) $ plane for$ ^{153} {\rm{Eu}}$ calculated by the constrained CDFT in 3D lattice calculations. The global minimum of the PES is found to be located at$ \beta_{20} = 0.30 $ and$ \beta_{30} = 0.00 $ . All the axial asymmetric deformations, i.e.,$ \beta_{2\mu}, \beta_{3\mu},\beta_{4\mu}, (\mu\ne0) $ , are found to be zero, which means that the ground state of$ ^{153} {\rm{Eu}}$ corresponds to an axial and reflection symmetric shape. The PES exhibits a relatively soft character around the minimum. With the above adopted deformation parameters, a unified description for the positive- and negative-parity bands and the electromagnetic transitions between them in$ ^{153} {\rm{Eu}}$ can be obtained. In addition, the RAT-PRM calculations with$\beta_{30} = 0.03, 0.05$ , and$ 0.07 $ are also performed to investigate the effect of octupole deformation.For the intrinsic part, the reflection asymmetric triaxial Nilsson Hamiltonian with the parameters
$ \kappa,\mu $ in Ref. [42] is solved in the harmonic oscillator basis [43]. The proton Fermi energy is chosen as$ \lambda_p = 43.13 $ MeV and the pairing gap is calculated using the empirical formula$ \Delta_p = 12/\sqrt{A} $ MeV. The single-particle space available to the odd proton is truncated to 13 levels, with six above and six below the Fermi level. Increasing the size of the single-particle space does not influence the band structure in the calculations.For the core part, it turns out that a spin-dependent MoI, i.e.,
$ {\cal{J}}(I) = (a+bI)\; \hbar^2/ $ MeV is necessary to reproduce the experimental energy spectra. This spin-dependent MoI can be attributed to the increasing behavior versus spin for the effective MoI extracted from the experimental data of positive- and negative-parity bands in$ ^{153} {\rm{Eu}}$ [19]. The parameter a is 30 for the positive-parity band and 18 for the negative-parity band, while the parameter b is 0.85 for both bands. The core parity splitting parameter$ E(0^-) = 2.0 $ MeV is used. An ad hoc Coriolis attenuation factor ξ is generally needed in PRM description [44], which is 0.7 for positive-parity band and$ 0.8 $ for the negative-parity band in the present calculation.The intrinsic electric-quardupole moment
$ Q_0 = 6.75 $ eb, determined empirically in Ref. [19], is adopted tor the electric-multipole transition calculations, while the intrinsic electric-dipole moment$ Q_{10} = \dfrac{3}{4\pi}R_0Z\beta_{10} $ is calculated with$ R_0 = 1.2A^{1/3} $ fm. For the magnetic-dipole transition calculations, the gyromagnetic ratios for the collective rotor and valence proton are given by$ g_R = Z/A $ and$ g_p = g_l+(g_s-g_l)/(2l+1) $ , respectively [1, 39]. -
The calculated physical observables for the positive- and negative-parity bands in
$ ^{153} {\rm{Eu}}$ , including the excitation energies, the energy staggering parameters$S(I) = [E(I)- E(I-1)]/(2I)$ , and the intraband$ E2 $ and$ M1 $ transition probabilities, are shown in Fig. 2 in comparison with the data available [19].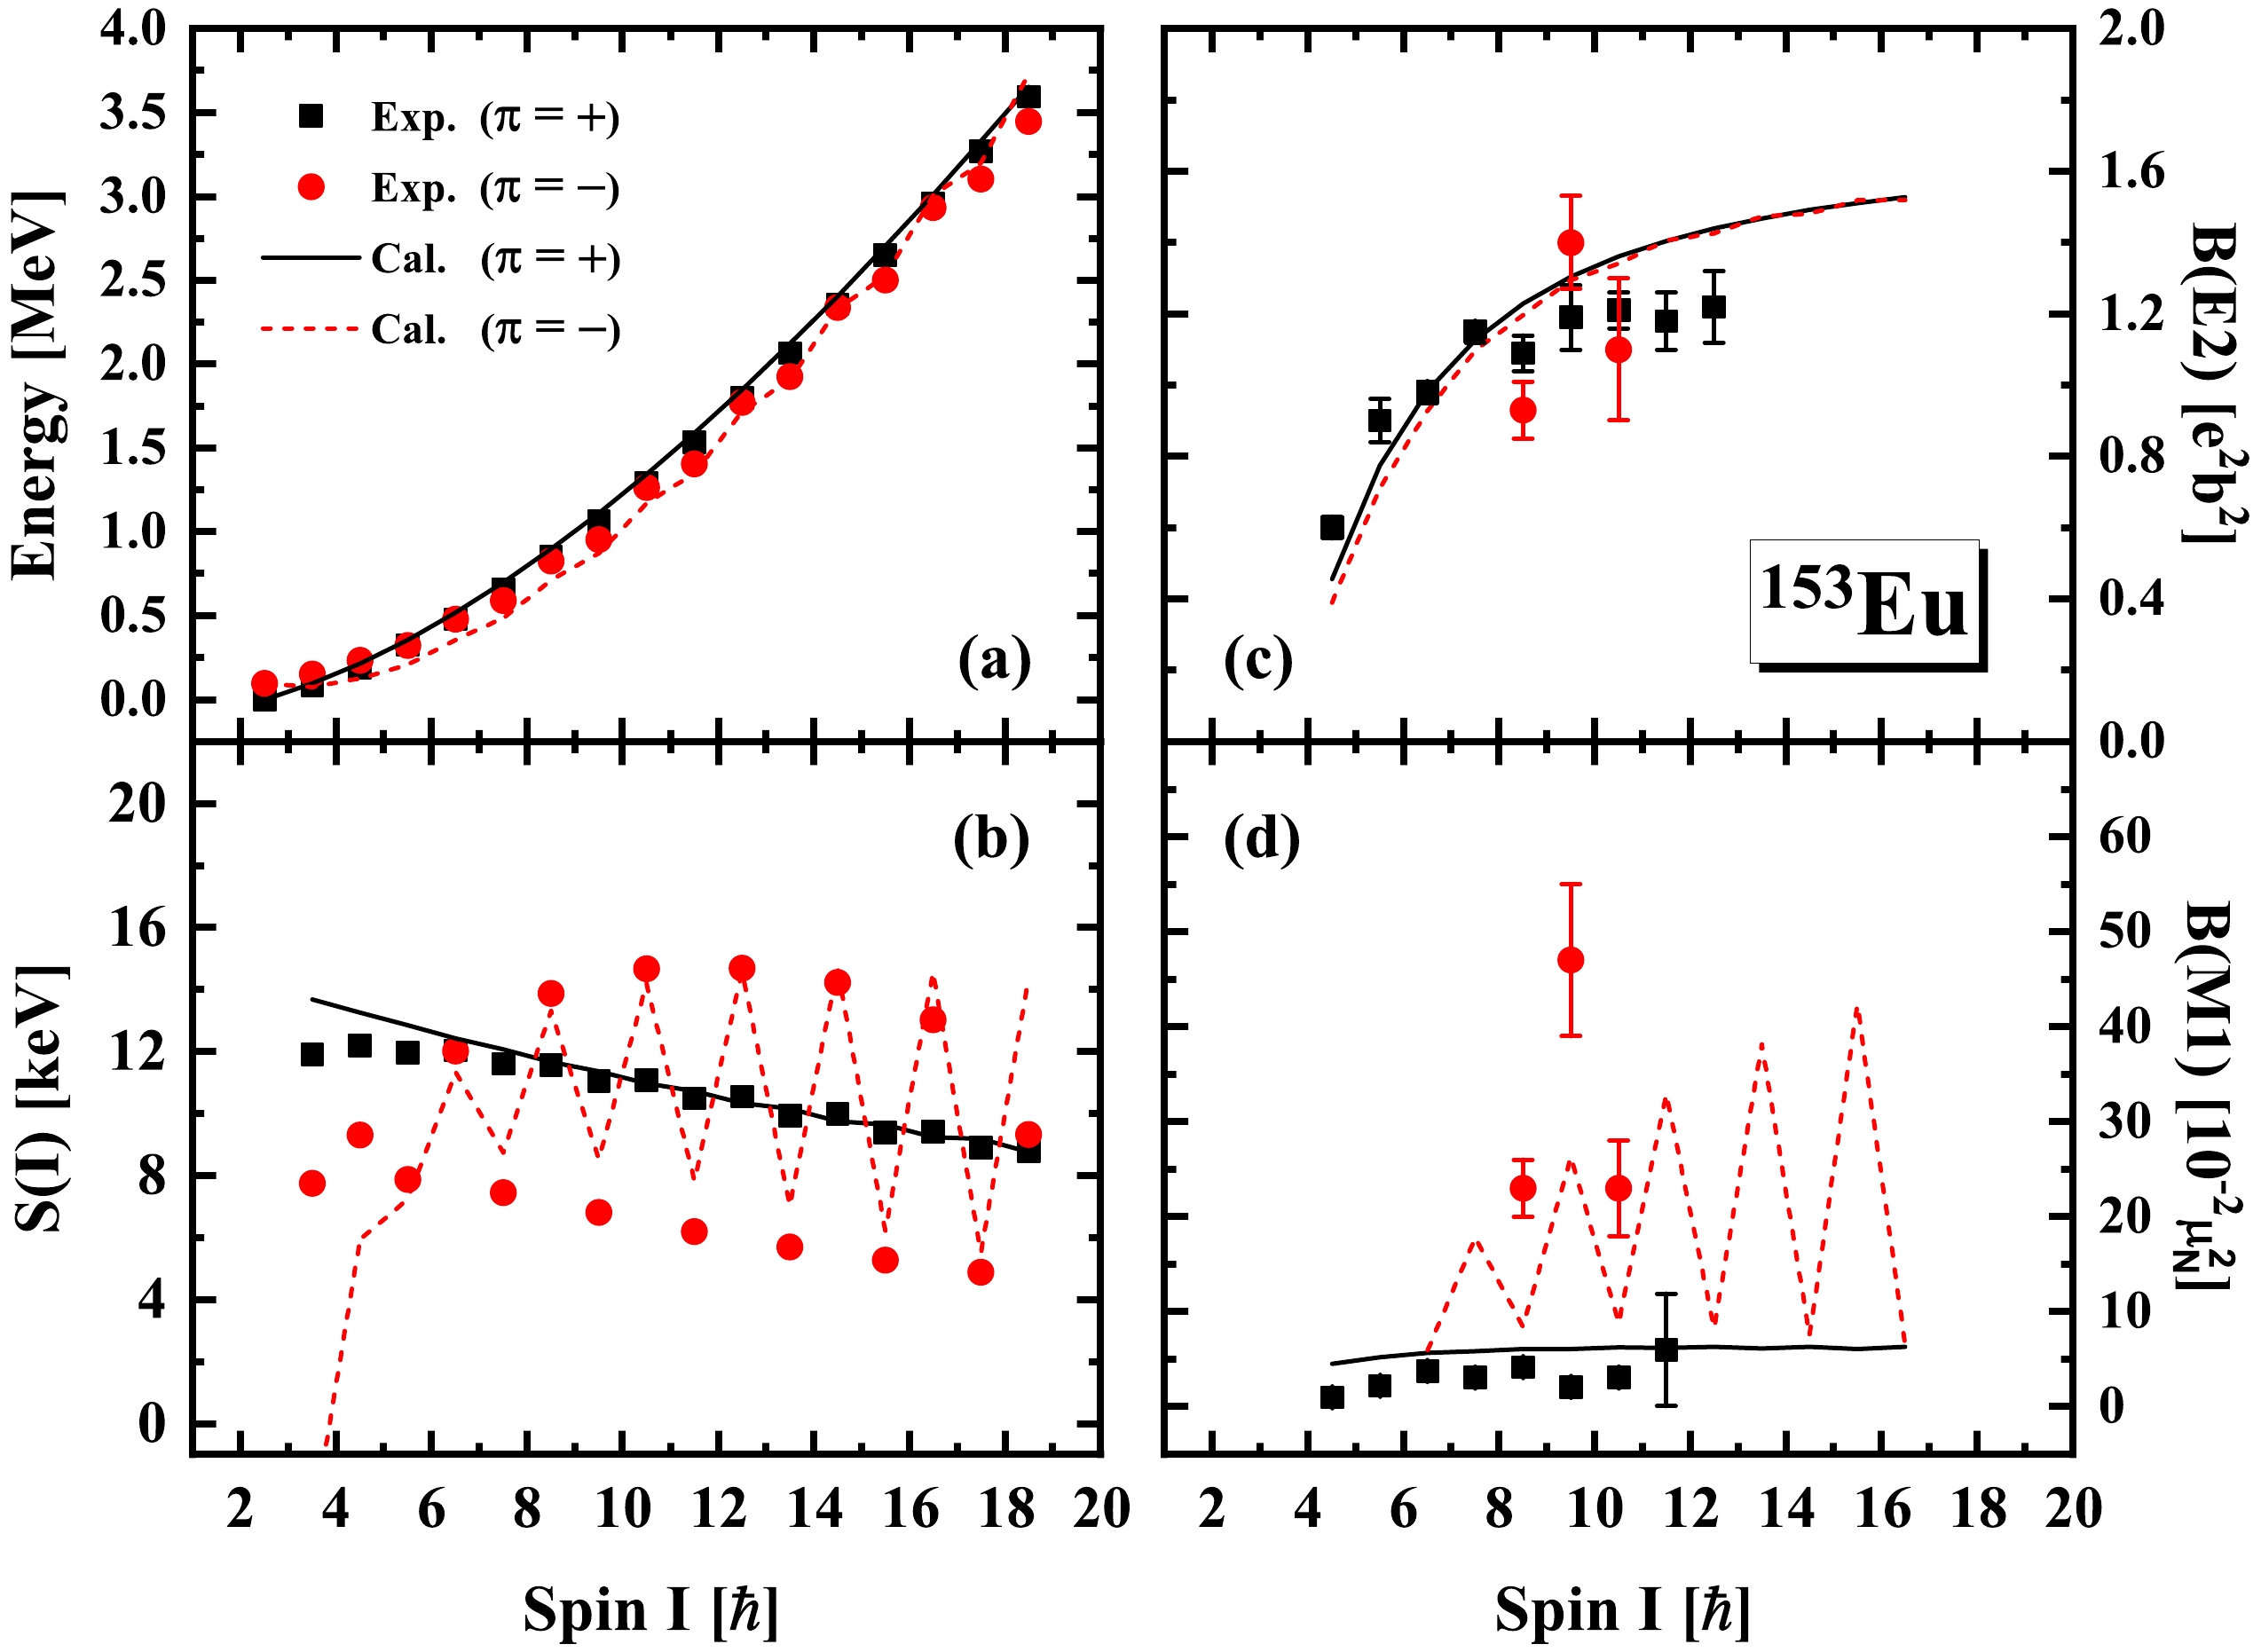
Figure 2. (color online) The energies
$E(I)$ (a), the energy staggering parameters$S(I)=[E(I)-E(I-1)]/(2I)$ (b), and the intraband$E2$ (c) and$M1$ (d) transition probabilities for the positive-parity band$\pi=+$ and negative-parity band$\pi=-$ in 153Eu calculated by RAT-PRM (lines), in comparison with the experimental data [19] (symbols).As shown in Fig. 2(a), the experimental positive- and negative-parity bands are nearly degenerate in energy. The negative-parity band is situated at a slightly higher level in the bandhead vicinity. As the spin increases, it undergoes a downward shift with respect to the positive-parity band, reaching a point of intersection at
$ I = 11/2\hbar $ . The calculated excitation energies well reproduce the data for both the positive-parity band$ \pi = + $ and negative-parity band$ \pi = - $ . For the observed spin range of$ 5/2\hbar\le I\le 37/2\hbar $ , the calculated average energy difference between the positive- and negative-parity bands is 10 keV, which is close to the experimental value of 14 keV. Figure 2(b) shows the behavior of signature splitting for the positive- and negative-parity bands, as represented by the staggering parameters$ S(I) $ . In contrast to the nearly vanished splitting observed for the positive-parity band, the$ S(I) $ values exhibit pronounced signature splitting for the negative-parity band. The RAT-PRM calculations well reproduce the experimental values and behaviors in the spin region$ I\ge11/2\hbar $ , and the different$ S(I) $ behaviors for the two bands are attributed to their different configurations. The configuration for the positive-parity band is found to be dominated by$ \pi g_{7/2}[\Omega = 5/2] $ , and$ \pi h_{11/2}[\Omega = 5/2] $ for the negative-parity band. For the positive-parity band, the component$ \pi g_{7/2}[\Omega = 5/2] $ with a relatively-high Ω is always predominant as the spin increases, leading to the nearly vanished signature splitting. For the negative-parity band, the component$ \pi h_{11/2}[\Omega = 5/2] $ decreases rapidly while the component$ \pi h_{11/2}[\Omega = 3/2] $ with a relatively-low Ω increases as the spin increases, which leads to the pronounced signature splitting.As shown in Fig. 2(c), the experimental
$ B(E2) $ values for the positive-parity band increase as the spin increases, whereas for the negative-parity band, the first two data follow the increasing tendency but the last datum at$ I = 21/2\hbar $ has an obvious drop. The calculated$ B(E2) $ values well reproduce the increasing trend and are close to the experimental values in magnitude. More experimental data are necessary to pin down the$ B(E2) $ tendency for the negative-parity band. The$ M1 $ transition strengths are sensitive to the single-particle components of the intrinsic wave functions. As shown in Fig. 2(d), the experimental$ B(M1) $ values exhibit a pronounced staggering behavior for the negative-parity band, while this behavior is not shown in the positive-parity band. Although the calculated$ B(M1) $ values differ by a factor of two from the experimental results, the trends of the experimental$ B(M1) $ values are well reproduced for both positive- and negative-parity bands, indicating the proper intrinsic wave functions in the present calculations.The observation of enhanced interband E1 transitions connecting the positive- and negative-parity bands is an important signal of octupole correlations in atomic nuclei. Figures 3(a) and (b) show the calculated interband
$ B(E1) $ values from the positive-parity to negative-parity bands ($ \pi+\rightarrow\pi- $ ) and those from the negative-parityto positive-parity bands ($ \pi-\rightarrow\pi+ $ ), respectively, in comparison with the available experimental data [19]. The calculated$ B(E1) $ values with$ \beta_{30} = 0.00 $ generally underestimate the experimental data. By introducing the octupole deformation in the RAT-PRM calculations, the$ B(E1) $ values are found to depend sensitively on the value of the octupole deformation parameter$ \beta_{30} $ . The calculated$ B(E1) $ values with$ \beta_{30} = 0.07 $ are two orders of magnitude higher than those with$ \beta_{30} = 0.00 $ . The calculated values show good agreement with the experimental data for$ \beta_{30} = 0.05 $ . This result indicates that the single-particle contributions in Eq. (3) alone are insufficient to account for the substantial$ E1 $ transitions observed in$ ^{153} {\rm{Eu}}$ . By contrast, no notable influences on the excitation energies and$ B(E2) $ and$ B(M1) $ values were observed when$ \beta_{30} $ was changed from 0.00 to 0.07. Furthermore, considering the soft behavior of PES in$ \beta_{20} $ , RAT-PRM calculations with$ \beta_{20} = 0.35 $ and$ \beta_{30} $ changing from 0.00 to 0.07 have been performed to investigate the sensibility of$ B(E1) $ on$ \beta_{30} $ at different$ \beta_{20} $ . Based on the reproduction of the energy spectra, the sensibility of$ B(E1) $ to$ \beta_{30} $ at$ \beta_{20} = 0.35 $ showed similar behavior to that at$ \beta_{20} = 0.30 $ .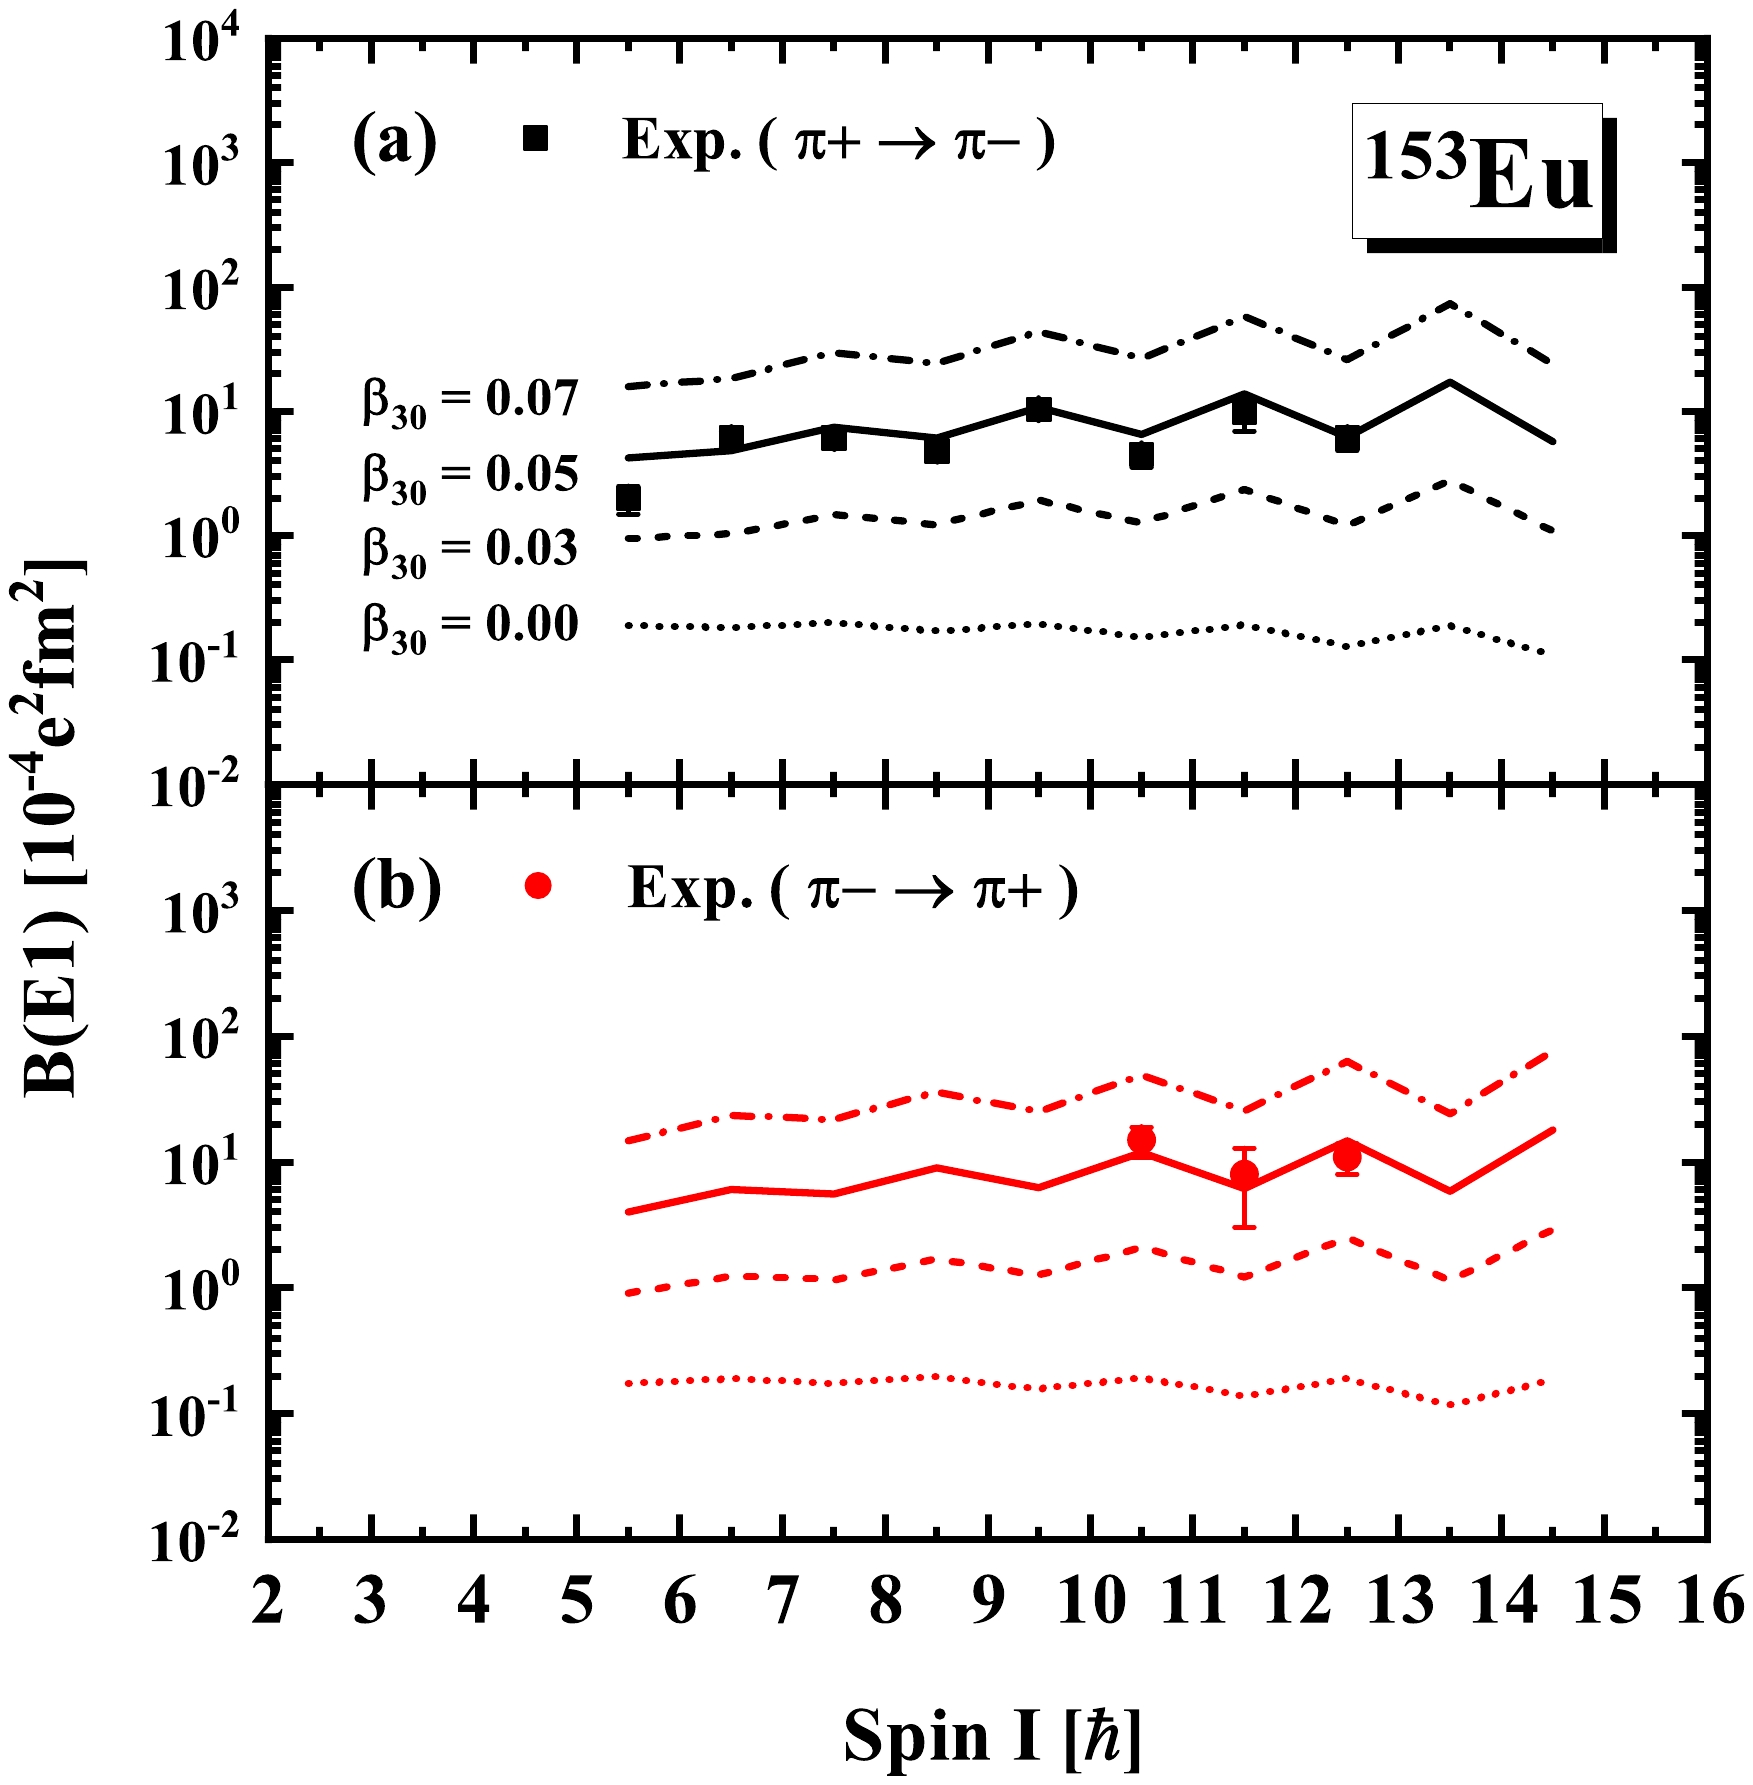
Figure 3. (color online) The calculated
$B(E1)$ values of the interband$E1$ transitions in 153Eu in comparison with the available experimental data [19] for (a) the positive-parity to negative-parity bands ($\pi+\rightarrow\pi-$ ) and (b) the negative-parity to positive-parity bands ($\pi-\rightarrow\pi+$ ). The RAT-PRM calculations with$\beta_{30}=0.00, 0.03, 0.05,$ and$0.07$ are denoted with different lines.To determine the roles of the two terms in Eq. (3), Figs. 4(a) and (b) show the calculated
$ B(E1) $ values for the interband$ E1 $ transitions from the positive-parity to negative-parity bands in$ ^{153} {\rm{Eu}}$ for$ \beta_{30} = 0.00 $ and$ \beta_{30} = 0.05 $ , respectively. As shown in Fig. 4(a), the$ E1 $ transitions are completely due to the contribution of the intrinsic valence particle part in Eq. (3) since the collective dipole moment$ q_{10}^{(c)} = 0 $ with$ \beta_{30} = 0.00 $ . For$ \beta_{30} = 0.05 $ , as shown in Fig. 4(b), the$ E1 $ transitions are primarily due to the contribution of the collective part in Eq. (3). The contribution of the collective part increases and shows a staggering behavior at high spins as the spin increases, as does the calculated$ B(E1) $ value. This staggering behavior may result from variations in the main components of the intrinsic wave functions.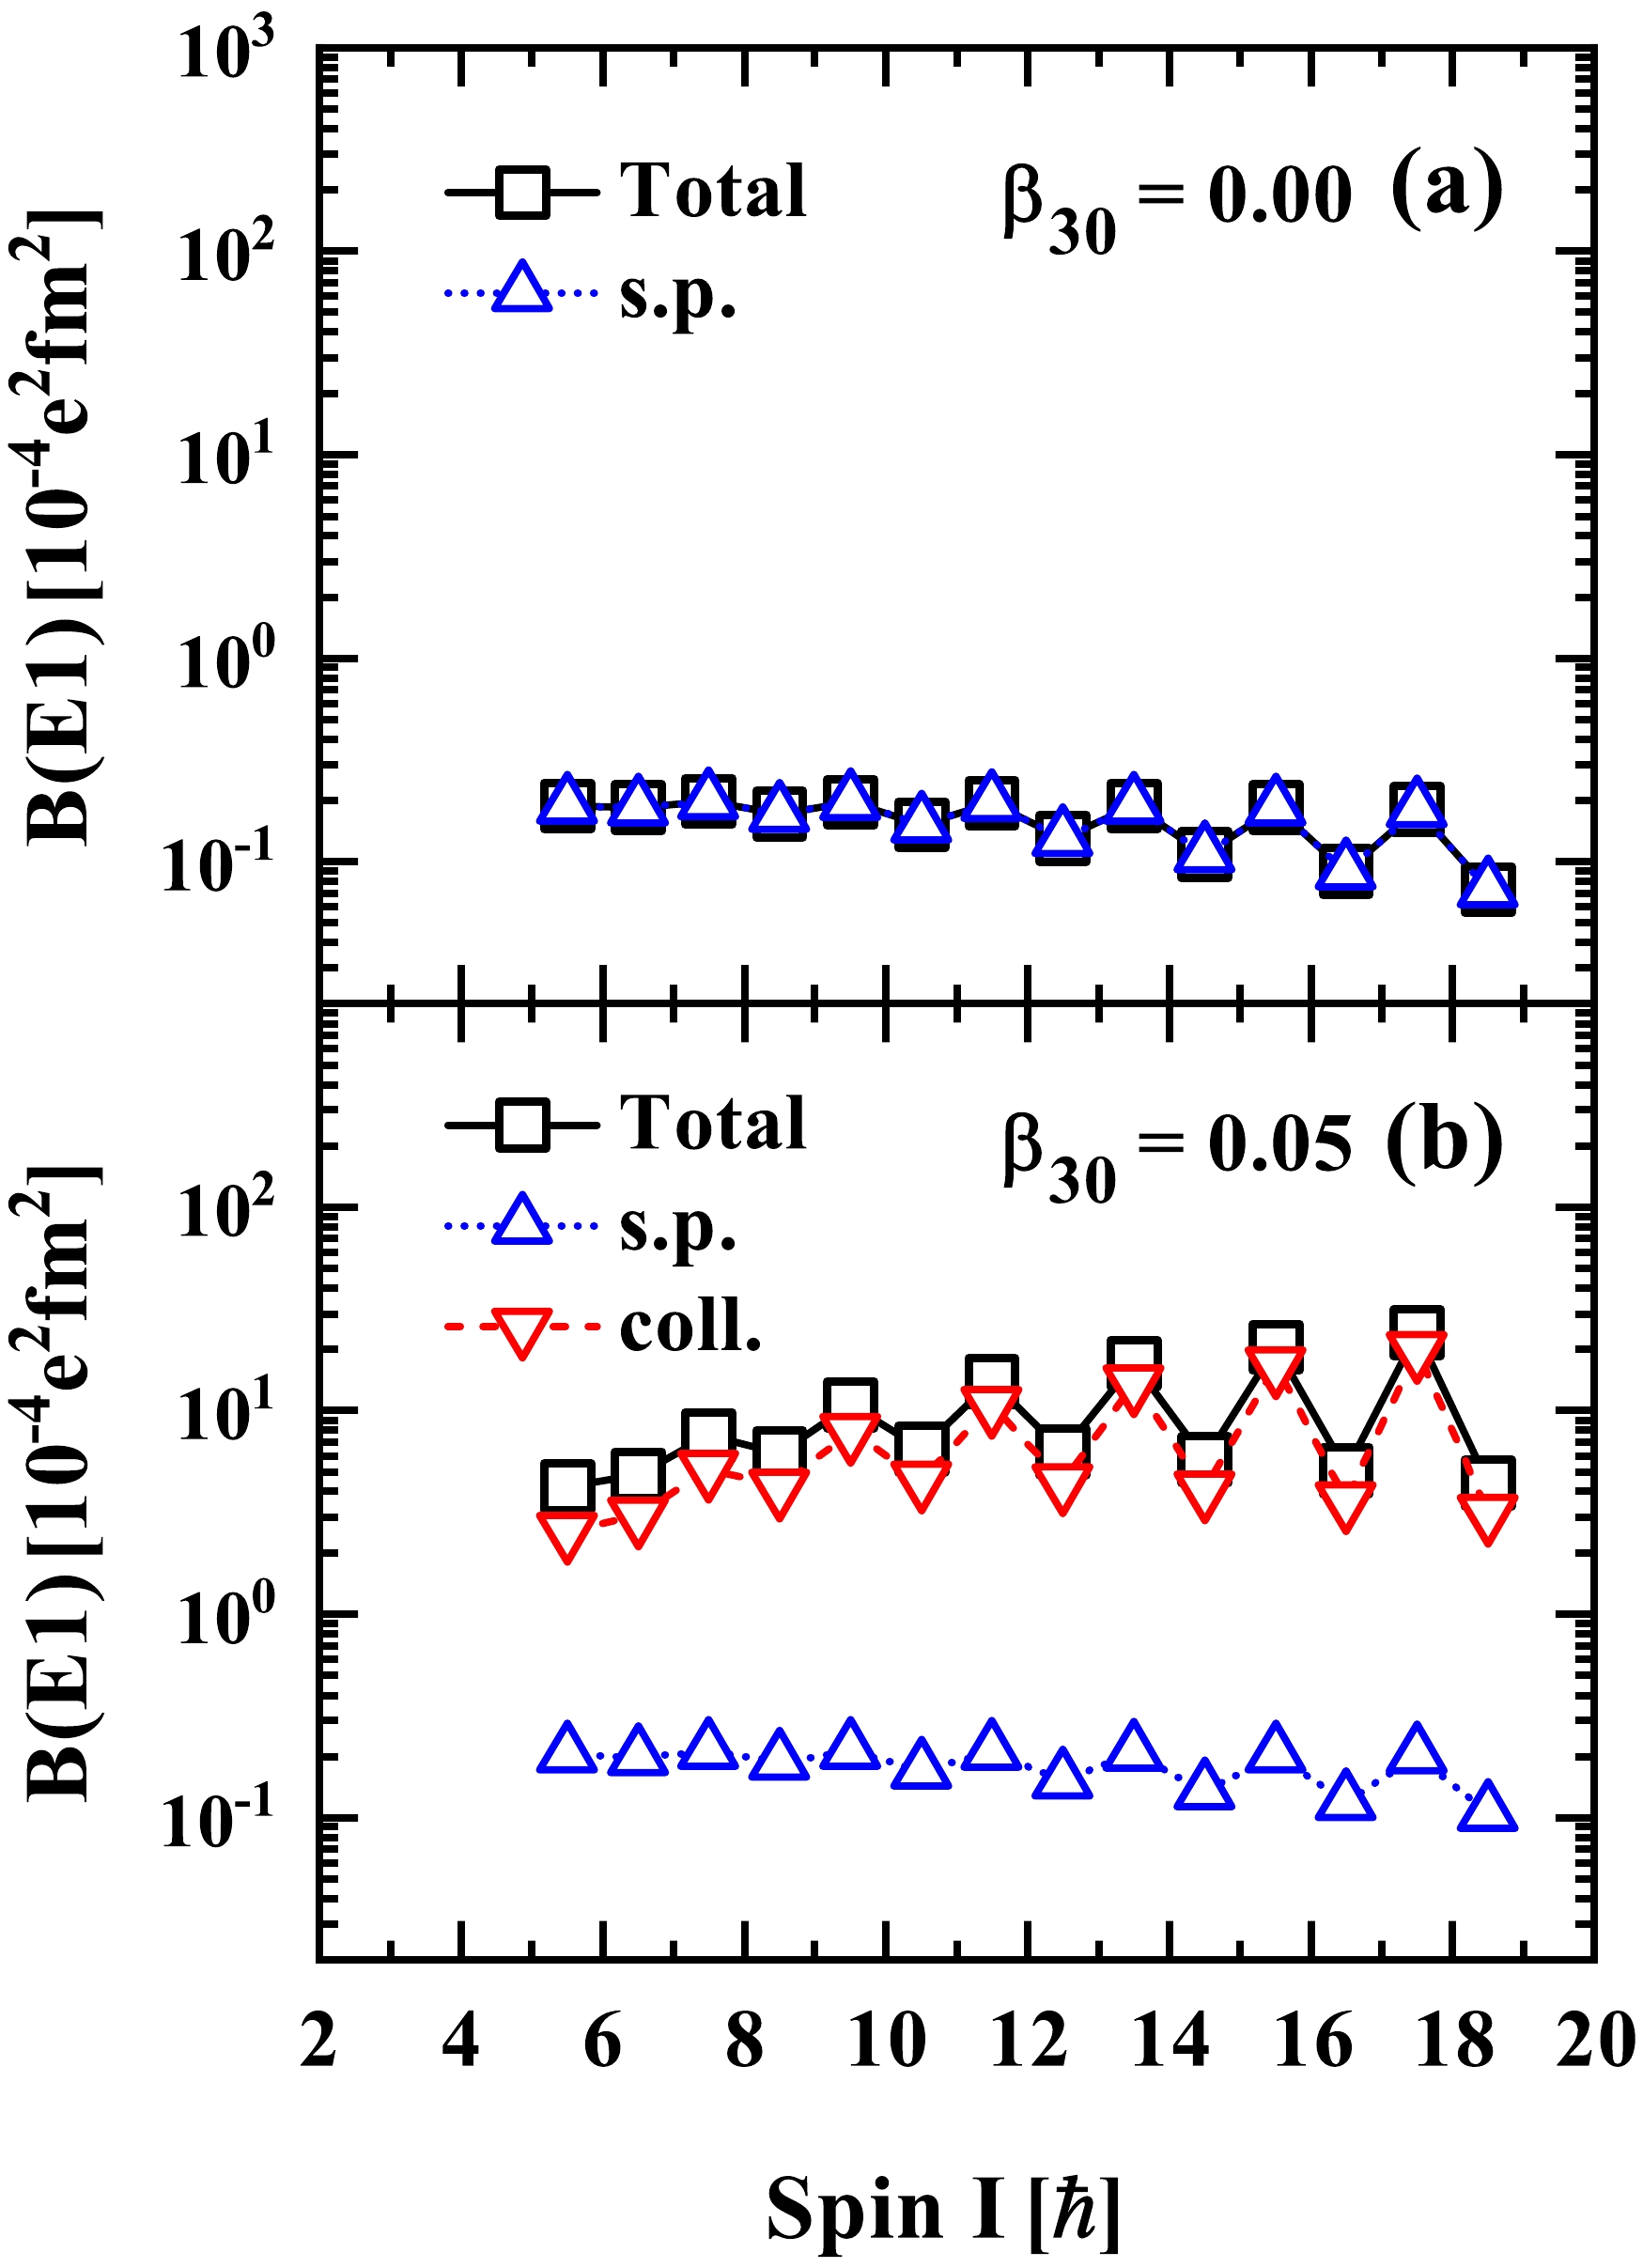
Figure 4. (color online) The calculated
$B(E1)$ values for the interband$E1$ transitions from the positive-parity to negative-parity bands in 153Eu for (a)$\beta_{30}=0.00$ and (b)$\beta_{30}=0.05$ . Calculated$B(E1)$ values using only the first term of Eq. (3) (labeled as coll.) and only the second term of Eq. (3) (labeled as s.p.) are denoted by the upside down and up triangles, respectively. The total$B(E1)$ values (labeled as Total) are denoted by open squares. For$\beta_{30}=0.00$ , the collective part vanishes.The main components of the RAT-PRM wave functions in terms of the strong coupled basis
$ |IMK\rangle\chi^\nu_p $ (denoted as$ |K\nu\rangle_p $ for short) are shown in Fig. 5. Here,$ |IMK\rangle $ is the Wigner function, with I, M, and K denoting the quantum numbers of the total angular momentum and its projections along the third axis in the laboratory and intrinsic frames, and$ \chi_p^\nu $ representing the intrinsic wave function of the νth proton single-particle level$ |\nu\rangle_p $ . The main component of the positive-parity band is$ |5/2,1\rangle_p $ , and that for negative-parity band is$ |5/2,4\rangle_p $ , i.e., the positive- and negative-parity bands are built on one-proton configurations$ |1\rangle_p $ and$ |4\rangle_p $ , respectively. As shown in Figs. 5(a) and (b), for the positive-parity band, the largest component$ |5/2,1\rangle_p $ plays an overwhelming role, with the amplitude always larger than 0.80, whereas the largest component of the negative-parity band$ |5/2,4\rangle_p $ decreases rapidly with spin, i.e., its amplitude decreases from 0.94 ($ 5/2\hbar $ ) to 0.43 ($ 35/2\hbar $ ) and 0.56 ($ 37/2\hbar $ ). In comparison, the main components of the intrinsic wave functions for the positive- and negative-parity bands are nearly unchanged with$ \beta_{30} = 0.05 $ , as shown in Figs. 5(c) and (d).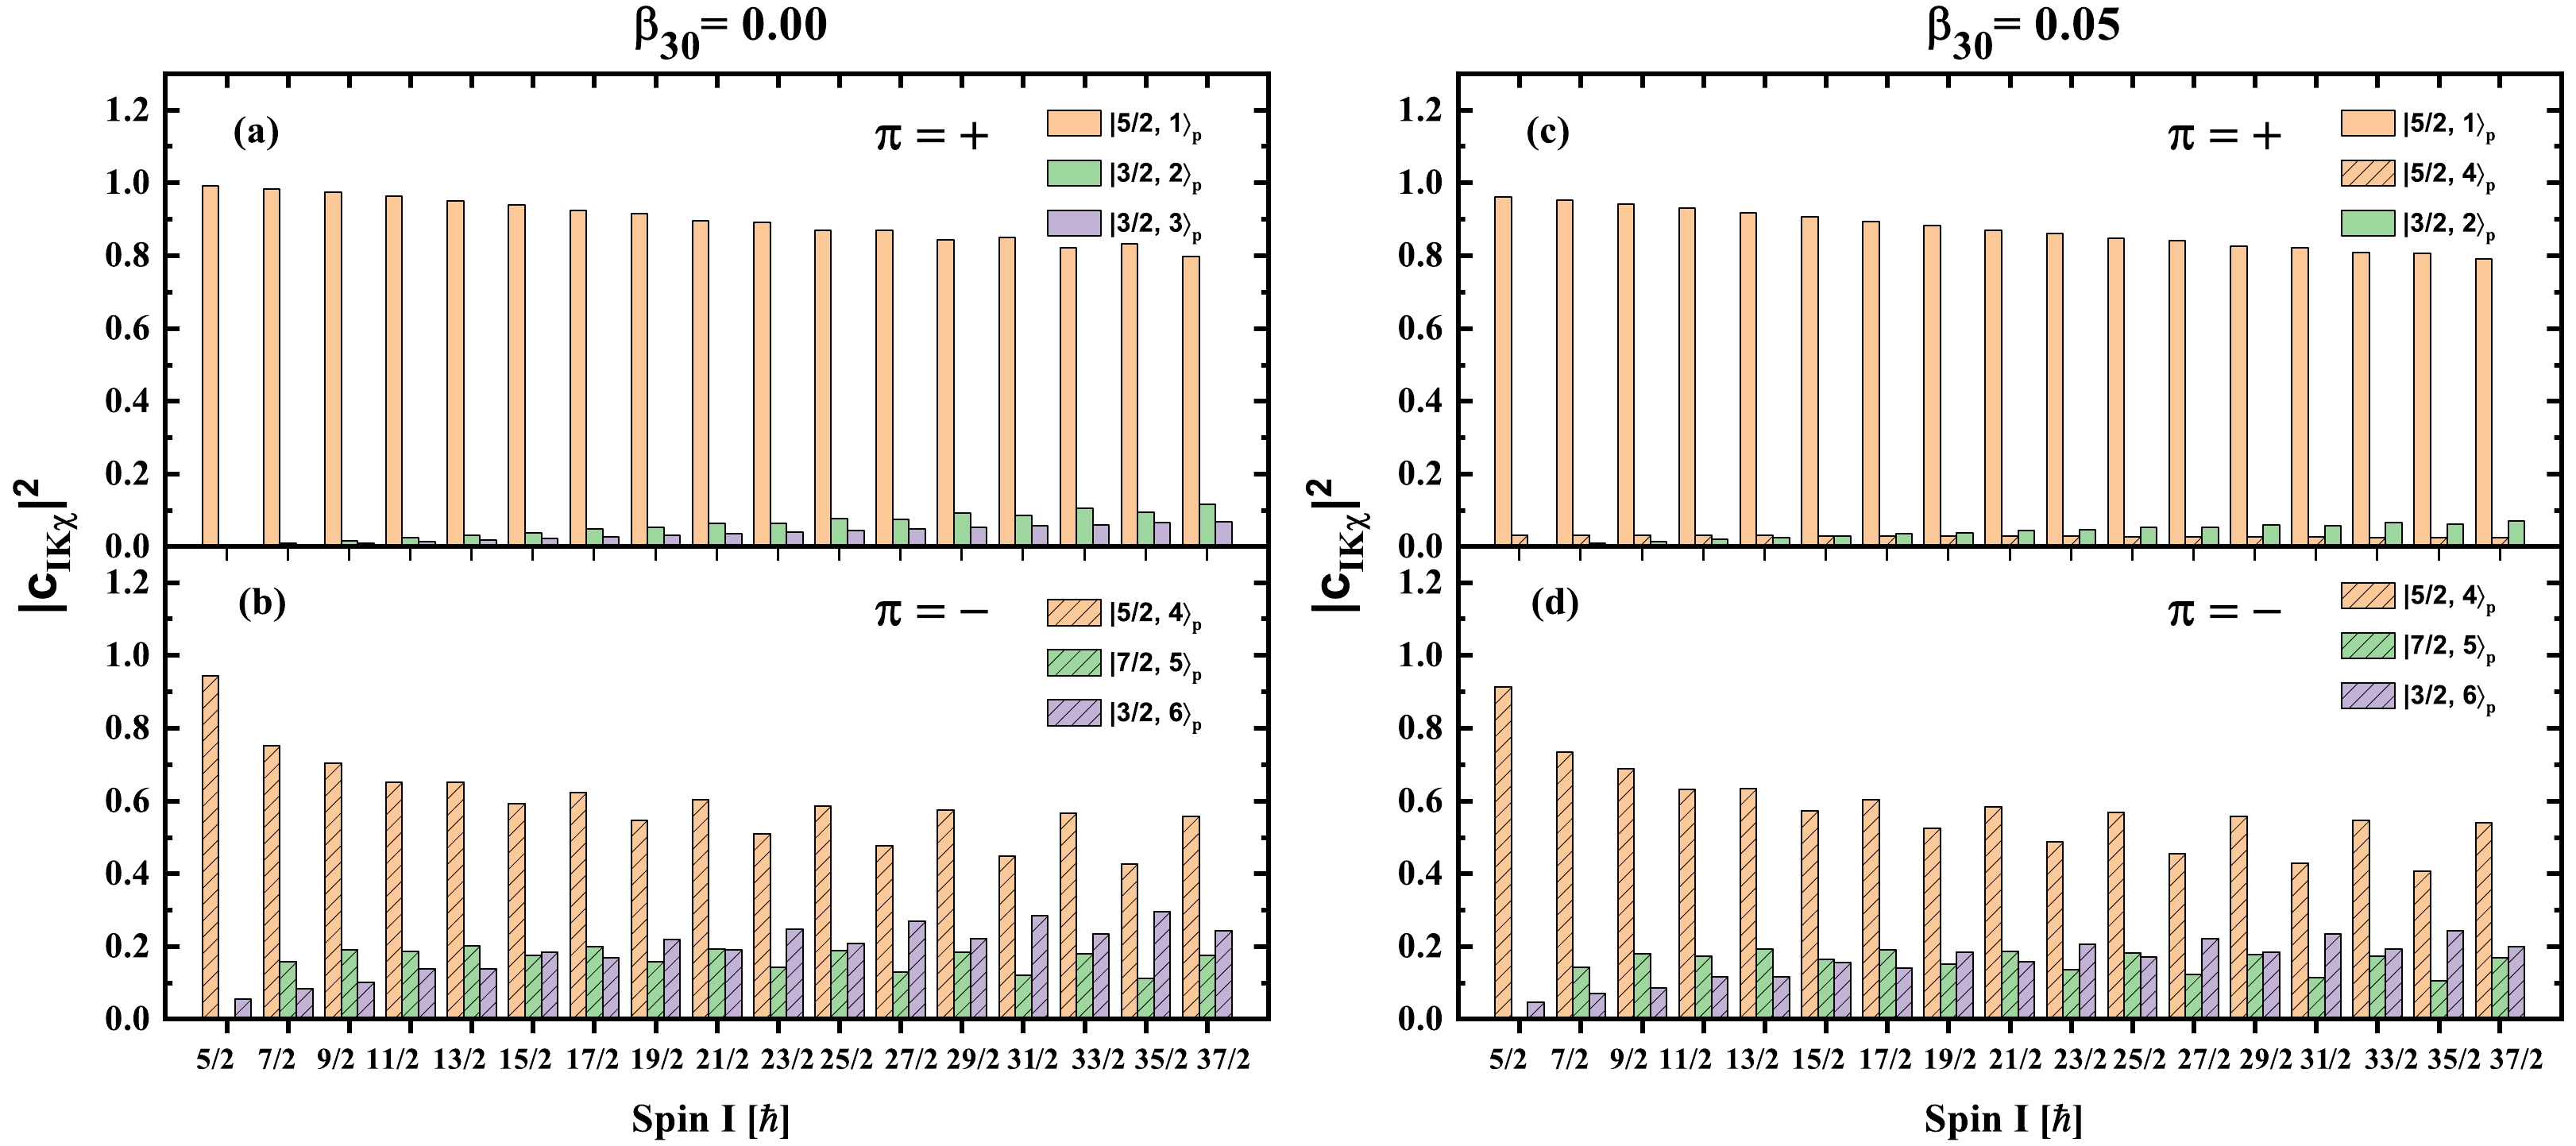
Figure 5. (color online) The main components of the intrinsic wave functions expanded in the strong-coupled basis
$|IMK\rangle\chi^\nu_p$ (denoted as$|K,\nu\rangle_p$ for short) for (a) & (c) the positive-parity band$\pi=+$ and (b) & (d) negative-parity band$\pi=-$ within spin region$\frac{5}{2}\hbar \le I\le \frac{37}{2}\hbar$ with$\beta_{30}=0.00$ (left plane) and$\beta_{30}=0.05$ (right plane).$|IMK\rangle$ is the Wigner function with I, M, and K being the quantum numbers of the total angular momentum and its projections along the third axis in the laboratory frame and intrinsic frame, respectively. The$\chi^\nu_p$ represent the intrinsic wave functions of the proton single-particle level$|\nu\rangle_p$ obtained by diagonalizing the reflection-asymmetric Nilsson Hamiltonian.To understand why the octupole deformation
$ \beta_{30} $ inherently results in a different performance of$ B(E1) $ , as shown in Fig. 4, we further examine the main spherical harmonic oscillator components of the single-particle levels$ |1\rangle_p $ and$ |4\rangle_p $ of the proton for$ \beta_{30} = 0.00 $ and$ \beta_{30}\ne0.00 $ . When$ \beta_{30} = 0.00 $ , the parity is a good quantum number and the spherical components with different parities cannot mix. The positive-parity level$ |1\rangle_p $ has the dominant component$ g_{7/2} $ , mixed with components such as$ i_{11/2} $ and$ d_{5/2} $ . The negative-parity level$ |4\rangle_p $ has the dominate component$ h_{11/2} $ , mixed with components such as$ j_{15/2} $ and$ f_{7/2} $ . When$ \beta_{30}\ne 0.00 $ , the parity is no longer a good quantum number and the spherical components with different parities can mix with each other. The level$ |1\rangle_p $ dominated by$ g_{7/2} $ is mixed with the opposite parity component$ h_{11/2} $ , while the level$ |4\rangle_p $ dominated by$ h_{11/2} $ is mixed with$ g_{7/2} $ . Although only the intrinsic valence particle part in Eq. (3) contributes to the$ E1 $ transitions for$ \beta_{30} = 0.00 $ , the intrinsic and collective parts contribute to the transitions for$ \beta_{30}\ne0.00 $ . For the intrinsic part, the intrinsic components that can contribute nonzero$ E1 $ single-particle matrix elements change a little as$ \beta_{30} $ increases, resulting in the nearly unchanged single-particle contribution of$ E1 $ transitions, as shown in Fig. 4. For the collective part, the$ E1 $ transitions can be enhanced by the matrix element between the largest component$ g_{7/2} $ in$ |1\rangle_p $ , the same component$ g_{7/2} $ mixed in$ |4\rangle_p $ , that between the largest component$ h_{11/2} $ in$ |4\rangle_p $ , and the same component$ h_{11/2} $ mixed in$ |1\rangle_p $ , etc. Since the probabilities of these matrix elements become significant as$ \beta_{30} $ increases, the contributions of the collective part will dominate the$ B(E1) $ for a large$ \beta_{30} $ value, as shown in Fig. 4(b) for$ \beta_{30} = 0.05 $ .In Ref. [31], the octupole correlations of the observed low-lying
$ K = 5/2^\pm $ positive- and negative-parity structures in nucleus$ ^{151} {\rm{Pm}}$ , the$ N = 90 $ isotonic neighbor of$ ^{153} {\rm{Eu}}$ , have been investigated. The observed doublet bands in$ ^{151} {\rm{Pm}}$ and$ ^{153} {\rm{Eu}}$ show quite similar characteristics in both the energy spectra of positive- and negative-parity bands, the enhanced interband$ E1 $ transitions, and in their different g factors of the opposite-parity states in the two bands. The similarity of the two nuclei suggests the same origin for these experimental characteristics. Based on the RAT-PRM calculations, the observed nearly-degenerate positive- and negative-parity bands in$ ^{153} {\rm{Eu}}$ and$ ^{151} {\rm{Pm}}$ can be interpreted as two separate bands based on a substantial reflection-asymmetric core and two individual proton configurations. This interpretation differs with the parity doublet bands built on a single parity-mixed configuration, e.g., that observed in$ ^{223} {\rm{Th}}$ [32]. Further systematic studies of interest include the observed parity doublet bands and comparisons of the parity doublet bands built on a single parity-mixed configuration and those on two different configurations in the$ A\sim 150 $ mass region. Notably, although the deformation parameters from the microscopic CDFT are adopted, some free parameters still exist in the present RAT-PRM, such as the core parity splitting parameter$ E(0^-) $ and the moment of inertia for reproducing the experimental data. Further combination with the microscopic theory, such as the cranking CDFT and the beyond mean-field approach in the future, is relevant to constrain these parameters. -
In summary, a reflection-asymmetric triaxial particle rotor model has been used to investigate the octupole correlations of the observed low-lying
$ K = 5/2^\pm $ positive- and negative-parity bands in the stable nucleus$ ^{153} {\rm{Eu}}$ . The energy spectra, energy staggering parameters, and intraband$ E2 $ and$ M1 $ transition probabilities are well reproduced by the RAT-PRM calculations. The calculated interband$ B(E1) $ values with$ \beta_{30} = 0.00 $ generally underestimate the experimental data. The calculated$ B(E1) $ values are found to depend sensitively on the octupole deformation parameter$ \beta_{30} $ , which can be enhanced up to approximately two orders of magnitude by changing$ \beta_{30} $ from 0.00 to 0.07. With increasing octupole deformation$ \beta_{30} $ , the calculated$ B(E1) $ values increase, showing good agreement with the experimental data for the$ \beta_{30} = 0.05 $ case, which indicates that only the single-particle contributions are unable to account for the large$ E1 $ transitions observed in$ ^{153} {\rm{Eu}}$ . By analyzing the main components of the RAT-PRM wave functions, the nearly degenerate positive- and negative-parity bands can be described by the bands based on two individual proton configurations, i.e.,$ \pi g_{7/2}[\Omega = 5/2] $ and$ \pi h_{11/2}[\Omega = 5/2] $ , respectively. This interpretation is the same as that for the isotonic neighbor$ ^{151} {\rm{Pm}}$ but differs from the parity doublet bands built on a single parity-mixed configuration.
Octupole correlations in stable nucleus 153Eu within reflection-asymmetric particle rotor model
- Received Date: 2024-07-29
- Available Online: 2025-01-15
Abstract: The observed low-lying


 Abstract
 HTML
HTML Reference
 Related
 PDF
PDF






 DownLoad: