


 Abstract
 HTML
HTML Reference
 Related
 PDF
PDF


-
The existence of dark matter (DM) in the Universe has been confirmed by various cosmological and astrophysical observations. The weakly interacting massive particle (WIMP), with the typical mass at weak scale [1, 2], exhibits naturally correct thermal relic density, and thereby, is considered as the prevalent DM candidate. However, the current null results of searching for WIMPs in collider and (in)direct detection experiments have led to strong bounds on many WIMP DM models [3−7]. Hence, it is essential to investigate other possibilities and develop new detection technologies to explore the light DM with mass from keV to GeV (see recent reviews, e.g. [8−10]).
However, given the nuclear recoil signals, induced by light DM-nucleus scattering well below the threshold of DM direct detection experiments, light DM direct detection requires experiments with a lower threshold. Among these experiments, the New Experiments with Spheres-Gas (NEWS-G), using a Spherical Proportional Counter (SPC), can reach an extremely low energy threshold. It comprises a grounded copper shell and an anode in the center [11−15], where a high-voltage electric field exists between the anode and metal casing. The cavity can be filled with gas target materials, such as helium, neon, argon, and xenon. The main operating principle of the SPC is that the DM arriving in the cavity may lead to electron ionization via the interaction between DM and target material. The ionized electrons drift toward the anode under the action of a high-voltage electric field and can eventually be detected by the sensor, which is connected to the anode. The first detector of the NEWS-G collaboration, located in the Laboratoire Souterrain de Modane with a diameter of 60 cm, achieved excellent exclusion limits on the DM-nucleus cross section
$ \bar{\sigma}_{n} $ for a DM mass of approximately 0.5 GeV [13].In this study, we investigate the prospects of detecting sub-GeV DM via the Migdal effect in the NEWS-G experiment with 3-meter-diameter DARKSPHERE detector, which is initially scheduled to operate in 2025. Deviating from the conventional DM direct detection experiments, the Migdal effect with lower threshold can play an important role in light DM direct detection [16−30]. Given that the first phase of the NEWS-G experiment packed with Neon produced the competitive limits, we will compare the performance of xenon and neon as target materials. Furthermore, the DM velocity distribution has a significant impact on DM direct detection [31−38]. Therefore, we also examined the dependence of the events generated by Migdal effect on three different DM velocity distributions and obtain the exclusion limits on
$m_{\rm DM}-\bar{\sigma}_{n}$ panel with respect to four different DM form factors$F_{\rm DM}$ .The remainder of our paper is organized as follows. In Sec. II, we recapitulate the computational framework of the Migdal effect in DM direct detection. In Sec. III, we discuss three different DM velocity distribution models and their possible impacts on the calculation results. In Sec. IV, we calculate differential event rates and compare differential event rates under various DM velocity distribution models. We show our expected exclusion limits on the
$m_{\rm DM}-\bar{\sigma_{n}}$ plane. Finally, we draw some conclusions in Sec. V. -
We commence by introducing the Migdal effect differential cross-section for nuclear recoil energy
$ E_{R} $ and electron recoil energy$ E_{e} $ [16, 39−46] as follows:$ \begin{aligned}[b] \frac{{\rm d}\sigma}{{\rm d} E_R {\rm d} E_{e}}\simeq & \frac{1}{32\pi}\frac{m_N}{\mu_N^2 v_{\rm DM}^2}\frac{|F_N(q)|^2|M(q)|^2}{(m_N +m_{\rm DM})^2}\\&\times\frac{\rm d}{{\rm d} E_{e}}\sum\limits_F|Z_{FI}(q_e)|^2, \end{aligned} $

(1) Furthermore, the invariant amplitude is squared as follows:
$ \begin{equation} M(q)^2=(f_n (A-Z)+Z f_p)^2\times \overline{M(q)^2}. \end{equation} $

(2) where
$\mu_{N} = m_{\rm DM}m_{N}/\left({m_{\rm DM} + m_{N}}\right)$ denotes the DM-nucleus reduced mass and$v_{\rm DM}$ denotes the velocity of the incoming DM particles.$ |F_N(q)|^2 $ denotes the nuclear form factor, and q and$ q_{e} $ denote the nuclear and electron transfer momentum, respectively. Furthermore, A and Z denote the mass number of atoms and atomic number, respectively. Additionally,$ f_{p} $ ($ f_{n} $ ) denotes the dimensionless couplings of DM interacting with proton (neutron).$ \overline{M(q)^2} $ represents the amplitude of DM scattering off a free nucleon.$ Z_{FI}(q_e) $ denotes the electron cloud transition factor, related to the electron ionization/excitation probability. Moreover,$\sum\nolimits_F$ denotes the sum of all possible final states wave functions of electrons. It should be noted that the Migdal effect differential cross-section is dependent on the DM-nucleus elastic cross-section and electron cloud transition factor. We rewrite the Migdal effect differential cross-section by exploiting the commonly defined reference cross section$ \bar{\sigma}_{n} $ and DM form factor$|F_{\rm DM}(q)|$ as follows:$\begin{aligned}[b] \frac{{\rm d}\sigma}{{\rm d} E_R {\rm d} E_{e}}\simeq& \frac{1}{2}\frac{m_N}{\mu_N^2 v_{\rm DM}^2} (f_n (A-Z)+Z f_p)^2 \bar{\sigma}_{n} |F_N(q)|^2\\&\times|F_{\rm DM}(q)|^2 \frac{\rm d}{{\rm d} E_{e}}\sum\limits_F|Z_{FI}(q_e)|^2 \end{aligned} $

(3) with
$ \begin{equation} \bar{\sigma}_n=\frac{\overline{|M(q=q_0)|^2} \mu_N^2}{16\pi m_{\rm DM}^2 m_N^2}, \end{equation} $

(4) $ \begin{equation} |F_{\rm DM}(q)|^2=\frac{\overline{|M(q)|^2}}{\overline{|M(q=q_0)|^2}}, \end{equation} $

(5) where
$ q_{0}=\alpha m_{e} $ denotes the reference momentum. The information related to transfer momentum, which is q-dependent, is incorportaed within the DM form factor. Notably, the DM form factor$|F_{\rm DM}(q)|$ equals to 1 ($ \left(\alpha m_{e}/q\right)^2 $ ) for a light (heavy) mediator.In the following, we will focus closely on the electron cloud transition factor
$ Z_{FI}(q_e) $ [16, 47] described by$ \begin{aligned}[b] \sum\limits_F |Z_{FI}|^2=&|Z_{II}|^2+\sum\limits_{n,l,n',l'}p_{q_e}^d(nl\to n'l')\\&+\sum\limits_{n,l}\int\frac{{\rm d} E_e}{2\pi}\frac{\rm d}{{\rm d} E_e}p_{q_e}^c(nl\to E_e), \end{aligned} $

(6) where
$ \{n,l\} $ and$ \{n',l'\} $ denote the energy levels of the electrons bound to the target atom before and after scattering, respectively. Furthermore,$ p_{q_e}^c $ and$ p_{q_e}^d $ denote the ionization and excitation probabilities of electrons.$ |Z_{II}|^2 $ represents the probability that the electrons are not affected by the DM-nucleus scattering process. The second term implies the probability of exciting the electrons from the energy level$ \{n,l\} $ to$ \{n',l'\} $ , while the third term implies the probability of ionizing the electrons bound to the energy level$ \{n,l\} $ after DM-nucleus scattering. The ionization and excitation probabilities are discussed in detail in Refs. [16], which reveals that the possibility of ionization can be orders of magnitude larger than that of excitation. In the following calculation, we simply consider the ionization probability. By defining the term related to the ionization probability,$ \begin{equation} \frac{{\rm d} p_{nl\to E_e}}{{\rm d}{\rm ln} E_e}=\frac{\pi}{2}|f_{nl}^{\rm ion}(E_e,q_e)|^2, \end{equation} $

(7) we can derive the differential cross section of Migdal effect as follows:
$ \begin{aligned}[b] \frac{{\rm d}\sigma}{{\rm d} E_R {\rm d} E_{e}}=&\frac{\bar{\sigma}_n m_N (f_n(A-Z)+Zf_p)^2}{8\mu_N^2 v_{\rm DM}^2}|F_N(q)|^2\\&\times|F_{\rm DM}(q)|^2\sum\limits_{n,l} \frac{|f^{\rm ion}_{n,l}(E_e,q_e)|^2}{E_e}, \end{aligned} $

(8) where
$|f^{\rm ion}_{n,l}(E_e,q_e)|$ denotes the ionization factor and$ q_{e} \simeq \frac{m_{e}}{m_{N}} q $ denotes the momentum of electrons after scattering. By approximating the ionized electrons with Cowan's Hartree-plus-statistical-exchange method [48], the ionization function$|f^{\rm ion}_{n,l}(E_e,q_e)|$ can be written as follows:$ \begin{equation} |f^{\rm ion}_{n,l}(E_e,q)|^2= \left \langle\int\mathrm{d}\Omega_{k_e}\frac{2k^3_e}{8\pi^3} \times \bigg|\int\mathrm{d^3}x \psi_f^*({\boldsymbol{x}},{\boldsymbol{k_e}}) {\rm e}^{{\rm i}{\boldsymbol{q}}\cdot{\boldsymbol{x}}}\psi_i({\boldsymbol{x}})\bigg|^2 \right\rangle, \end{equation} $

(9) where
$ k_{e}=\sqrt{2m_e E_e} $ denotes the momentum of the unbound electron after scattering. The angled brackets indicate that a uniform average over all orientations of the atom is considered.To obtain the differential events as a function of
$ E_{e} $ , we should integrate over the nuclear recoil energy$ E_{R} $ , which can be replaced by integrating over the transfer momentum q. For a given energy level$ \{n,l\} $ , the expression for the differential event rates, as a function of$ E_{e} $ with units$ \rm{ton}^{-1}\cdot {\rm year}^{-1}\cdot {\rm keV}^{-1} $ can be expressed as [8, 23, 49−51]:$ \begin{equation} \frac{{\rm d} R_{n,l}}{{\rm d} E_e}=N_T\frac{\rho_{\rm DM}}{m_{\rm DM}}\frac{{\rm d}\langle\sigma_{n,l}^{\rm ion}v\rangle}{{\rm d} E_e}, \end{equation} $

(10) with
$ \begin{aligned}[b]& \frac{\mathrm{d}\langle \sigma _{n,l}^{\rm ion} v\rangle}{\mathrm{d}E_e}=\frac{\bar{\sigma }_n}{8\mu _n^2 E_e}(f_n (A-Z)+Z f_p)^2\int_{q_-}^{q_+}\mathrm{d}q \\ &\times\Bigg[q|F_{\rm DM}(q)|^2|F_N(q)|^2| f_{nl}^{\rm ion}(E_e,q_e)|^2\eta (v_{\min }(q,\Delta E_{n,l}))\Bigg] , \end{aligned} $

(11) and
$ \begin{equation} \eta(v_{\rm min}(q,\Delta E_{n,l}))=\int_{v_{\rm min}(q,\Delta E_{n,l})}^{v_{\max}}\frac{f(v_{\rm DM})}{v_{\rm DM}} {\rm d} v_{\rm DM}. \end{equation} $

(12) where
$ N_T $ denotes the number density of target materials and$\rho_{\rm DM} =0.3$ GeV/cm$ ^3 $ denotes the energy density of the halo DM [52−59]. Furthermore,$ \Delta E_{n,l} $ denotes the deposited energy of the electron, and$\eta (v_{\min }(q,\Delta E_{n,l}))$ denotes the usual velocity average of the inverse speed. Furthermore,$f(v_{\rm DM})$ denotes the velocity distribution of DM. Given that the differential event rates depend on$f(v_{\rm DM})$ [36], we consider different velocity distribution models including the standard halo model (SHM) [60−64], Tsallis model (Tsa) [65−68], and empirical model (Emp) [69−72] in the next section (section III). Furthermore, the incoming DM velocity$v_{\rm DM}$ satisfies the energy-momentum conservation conditions as follows:$ \begin{equation} \Delta E_{n,l}= \frac{1}{2} m_{\rm DM} v_{\rm DM}^2 -\frac{|m_{\rm DM} \bf{v}-\bf{q}|^2}{2 m_{\rm DM}}-\frac{\bf{q}^2}{2 m_{N}}, \end{equation} $

(13) where
$ \Delta E_{n,l}=E_e +|E_{n,l}| $ and$ |E_{n,l}| $ denote the bound energy of the$ \{n,l\} $ state. For a given transfer momentum q and electron recoil energy$ E_{e} $ , we can derive the minimum velocity of the incoming DM particle [73] as follows:$ \begin{equation} v_{\min}(q,\Delta E_{n,l})=\frac{q}{2 \mu_{N}}+\frac{E_e +|E_{n,l}|}{q}. \end{equation} $

(14) Additionally,
$ q_{-} $ and$ q_{+} $ can be obtained by Eq. (14) as follows:$ \begin{equation} q_{\mp}=\mu_{N} v_{\max} \left(1 \mp \sqrt{1-\frac{E_e + |E_{n,l}|}{\dfrac{1}{2} \mu_{N} v_{\max}^2}}\right). \end{equation} $

(15) By performing the Taylor expansion on Eq. (15), we can derive the minimum of the transfer momentum
$ q_{-} $ $ \begin{equation} q_-\sim \frac{E_e +|E_{n,l}|}{v_{\max}}. \end{equation} $

(16) Given that the binding energy of xenon 5p
$ |E_{5p}|\sim $ 12.7 eV and$v_{\max}\sim$ 760 km/s, the transfer momentum$ q_{-} $ is typically at the keV scale. However,$ q_{e} $ is well below 1 keV due to$ q_e \simeq m_{e} q/m_{N} $ being highly suppressed by$ m_{e}/m_{N} $ . Therefore, we assume the dipole approximation for the ionization function in$ q_{e}<1 $ keV region, which can be expressed as follows:$ \begin{equation} |f^{\rm ion}_{n,l}(E_e,q_e)|^2=\frac{q_e^2}{(1\; {\rm keV})^2}|f_{\rm ion}^{i\to f}(E_e,q_e=1 \; {\rm keV})|^2 (q_e<1 \; {\rm keV}). \end{equation} $

(17) -
The velocity distribution of DM plays a crucial role in the direct detection of DM. Previous studies indicated that different velocity distributions will significantly impact the DM-electron scattering process. As discussed in Ref. [36], DM-electron scattering relies on the various velocity distributions of the DM halo, particularly on their significantly different high-velocity tails. The Migdal effect pertains to the electron recoil energy. Hence, we examine the diverse velocity distributions within the Migdal effect, potentially enhancing the constraints on the DM-nucleus cross-section derived from the NEWS-G experiment. Moreover, we initially explore the influence of the Migdal effect influence on sub-GeV DM direct detection using the DARKSPHERE detector in the NEWS-G experiment. Hence, we assess how different DM velocity distribution models affect the Migdal effect. Notably, the most prevalent model for DM direct detection is the SHM. In this model, the DM velocity distribution adheres to a Maxwell-Boltzmann distribution in the Earth's frame and is characterized by
$ \begin{equation} f_{\rm SHM}(\vec v)=\frac{1}{K} {\rm e}^{-|\vec v +\vec v_E|^2/v_0^2}\Theta(v_{\rm esc}-|\vec v +\vec v_{\rm E}|), \end{equation} $

(18) with the normalization coefficient
$ \begin{equation} K=v_0^3 \left(\pi^{\frac{3}{2}} {\rm erf}(\frac{v_{\rm esc}}{v_0})-2\pi \frac{v_{\rm esc}}{v_0} {\rm e}^{\textstyle-\frac{v_{\rm esc}^2}{v_0^2}}\right), \end{equation} $

(19) where
$v_{\rm esc}=528$ km/s corresponds to the escape velocity [28, 36, 74−76],$v_{\rm E}=232$ km/s is the Earth's Galactic velocity [77, 78], and$ v_0=228.6 $ km/s is the typical velocity of Maxwell-Boltzmann distribution [31]. Furthermore, K denotes the normalization coefficient that makes the velocity distribution function satisfy$\int f_{\rm SHM}(v)\mathrm{d}^3v=1$ , and Θ function is a step-function. Second, the Tsallis model is proposed to explain the data of the N-baryon numerical simulation and non-extensive systems. The DM velocity distribution in the Tsallis model is given by$ \begin{equation} f_{\rm Tsa}(\vec v)\propto \left\{ \begin{array}{cc} \Bigg[1-(1-s)\dfrac{\vec v ^2}{v_0^2}\Bigg]^{1/(1-s)} & |\vec v|<v_{\rm esc}, \\ 0 & |\vec v|\geq v_{\rm esc}, \end{array}\right. \end{equation} $

(20) where
$ s=0.813 $ denotes the entropic index [36]. Finally, the empirical model with a hydro-dynamical approach utilizes numerical techniques to examine the behavior of DM components in the presence of baryons and exhibits the following DM velocity distribution,$ \begin{equation} f_{\rm Emp}(\vec v)\propto \left\{ \begin{array}{cc} {\rm e}^{\textstyle-|\vec v|/v_0 (v_{\rm esc}^2-|\vec v|^2)^p} & |\vec v|<v_{\rm esc} \\ 0 & |\vec v|\geq v_{\rm esc} \end{array}\right. , \end{equation} $

(21) We consider index
$ p=1.5 $ in the following calculation and consider the impact of Earth's Galactic velocity in the latter two models.Specifically,
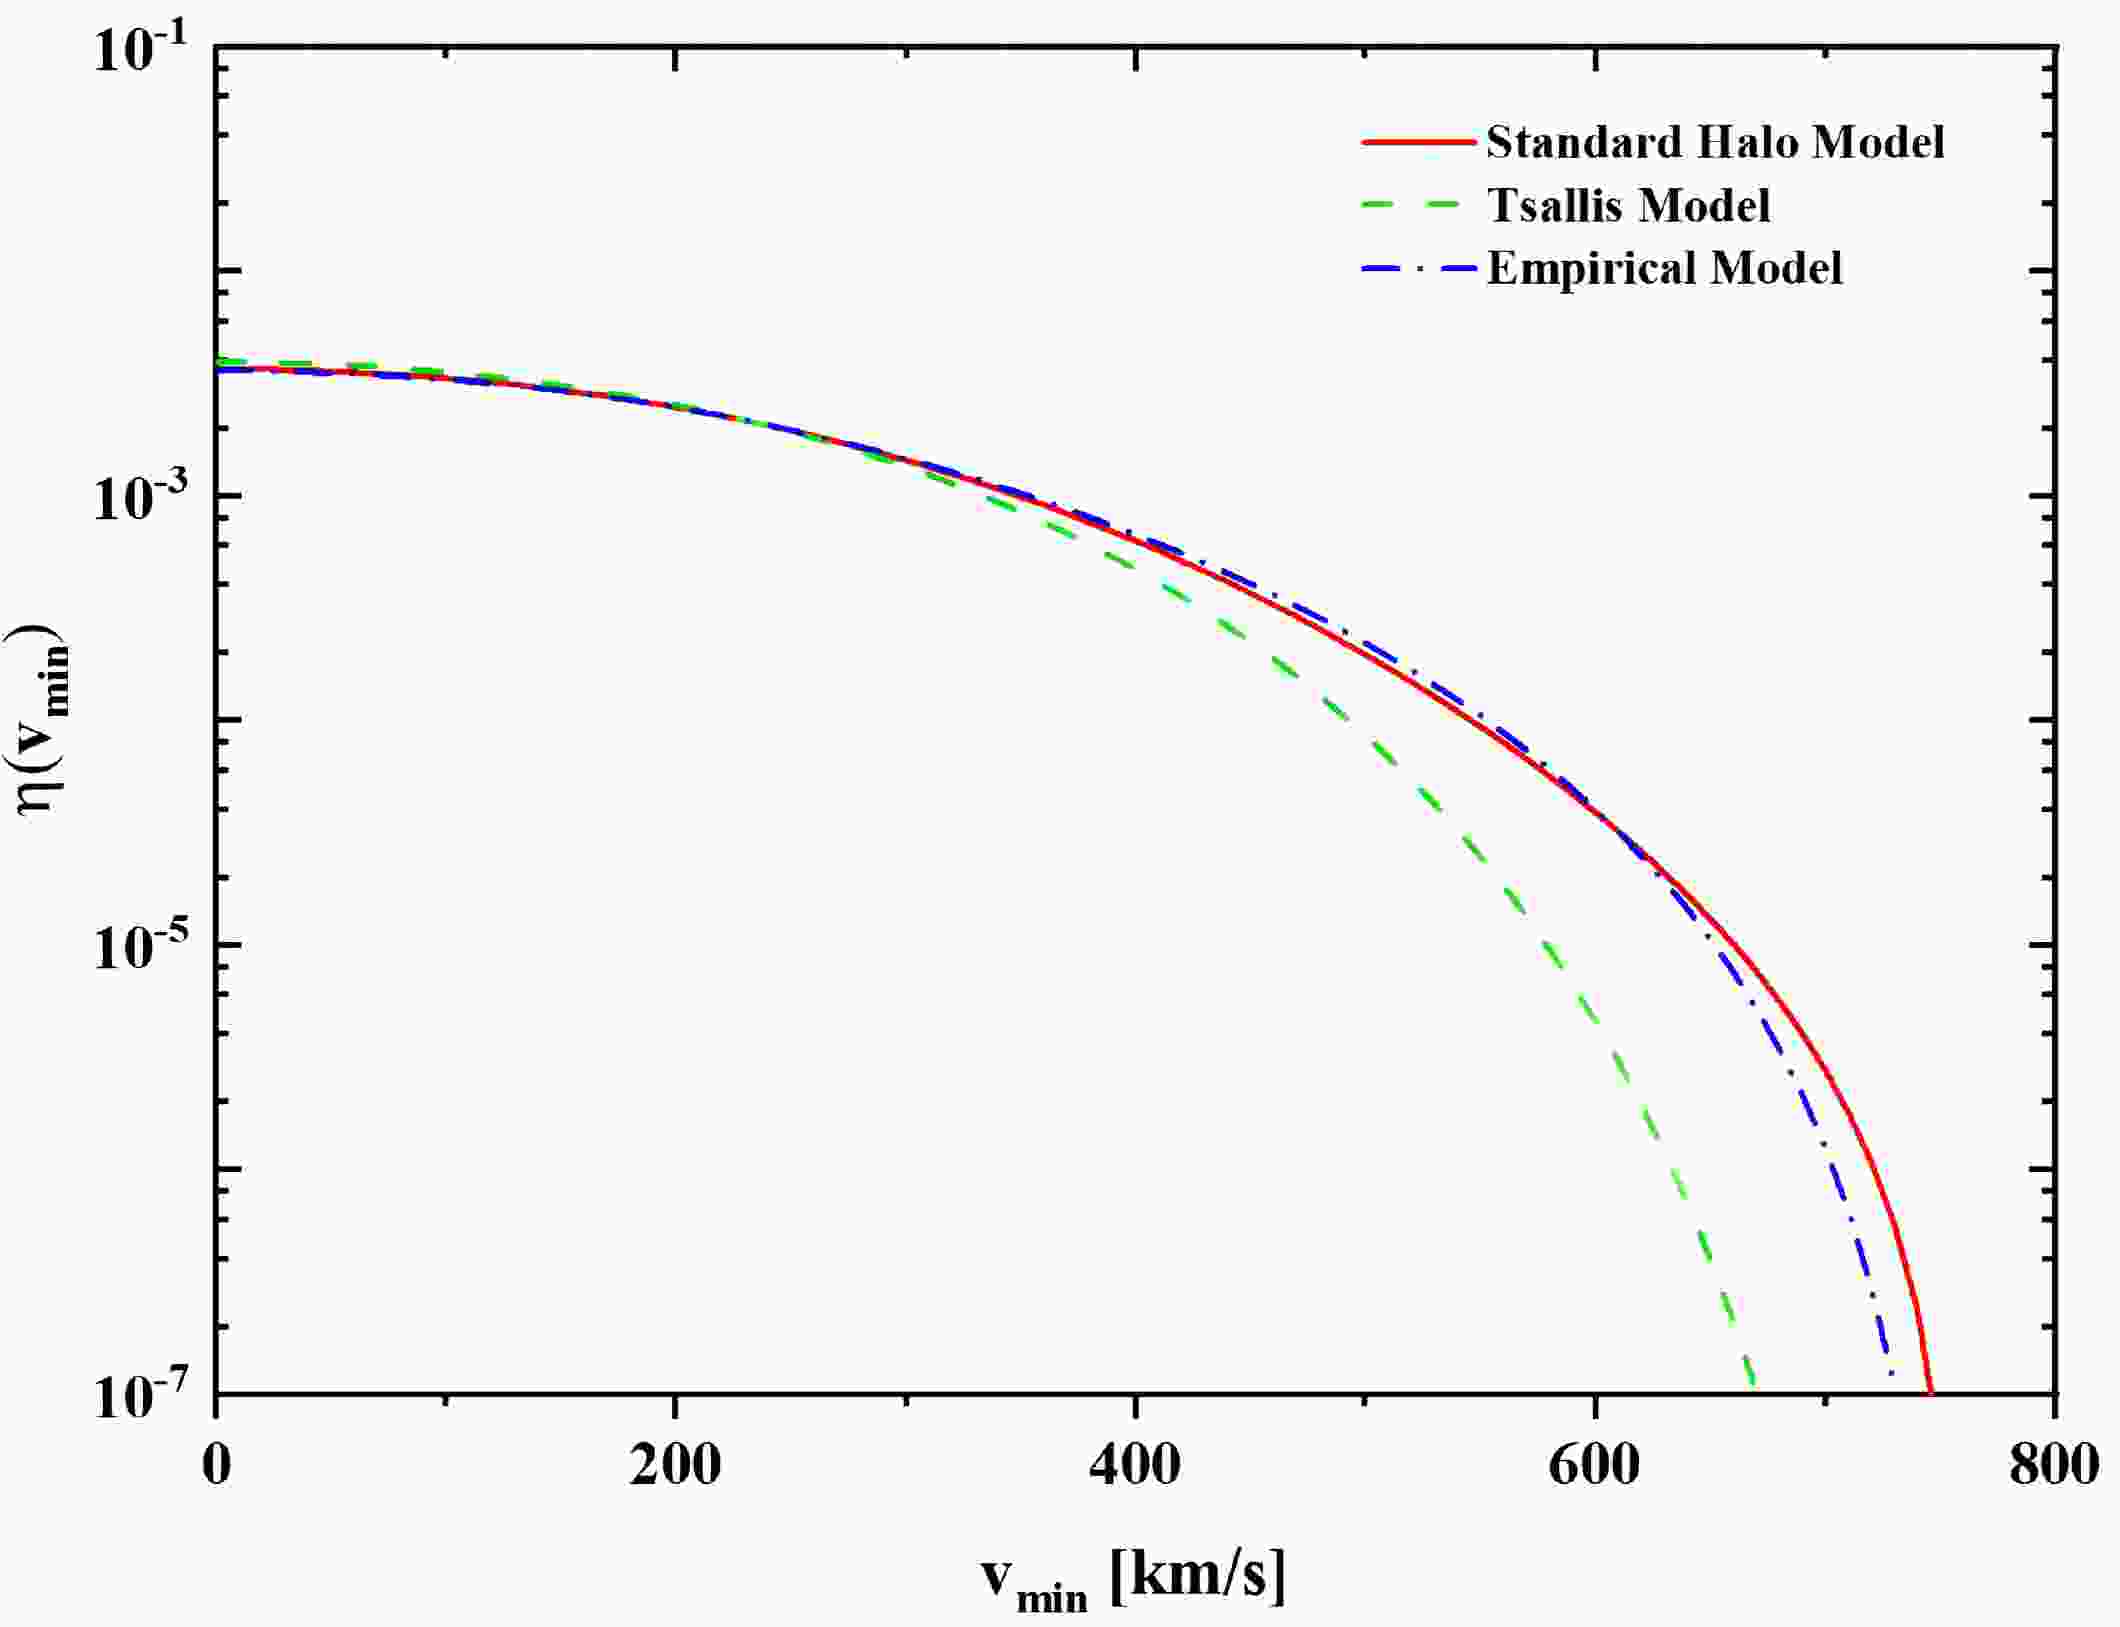
$\eta(v_{\min})$ of the three different DM velocity distributions, as a function of$v_{\min}$ , are shown in Fig. 1. We can observe that the empirical model and SHM intially show a slight difference at$v_{\min} \approx$ 650 km/s, while the Tsallis model begins to diverge significantly from the other two models at$ v \approx $ 300 km/s. To gain insights into the impact of the different DM velocity distributions on Eq. (11), we draw a set of contour lines of$v_{\rm min}$ derived by Eq. (14) in Fig. 2.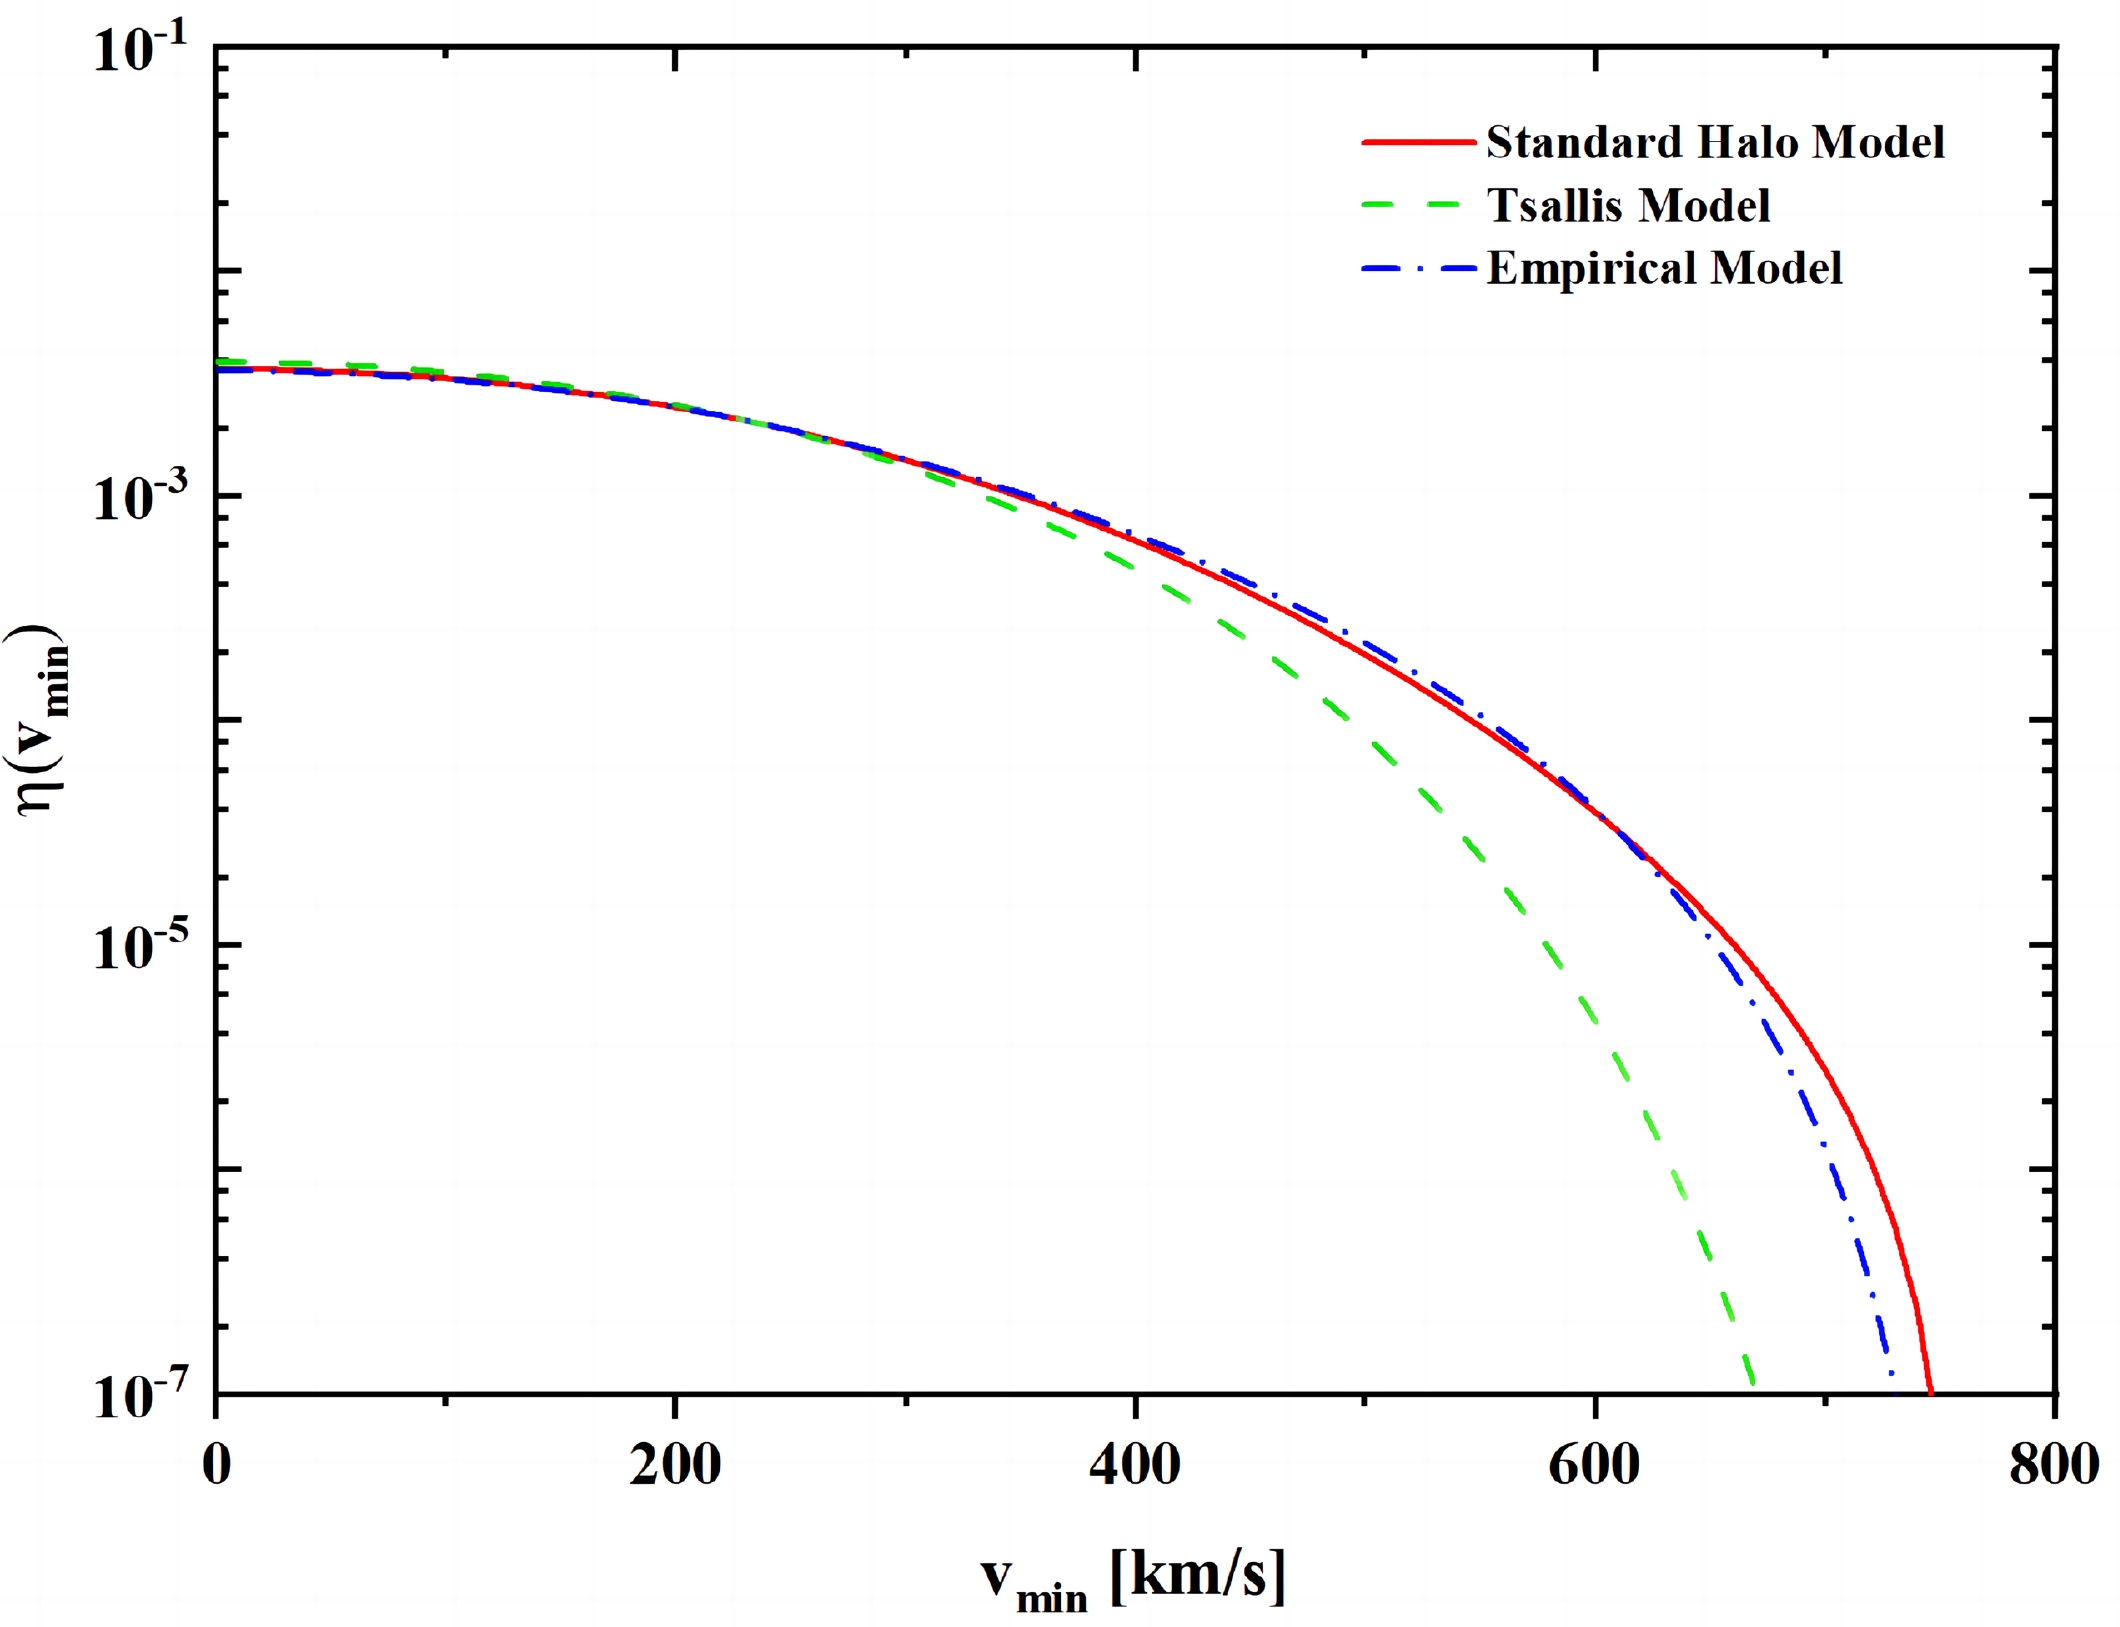
Figure 1. (color online)
$\eta(v_{\min})$ for the three aforementioned models as a function of the minimum velocity$ v_{\rm min} $ . The green dashed line represents$\eta(v_{\min})$ for the Tsallis model, red curve shows that for the SHM, and blue dot-dashed line illustrates that for the empirical model.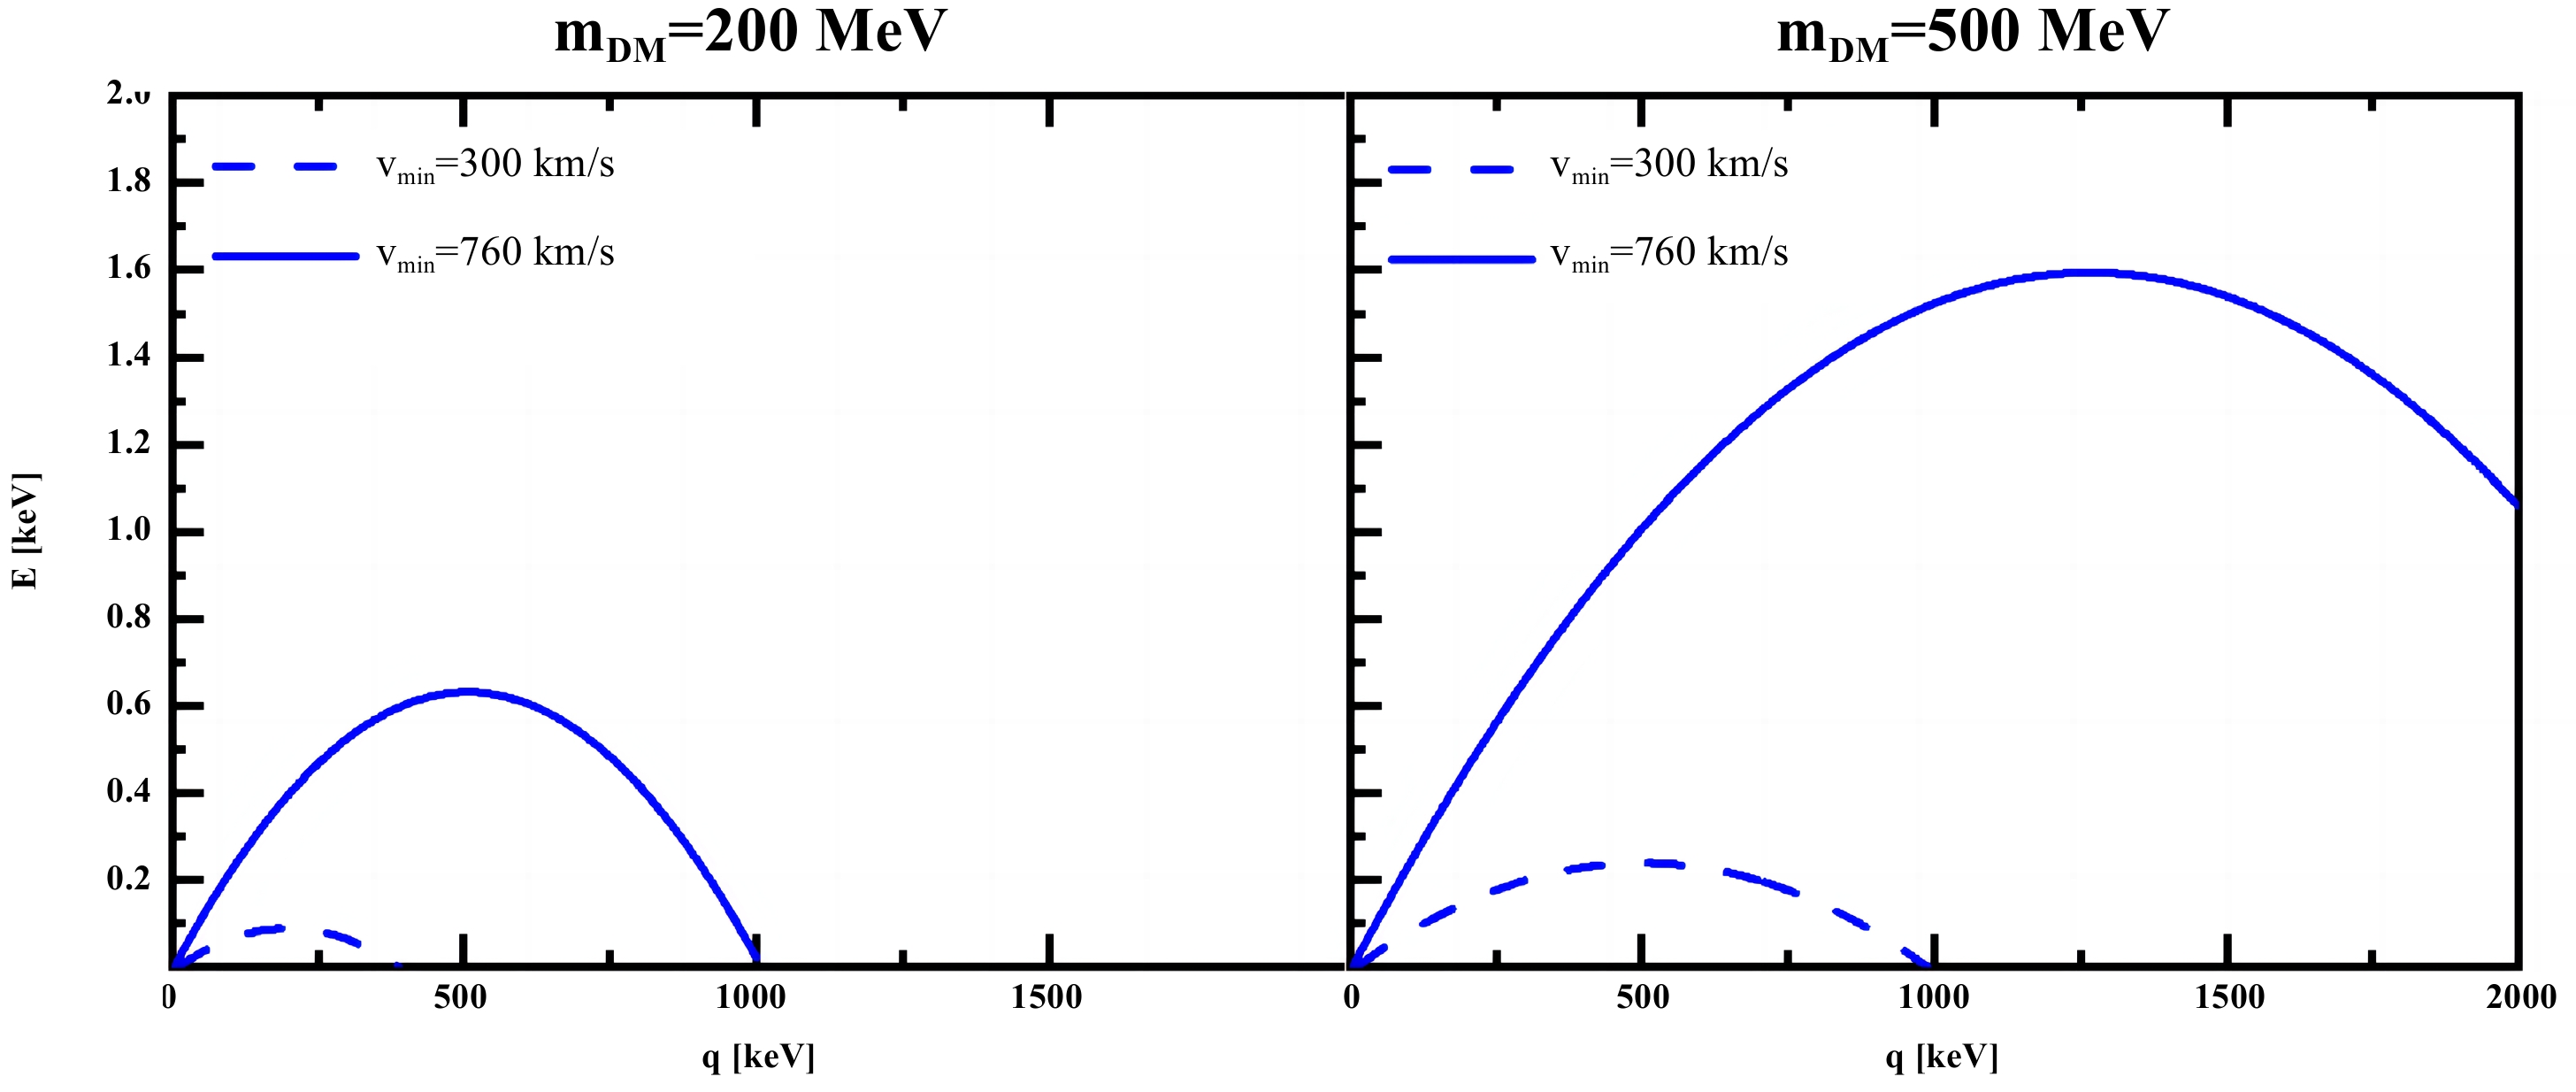
Figure 2. (color online) Contour plot of
$ v_{\min} $ as a function of transfer momentum q and the electron recoil energy$ E_e $ . In each panel, the dashed lines represent$ v_{\min} $ = 300 km/s, while the solid curves illustrate$ v_{\min} $ = 760 km/s.Figure 2 shows the contour plots of
$ v_{\min} $ with binding energy$ |E_{n,l}|=10 $ eV and two different DM masses$ m_{\rm DM}=200,~500 $ MeV. The integral region of q and$ E_{e} $ corresponds to the area where the velocity of the incoming DM$v_{\min} \leq v \leq v_{\max}=v_{\rm esc}+v_{\rm E}=760$ km/s. As shown in Fig. 2, the integral from$v_{\min}=300$ km/s to$v_{\max}=760$ km/s occupies the most q and$ E_{e} $ region. Evidently,$v_{\min}$ as a function of the transfer momentum q and electron recoil energy$ E_e $ has its lower bound$ \sqrt{2(E_e + |E_{n,l}|)/\mu_N} $ when$ q = \sqrt{2\mu_N (E_e + |E_{n,l}|)} $ . Additionally, the DM-nucleus reduced mass is approximately equal to$\mu_N \approx m_{\rm DM}$ due to$ m_{\rm DM} \ll m_N $ . Consequently, we can derive the lower bound of$ v_{\min} = \sqrt{2|E_{n,l}|/m_{\rm DM}} $ by considering electron recoil energy$ E_e=0 $ . With$ |E_{n,l}|=10 $ eV and$m_{\rm DM} < 20$ MeV, the minimum value of$v_{\min}$ will always be greater than 300 km/s. At this value, the SHM and empirical model are significantly different from the Tsallis model. Thus, it is worthwhile to consider the influence of different DM velocity distributions on the differential event rates. -
Equipped with the ionization form factors and DM velocity distributions, we employ Eq. (10) to compute the differential events stemming from the DM-nucleus Migdal effect. The differential events for both xenon and neon targets are illustrated in Fig. 3, where we assume that the DM velocity distribution satisfies the SHM. For neon (xenon) target, we consider that the electrons occupying 1s, 2s, 2p (4d, 5s, 5p) energy level are ionized. As shown in Fig. 3, the differential events for both xenon and neon targets decrease as the electron recoil energy
$ E_{e} $ increases because the ionization factor$|f^{\rm ion}_{n,l}(E_e,q_e)|$ is suppressed by large$ E_{e} $ . Furthermore, although they are significantly enhanced by$ 1/m_{T} $ , the differential event rates induced by the xenon target are larger than those generated by the neon target in the small$ E_{e} $ region. However, the opposite occurs in the large$ E_{e} $ region. Owing to the fact that the binding energy (12.7 eV) of the outermost level 5p of xenon is lower than that of neon (21.7 eV), the ionization factor$|f^{\rm ion}_{n,l}(E_e,q_e)|$ for xenon 5p energy level is significantly larger than that for neon 2p energy in small$ E_{e} $ region. Furthermore, the total ionization factor for neon dominates over that for xenon in the large$ E_{e} $ region. This implies that xenon, as the target material, exhibits better performance for lower experimental thresholds. Additionally, compared with the light DM, the heavy DM generates more events for the same target DM form factor$F_{\rm DM}$ and cross section$ \bar{\sigma}_{n} $ . This is because heavy DM has more kinetic energy to induce more electron ionization. It should be noted that a small peak exists around$ E_e \sim 2.5 $ eV in the differential events of the xenon target, which is due to the small peak in the ionization function$|f^{\rm ion}_{n,l}(E_e,q_e)|$ of the xenon 4d energy level.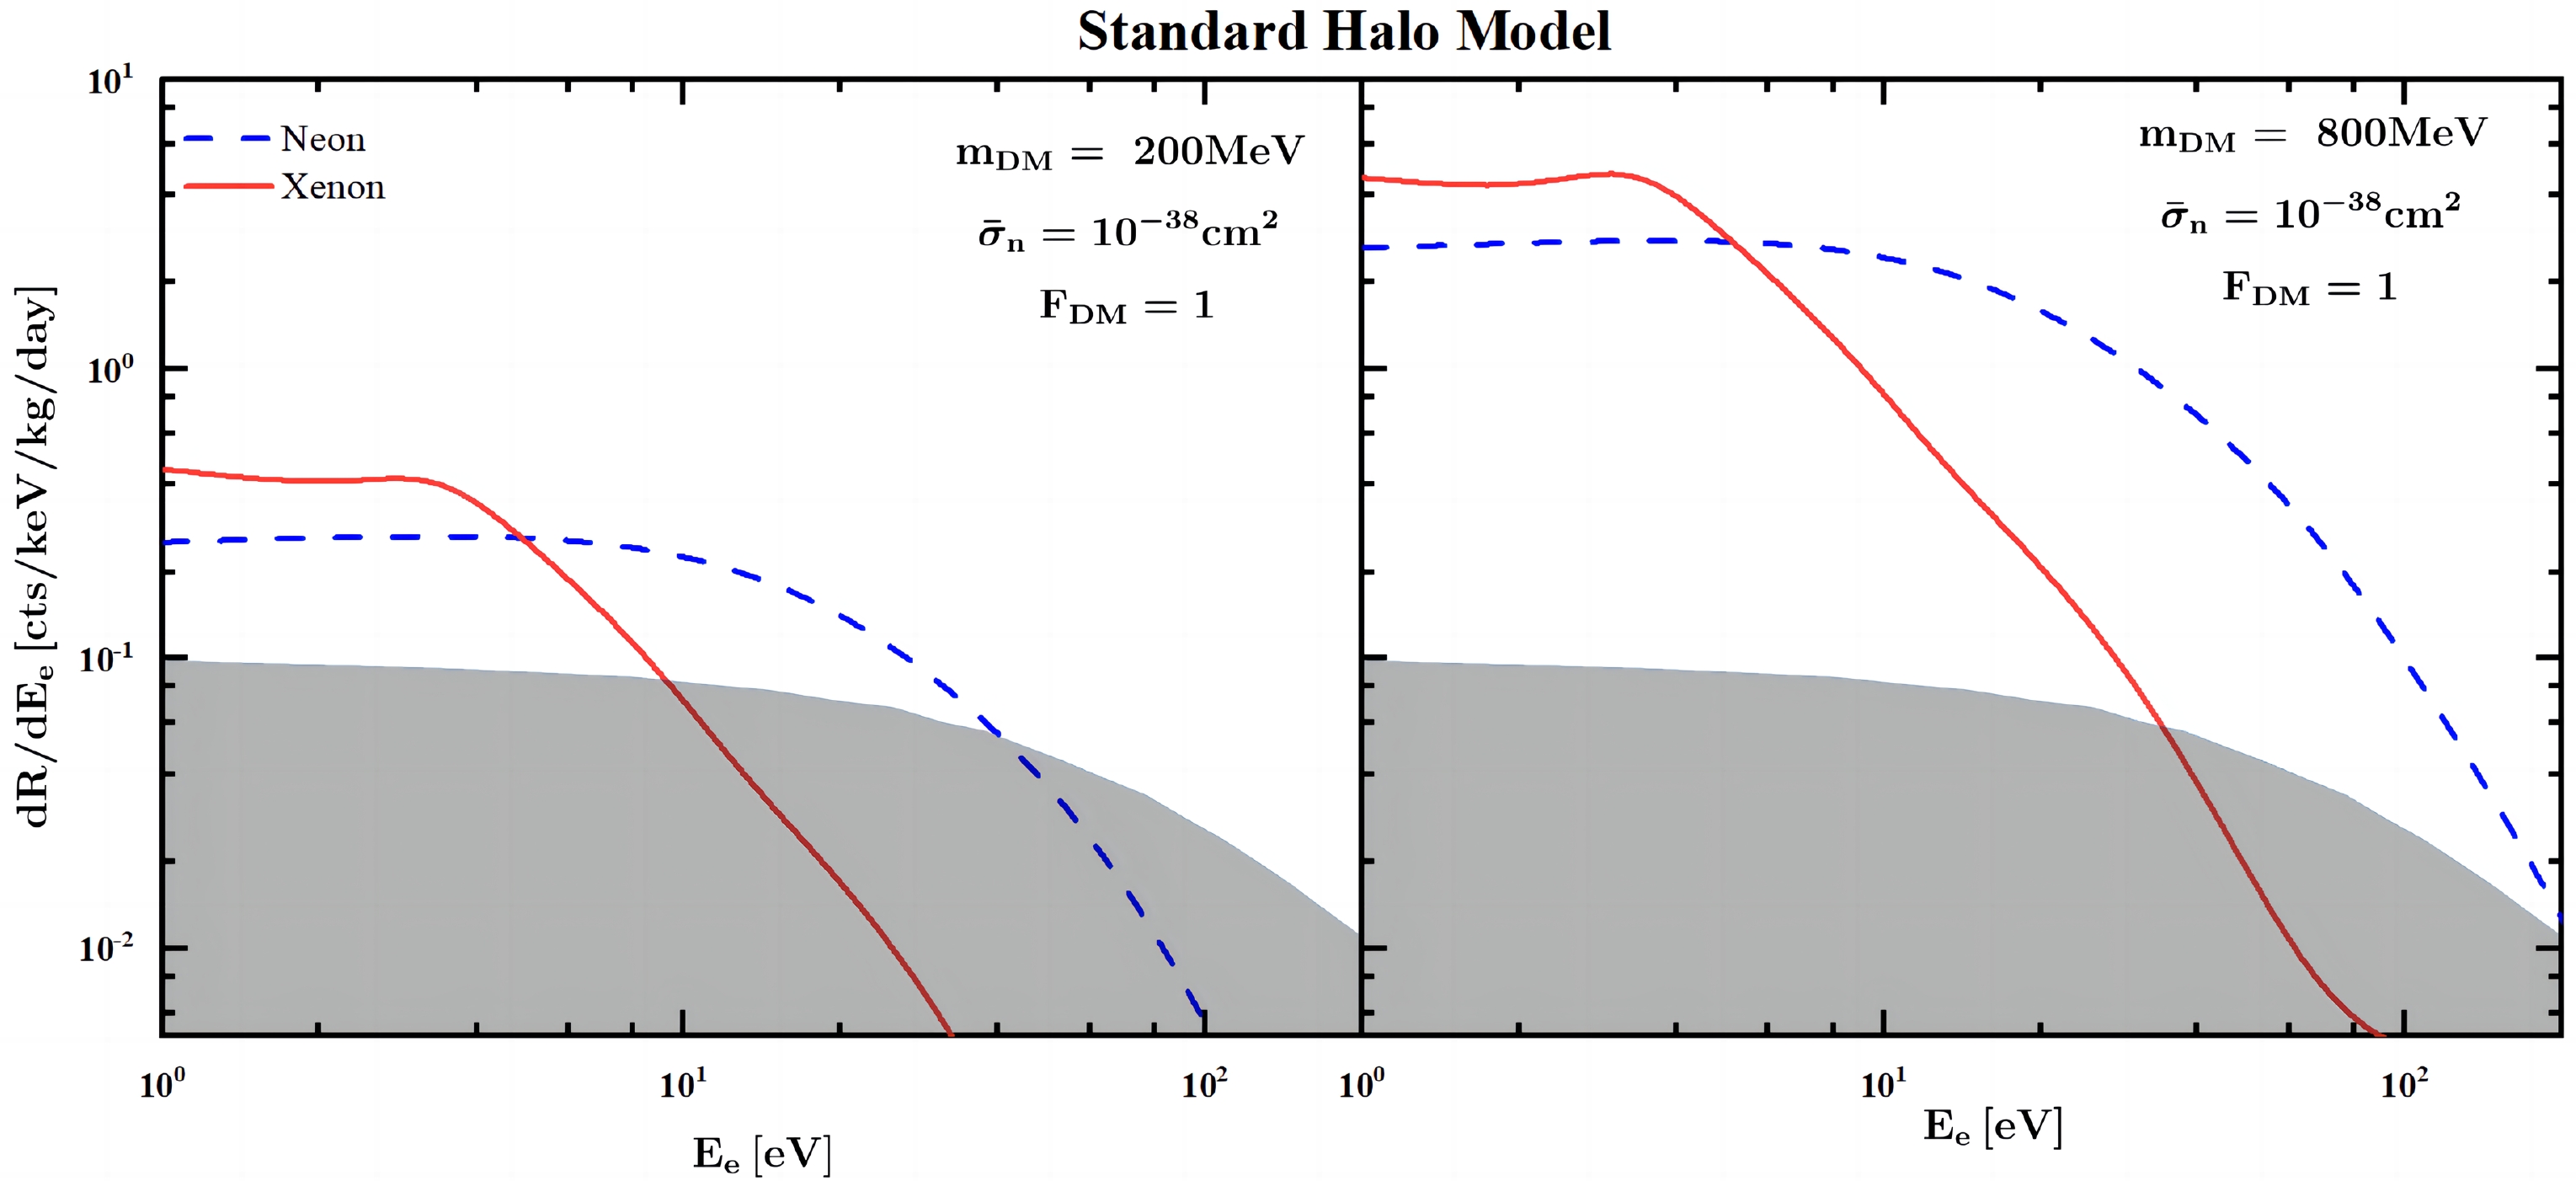
Figure 3. (color online) Differential events induced by Migdal effect with two different target materials (xenon and neon) versus the electron recoil energy
$ E_{e} $ for two different DM masses$m_{\rm DM}=200$ MeV, 800 MeV, the reference cross section$ \bar{\sigma}_n=10^{-38} $ cm$ ^2 $ and DM form factor$F_{\rm DM}=1$ . In both the left and right panels, the red solid and blue dashed lines are the results of xenon and neon as target materials, respectively. The gray shaded region is the estimated background for DARKSPHER [48] provided that it is located at the Large Experimental Cavern at the Boulby Underground Laboratory.Figure 4 shows the impact of three different DM velocity distributions on the DM-induced differential events. The two upper panels represent
$m_{\rm DM}=200$ MeV, whereas the two bottom panels show$m_{\rm DM}=800$ MeV. As shown in Fig. 4, the DM-induced differential events of the SHM and empirical model are almost the same because the DM velocity distribution of these two models has no significant difference in our interested region. Conversely, the differential events generated by the Migdal effect in the Tsallis model differ significantly from those in the other two models. This is because the velocity distribution of the Tsallis model are quite different from those for the SHM and empirical model in the large velocity region as shown in Fig 1. Therefore, we mainly consider the difference between the Tsallis model and SHM.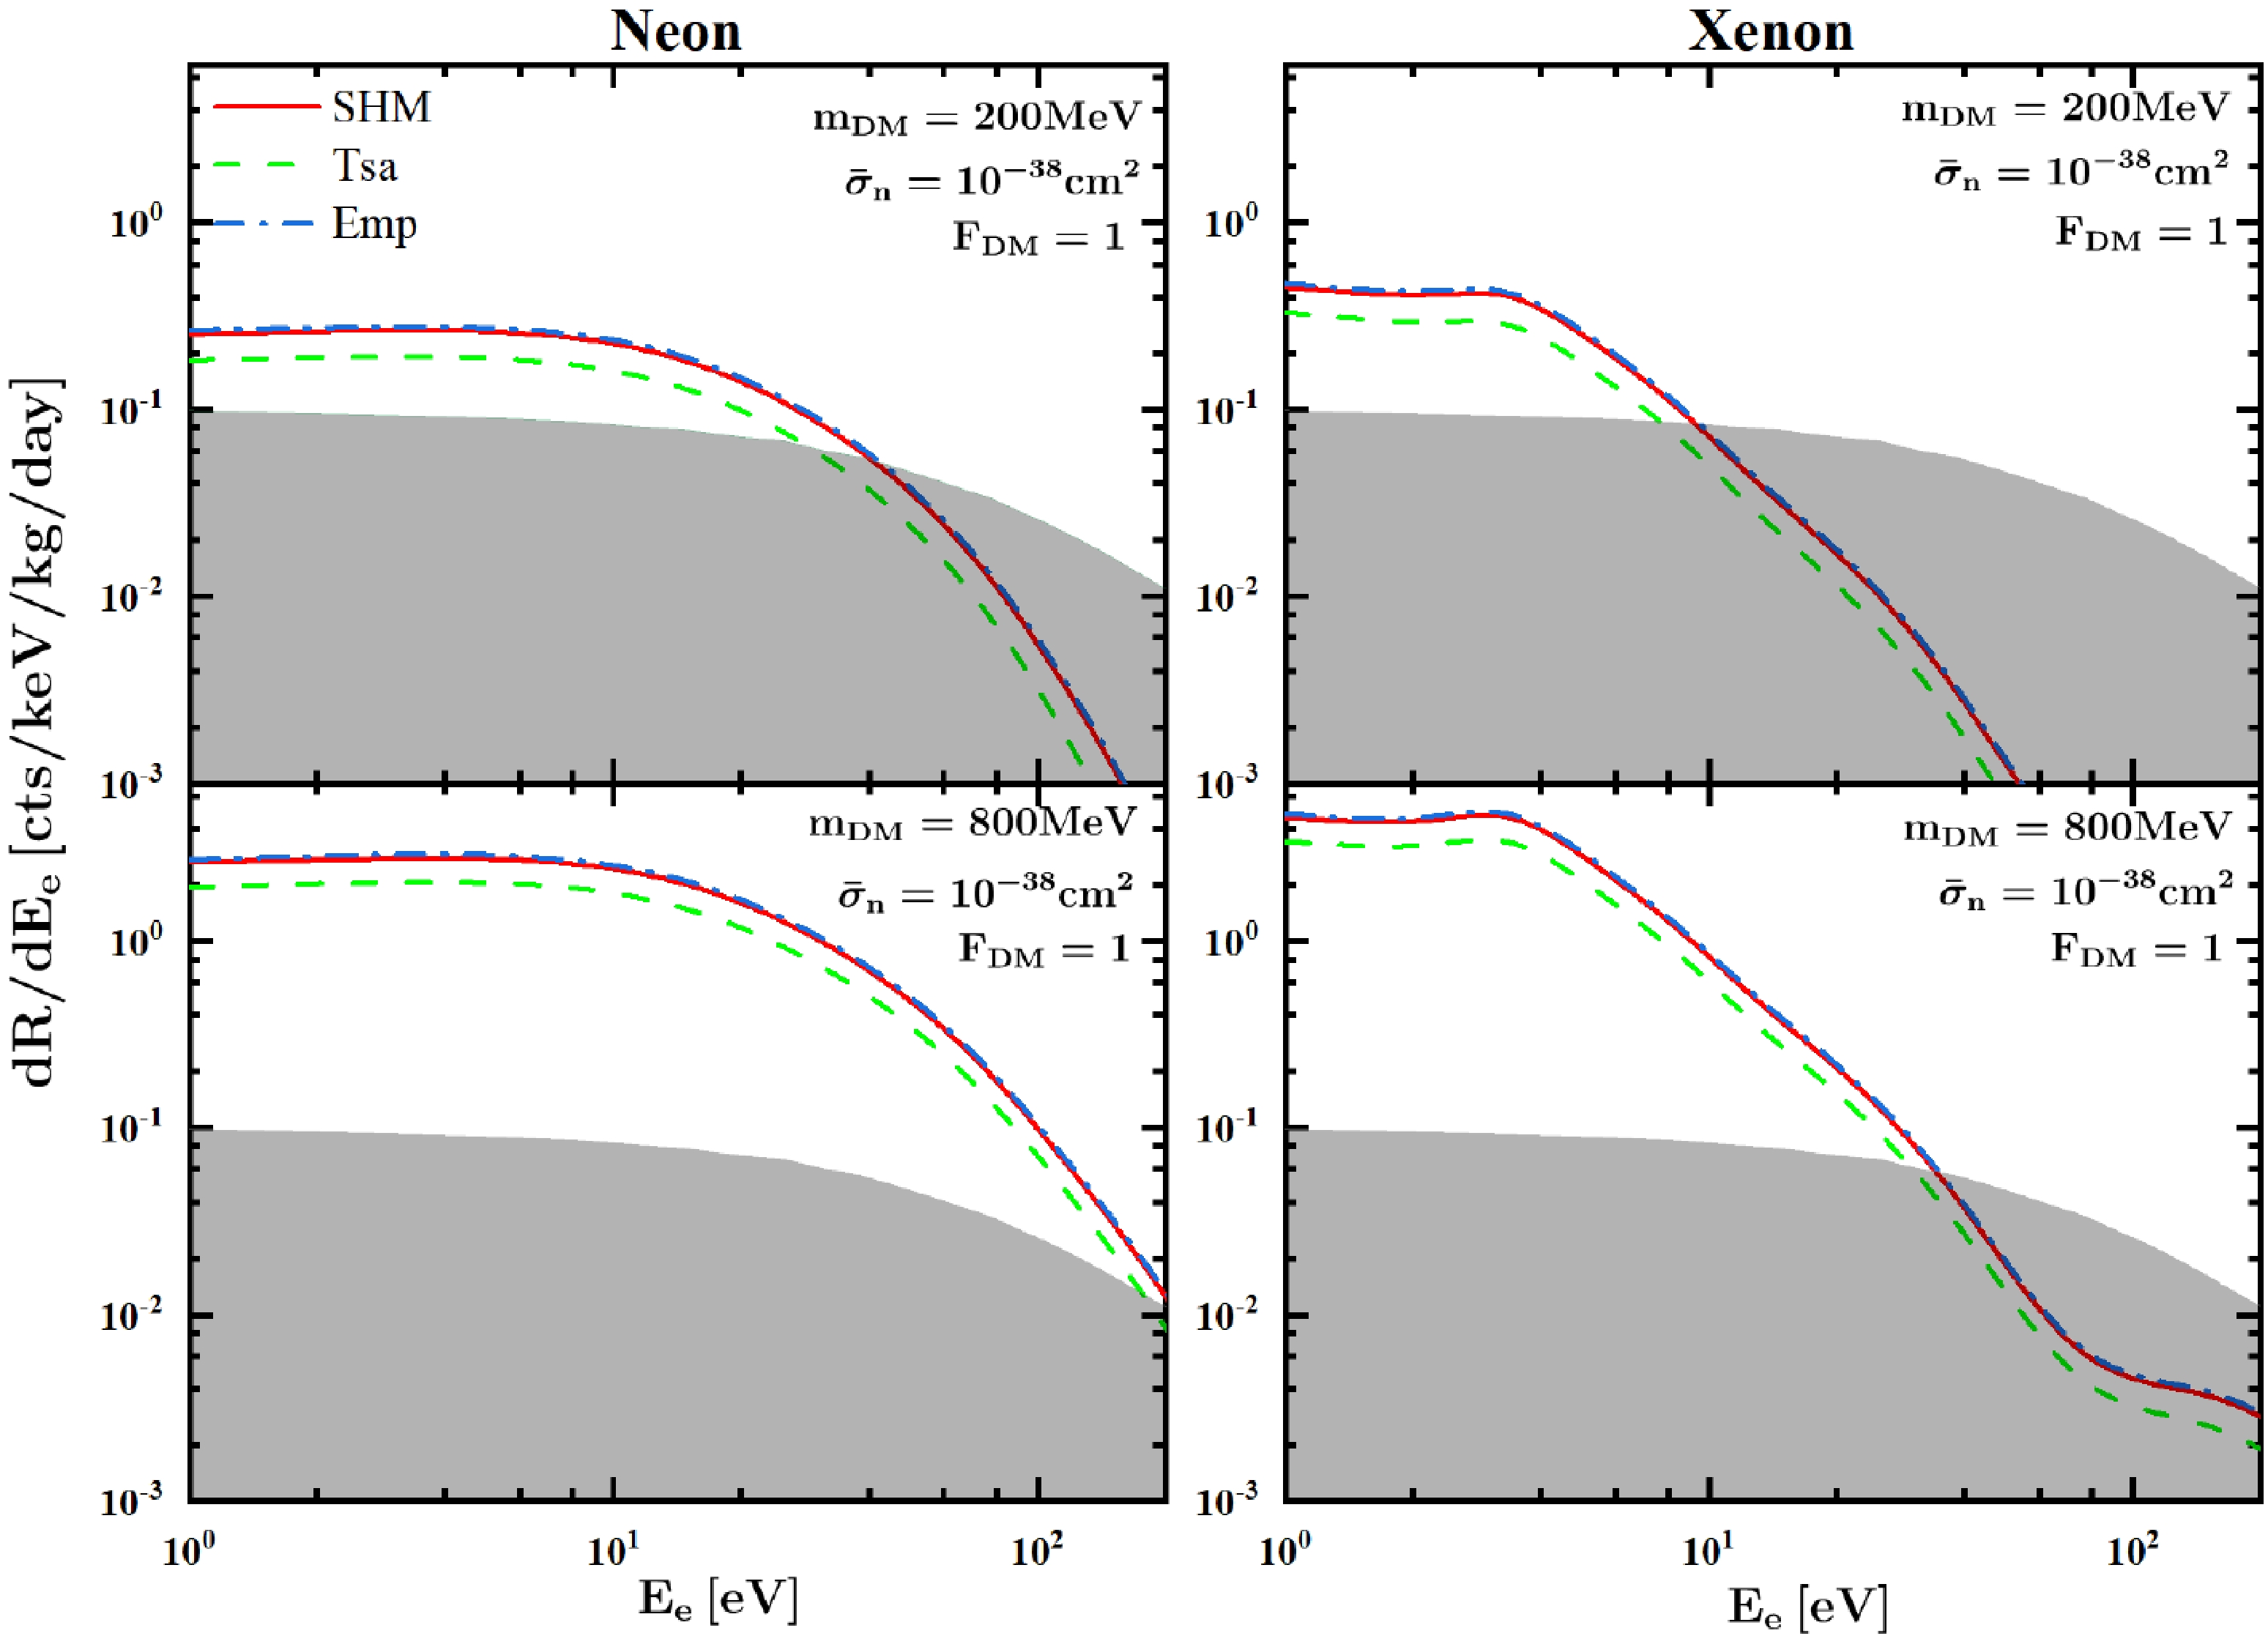
Figure 4. (color online) Differential events due to the Migdal effect for two different targets (xenon and neon) and three different DM velocity distributions as mentioned before. The other parameters are fixed as same as shown in Fig. 3. The red, green dashed, and blue dot-dashed lines indicate the three DM velocity distributions of the SHM, Tsallis model, and empirical model, respectively.
We will present the exclusion limits on
$m_{\rm DM}-\bar{\sigma}_n$ panel for NEWS-G projections. For electronic interactions, the quenching factor Q is equal to 1 [20, 48]. The ionization quenching effect in the Migdal effect is due to the nuclear recoil. Given that the quenching factor [79] depends on the detector parameters, such as impurities and density of the medium and electric field, it should be measured under a real detector condition. To estimate the quenching effect, the SRIM package [80, 81] can be ultilized to simulate the transport of ions in matter. For the xenon target, we can consider a constant quenching factor$ Q=0.15 $ for the Migdal effect as Ref. [82]. Furthermore, we can parameterize the neon material as follows [81]:$ \begin{equation} Q(E_{nr})=\alpha E_{nr}^{\beta} ,\end{equation} $

(22) where the parameters are
$ \alpha=0.2801 $ and$ \beta=0.0867 $ . We apply this ionization quenching factor$Q(E_{nr})$ to calculate the differential events for different energy levels. We determine that for both xenon and neon gases, based on calculations, the differential events induced by the ionization quenching factor$ Q=0.15 $ and$Q(E_{nr})$ are almost the same as those generated by$ Q=0 $ . This implies that the nuclear ionization quench effects are negligible in our interested DM mass range. Additionally, we derive conservative constraints on$ \bar{\sigma}_n $ by ignoring the ionization quenching effect induced by nuclear recoil energy$ E_R $ .In the SPC detector, primarily ionized electrons drift towards the anode within the cavity, influenced by a high-voltage electric field. Throughout this process, it is crucial to account for the primary electrons generating additional electron-ion pairs, which correlates with the W-value of the gas used. The W-value represents the average energy required to produce an additional electron-ion pair in a medium, as observed in the case of xenon
$ W \sim $ 22 eV [83] and neon$ W \sim $ 37 eV [84]. Ideally, the electron recoil$ E_e $ should be converted to the experimentally observable electron-ion pairs. However, there is no exact description of the detector response at very low energy for NEWS-G experiment [48]. Although the conversion to the observables is of great importance for DM direct detection, this is not available for xenon and neon. Therefore, we consider the same method as phenomenology in Ref. [48] to conservatively calculate the number of observable events induced by the Migdal effect. According to the W-value of xenon and neon, we set the experimental threshold$E_{\rm th}=$ 30 eV, which mimics a two-electron threshold. Additionally, we also set experimental threshold$ E_e=1 $ eV to mimic a single-electron search threshold, which implies that the primarily ionized electron recoil energy is too small to produce additional electron-ion pairs in media. Given that the DARKSPHERE detector, proposed by the NEWS-G collaboration, is set to commence operations in 2025, data from the NEWS-G experiment is currently unavailable. In lieu of this, we focus on integrating over the electron recoil energy$ E_{e} $ to obtain the events induced by Migdal effect. It should be noted that the DARKSPHERE detector with a 3-meter diameter and 5 bar pressure of the filled gas runs for a total of 300 days such that the total exposures of neon and xenon in the DARKSPHERE detector are 48.08$ {\rm kg}\cdot {\rm year} $ and 312.986$ {\rm kg}\cdot {\rm year} $ , respectively. Additionally, the background events are indicated by the shaded region as shown in Fig. 3. We can achieve the 90% C.L. bound on the$m_{\rm DM}-\bar{\sigma}_n$ plane by analyzing the signal and background events [85] as follows:$ \begin{equation} \frac{\Gamma(B+1,S+B)}{B!}=0.1 ,\end{equation} $

(23) where Γ denotes the incomplete gamma function, S denotes the total number of signal events derived by integrating over the electron recoil energy
$ E_{e} $ , and B denotes the total number of background events.Figure 5 provides the 90% C.L. exclusion limits for two different target materials on the
$m_{\rm DM}-\bar{\sigma}_{n}$ plane. Compared with the neon target, the xenon target provides stronger constraints on$m_{\rm DM} < 50$ MeV region when the experimental threshold$E_{\rm th}=1$ eV. As mentioned before, the binding energy of the energy level 5p for Xenon is smaller than that of the energy level 2p for neon. Apart from overcoming the binding energy, the light DM has more kinetic energy to induce more observed events for the xenon target. Therefore, the reference cross section$ \bar{\sigma}_{n} $ is strongly constrained by the low-threshold xenon target, which can be used to probe the lighter DM. However, the neon target introduces more stringent limits on$ \bar{\sigma}_{n} $ for the experimental threshold$E_{\rm th}=30$ eV. This is mainly because the total ionization factor of neon is much larger than that of xenon in the large electron recoil energy$ E_{e} $ region. Additionally, deviating from the neon target, the differential events for the xenon target will be strongly suppressed by$ 1/m_{T} $ . Therefore, with respect to the large experimental threshold ($E_{\rm th}=30$ eV), many events will be induced by the Migdal effect for the neon target, resulting in the rigorous constraints on$ \bar{\sigma}_{n} $ . Additionally, the neon and xenon targets simultaneously lose sensitivity at$m_{\rm DM} \sim 20$ MeV in the right panel because the light DM with small kinetic energy cannot overcome the binding energy of the outermost electrons for both neon and xenon. Combined with the previous discussion,Fig. 5implies that the DARKSPHERE detector should be filled with the best performance gas for various thresholds to optimize the experimental performance.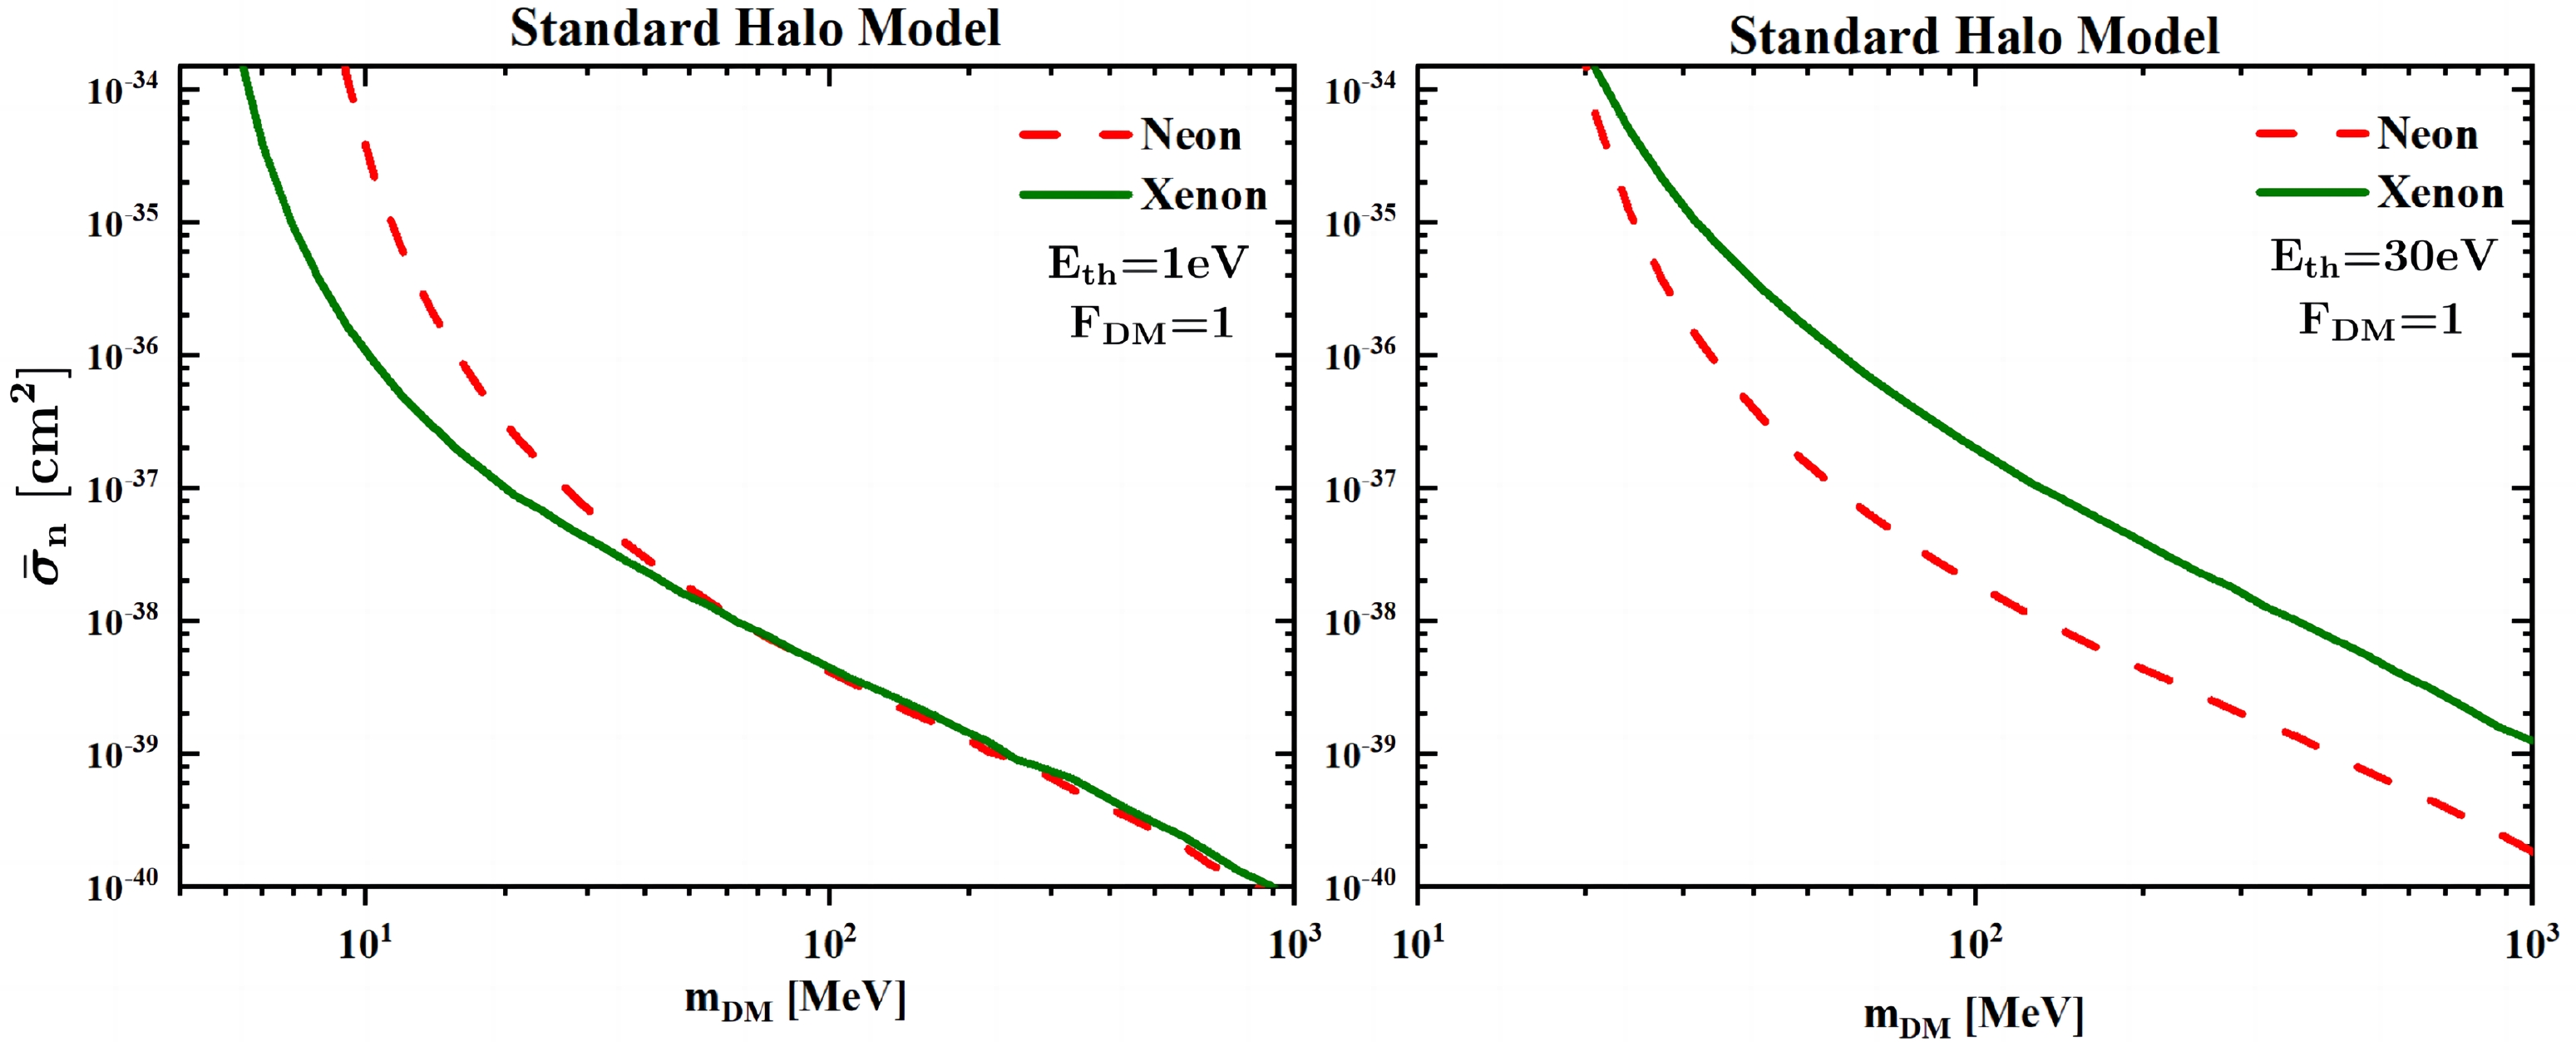
Figure 5. (color online) Projected 90% C.L. exclusion limits for the DARKSPHERE detector with two experimental thresholds
$E_{\rm th}=1$ eV (left panel) and$E_{\rm th}=30$ eV (right panel) on the$m_{\rm DM}-\bar{\sigma}_{n}$ plane. In the left and right panels, the DM form factor$F_{\rm DM}=1$ and the velocity distribution of DM correspond to the SHM. The red dashed lines represent the neon target material while the green solid curves show the xenon target material.Additionally, the dependence of exclusion limits on the three DM velocity distributions is shown in Fig. 6. Furthermore, as shown in Fig. 6, the exclusion limits derived by the SHM and empirical model are almost the same, which are significantly different from those from the Tsallis model, especially for the light DM. The light DM implies the large allowed minimum velocity
$v_{\rm min}$ where the velocity distribution of the Tsallis model is quite different from the other two models. It should be noted that for the xenon target, the exclusion limits on$ \bar{\sigma}_{n} $ induced by light DM-nucleus scattering in the SHM is an order of magnitude stronger than that originating from the Tsallis model. This indicates that the dependence of various velocity distributions on DM direct detection should be considered, especially for light DM.
Figure 6. (color online) 90% C.L. exclusion limits on reference cross section
$ \bar{\sigma}_{n} $ versus$m_{\rm DM}$ for three different DM velocity distributions$f({v_{\rm DM}})$ , DM form factor$F_{\rm DM}=1$ , and the experimental threshold$E_{\rm th}=1$ eV. The three different DM velocity distributions include the SHM (the blue dot-dashed line), Tsallis model (the dark yellow solid line), and Empirical model (the orange dashed line). The target materials correspond to neon (left panel) and xenon (right panel)Given that all the aforementioned calculations are based on
$F_{\rm DM}=1$ , we should obtain the exclusion limits on$ \bar{\sigma}_{n} $ by considering other DM form factors [86]:$1)~ F_{\rm DM}=1$ , “heavy” mediator;$2)~ F_{\rm DM}=\Big(\dfrac{\alpha m_e}{q}\Big)^2$ , "light" mediator;$3)~ F_{\rm DM}=\dfrac{q}{\alpha m_e}$ , q-dependent “heavy” mediator;$4)~ F_{\rm DM}=\Big(\dfrac{q}{\alpha m_e}\Big)^2$ ,$ q^2 $ -dependent “heavy” mediator.Furthermore, 90% C.L. exclusion limits derived from the Migdal effect by considering four different DM form factors
$F_{\rm DM}$ are delineated in Fig. 7. For both the neon and xenon targets, the reference cross section$ \bar{\sigma}_{n} $ is the most weakly constrained when the DM form factor$F_{\rm DM}=\left(\alpha m_{e}/q\right)^2$ . However, the cross section is the most strongly constrainted when the DM form factor$F_{\rm DM}=\left(q/\alpha m_{e}\right)^2$ . As discussed before, the minimum of the transfer momentum$ q_{-} $ is always larger than$ \alpha m_{e} \sim 4 $ keV. Given the enhancement from the DM form factor$F_{\rm DM} \propto q^2$ , more events will be generated by the DM form factor$F_{\rm DM}=\left(q/\alpha m_{e}\right)^2$ and receive stronger constraints. However, fewer events will be produced by$F_{\rm DM}=\left(\alpha m_{e}/q\right)^2$ due to being suppressed by$F_{\rm DM} \propto 1/q^2$ , which leads to weaker constraints. With respect to the xenon target, the exclusion limits arising from the other DM form factors, with the exception of$F_{\rm DM}=1$ , are stronger than those derived by the CDEX, XENON1T, and PandaX-4T experiments. Furthermore, compared with those from CDEX, XENON1T, and PandaX-4T experiments, the exclusion limits derived by using the DARKSPHERE detector can reach the lighter DM mass region. This implies that the NEWS-G experiment has the potential to detect light DM. Additionally, the differences between the two different DM velocity distributions are quite different in the light DM mass region as mentioned before. This leads to a substantial impact on the reference cross-section constraints. Especially, owing to the low experimental threshold of the xenon target, the constraints on cross section$ \bar{\sigma}_{n} $ can reach$ \bar{\sigma}_n \sim10^{-39} $ cm$ ^2 $ for$F_{\rm DM}=\left(q/\alpha m_{e}\right)^2$ when$m_{\rm DM} \sim 10$ MeV, which are stronger than those derived from the existing XENON1T and CDEX experiments.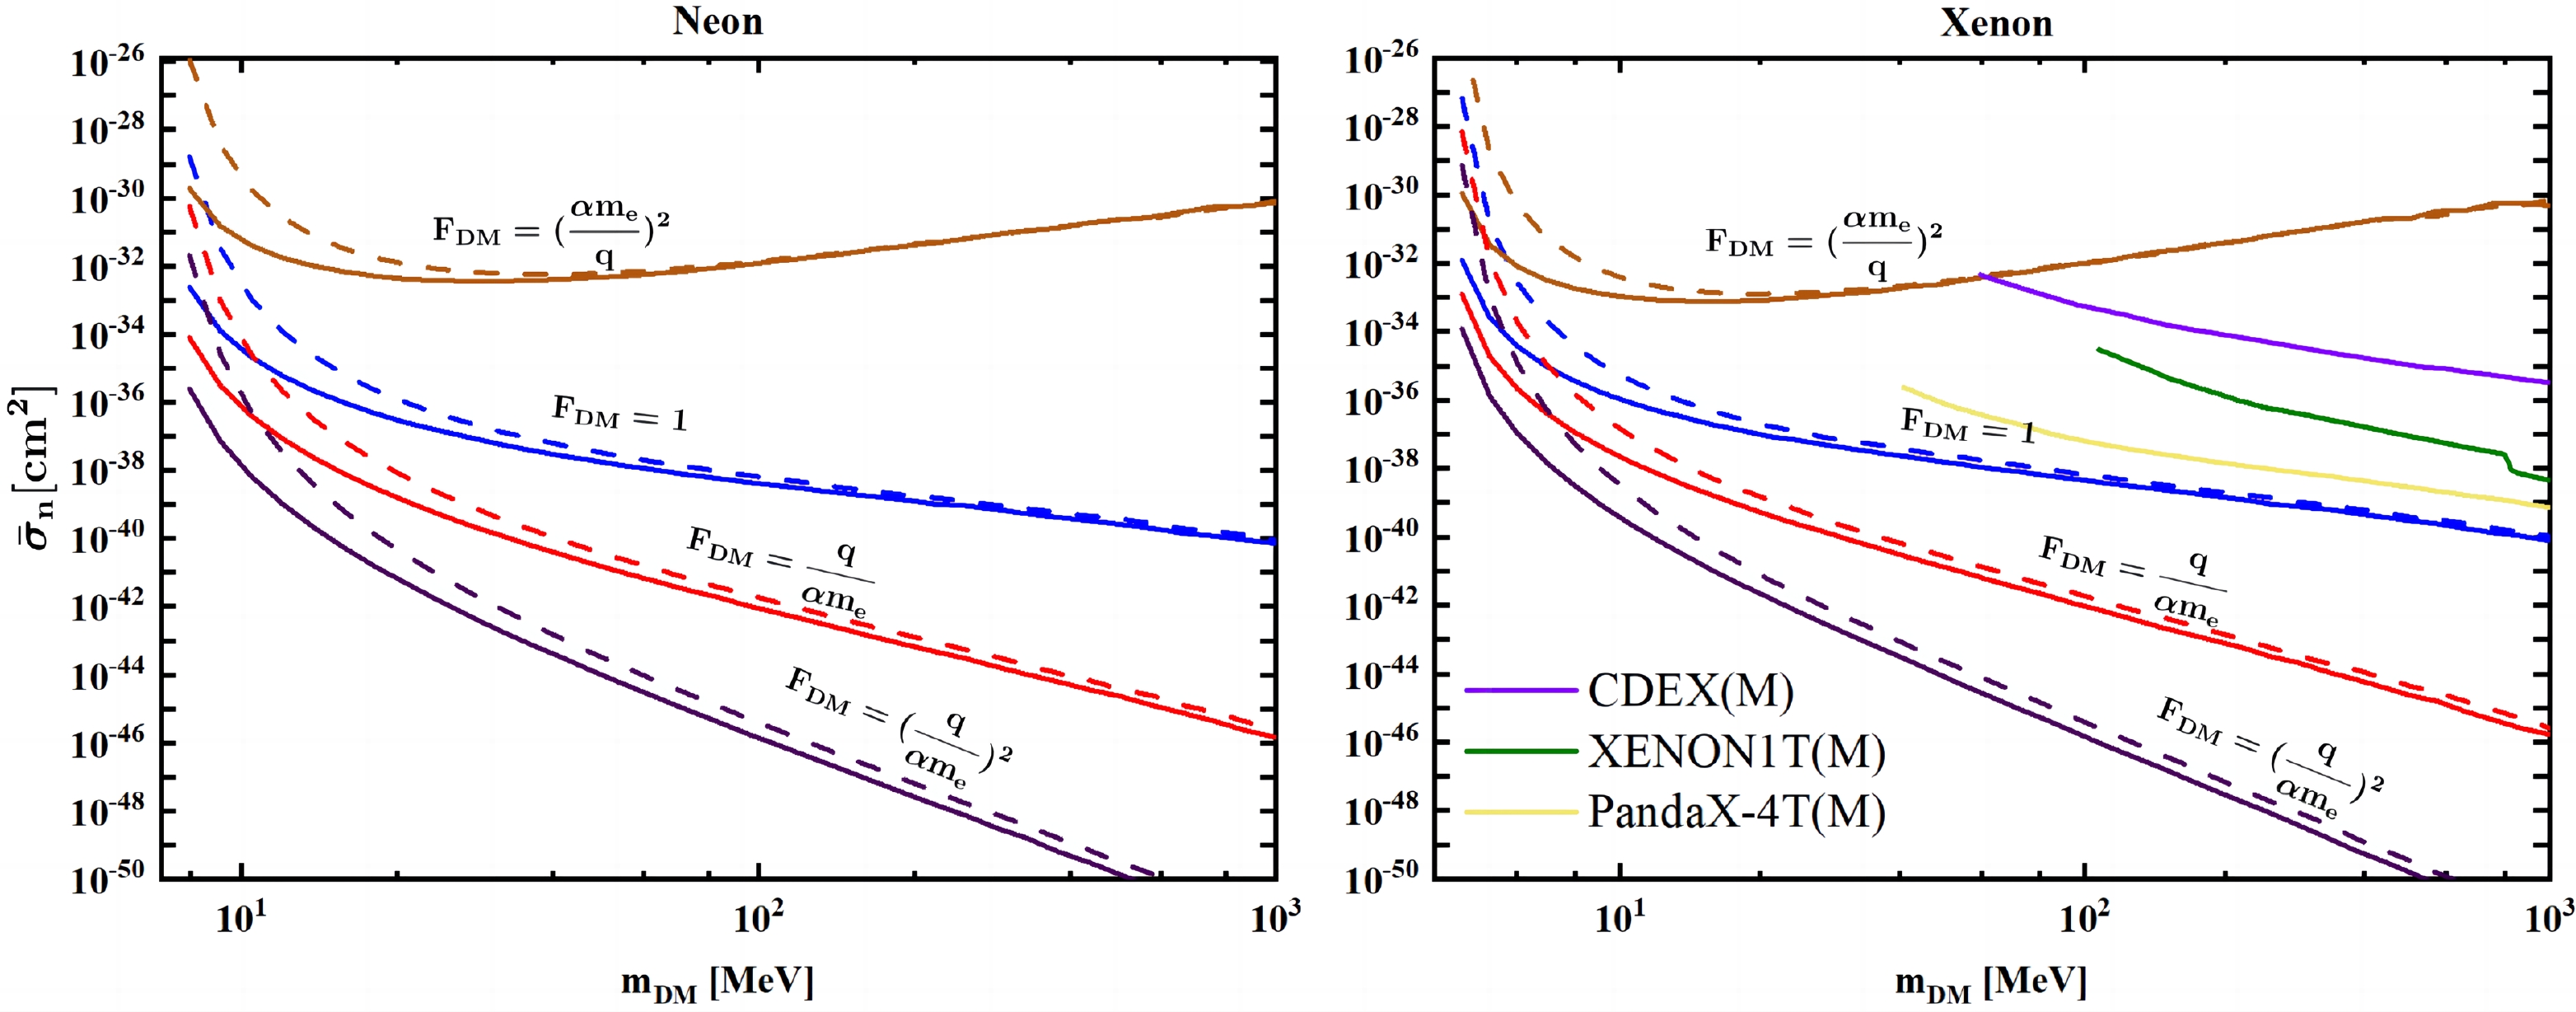
Figure 7. (color online) 90% C.L. exclusion limits on the
$m_{\rm DM}-\bar{\sigma}_{n}$ for four different DM form factors$F_{\rm DM}$ and experimental threshold$E_{\rm th}=1$ eV. The solid and dashed lines indicate the results generated by the SHM and Tsallis model, respectively. The left (right) panel represents the neon (xenon) target material. The purple line shows the constraint from the CDEX experiment [21], while the green line illustrates that from the XENON1T experiment [87, 88]. The yellow line denotes the results of the PandaX-4T experiment by considering the Migdal effect with the mediator mass of 1 GeV [89]. -
The spherical proportional counter, proposed by the NEWS-G collaboration for DM direct detection, exhibits the property of being flexibly filled with various experimental target materials, such as neon and xenon. The NEWS-G experiment can probe the DM mass
$m_{\rm DM}$ as low as sub-GeV. In this study, we derive the exclusion limits on the$m_{\rm DM}-\bar{\sigma}_{n}$ by exploiting the DARKSPHERE detector after considering the Migdal effect with respect to different target materials, DM velocity distributions$f\left(v_{\rm DM}\right)$ , and form factors$F_{\rm DM}$ . We find that the exclusion limits depend on the DM velocity distributions, especially for the light DM. For DM mass$m_{\rm DM} \sim {\cal O}(10)$ MeV, the difference of exclusion limits on reference cross section$ \bar{\sigma}_n $ between the SHM and Tsallis model can reach orders of magnitude. Given the low binding energy of 5P energy level for xenon, the DARKSPHERE detector with the low experimental threshold ($E_{\rm th}=1$ eV) can probe the light DM with a mass as low as$ {\cal O}(10) $ MeV. However, the exclusion limits derived by the DARKSPHERE detector with the relatively high experimental threshold ($E_{\rm th}=30$ eV) for the neon target are stronger than those for the xenon target. Therefore, the DARKSPHERE detector should be filled with the best performing gas for various thresholds to optimize the experimental performance. The spherical proportional counter with suitable filled gas has the potential to detect sub-GeV or even lighter DM via the Migdal effect. Furthermore, with regard to different DM form factors$F_{\rm DM}$ , the constraints on the reference cross section$ \bar{\sigma}_n $ for$F_{\rm DM}=\left(q/\alpha m_{e}\right)^2$ are the strongest because the caused events are enhanced by$ q^2 $ , whereas those for$F_{\rm DM}= \left(\alpha m_{e}/q\right)^2$ are the weakest because the generated events are suppressed by$ q^2 $ . Given the low experimental threshold for the xenon target, the constraints on cross section$ \bar{\sigma}_{n} $ can reach$ \bar{\sigma}_n \sim10^{-39} $ cm$ ^2 $ for$F_{\rm DM}=\left(q/\alpha m_{e}\right)^2$ when$m_{\rm DM} \sim 10$ MeV, which are stronger than those derived from existing the CDEX, XENON1T, and PandaX-4T experiments. -
We are grateful to Christopher McCabe for helpful discussions on the NEWS-G experiment, Masahiro Ibe, Wakutaka Nakano and Yutaro Shoji for helpful discussions on the usage of FAC. Furthermore, we acknowledge Liangliang Su for useful discussions.
Probing light DM via the Migdal effect with spherical proportional counter
- Received Date: 2023-07-20
- Available Online: 2023-12-15
Abstract: Owing to its low electronic noise and flexible target materials, the Spherical Proportional Counter (SPC) with a single electron detection threshold can be utilized to search for sub-GeV dark matter (DM). In this study, we investigate the prospects for light DM direct detection via the DM-nucleus Migdal effect in the DARKSPHERE detector. We consider different DM velocity distributions and momentum-transfer effects. For Xenon and Neon targets, we find that the DM mass


 DownLoad: