


 Abstract
 HTML
HTML Reference
 Related
 PDF
PDF


-
The neutron-deficient odd-Z nuclei with mass A ~ 175 provide a valuable opportunity to study the deformation-driving effects of various single-particle orbitals. In odd proton nucleus such as
$ ^{75}{\rm Re} $ , the proton Fermi level lie close to the low K, high-j$ \pi h_{9/2} $ ($K = 1/2 $ ) and$ \pi i_{13/2} $ ($K = 1/2 $ ) orbitals intruding from above the Z = 82 shell closure. Intruding orbitals are highly downsloping as a function of deformation in the Nilsson diagram [1], driving the nucleus to larger deformations for equilibrium shapes. In addition to these low-K intruding orbitals, high-K orbitals such as$ h_{11/2} $ ($K = 9/2 $ ) and$ d_{5/2} $ ($K = 5/2 $ ) orbitals are also close to the Fermi surface. The high-K orbitals are upsloping as a function of deformation in the Nilsson diagram (i.e., they have a positive slope) and have a tendency to drive the nucleus to smaller deformations. The deformation driving nature of this low-K, high-j$ \pi h_{9/2} $ intruder orbital was established in the lifetime measurement studies of$ ^{171,173}{\rm Ta} $ and$ ^{177,179}{\rm Re} $ nuclei, where the deformation of the$ \pi h_{9/2}[541]1/2^- $ band was found to be approximately 20% higher compared with the$ \pi d_{5/2}[402]5/2^+ $ orbital [2−4]. While the deformation-driving capability of the$ \pi h_{9/2} $ orbital is well studied, studies on the deformation-driving nature of low-K, high-j$ \pi i_{13/2} $ ($K = 1/2 $ ) orbital is rare in this mass region. This rarity is primarily because, although both$ \pi h_{9/2} $ ($K = 1/2 $ ) and$ \pi i_{13/2} $ ($K = 1/2 $ ) orbitals intrude from above the Z = 82 shell closure, the$ \pi i_{13/2} $ orbital lies at a higher excitation energy from the Fermi level than the$ \pi h_{9/2} $ orbital, making it difficult to populate in the nuclei of this mass region. The available data suggests that on the lower-Z side,$ ^{163}{\rm Lu} $ is the lightest nucleus in which$ \pi i_{13/2} $ ($K = 1/2 $ ) band has been identified. The results of the lifetime measurements, performed by Schmitz et al., [5] reveal that the deformation for this band is twice as large as that of normal deformed yrast band. On the higher Z- side, the$ ^{177}{\rm Re} $ is the lightest nucleus where the$ \pi i_{13/2} $ ($K = 1/2 $ ) band has been identified at high excitations in experimental studies. In Rhenium isotopes ($Z = 75 $ ), the$ \pi i_{13/2} $ ($K = 1/2 $ ) orbital lies much closer to the Fermi surface compared with Lutetium isotopes (Z = 71); however, it is still expected to behave as a pure particle state and show its deformation driving capabilities. In$ ^{177}Re $ nucleus both$ \pi h_{9/2} $ ($K = 1/2 $ ) and$ \pi i_{13/2} $ ($K = 1/2 $ ) orbitals are present. However, looking at the experimental level scheme in Fig. 1 [6], it is clear that the$ \pi h_{9/2} $ ($K = 1/2 $ ) band forms the yrast structure while the$ \pi i_{13/2} $ ($K = 1/2 $ ) band is available at high excitations. Thus, the$ \pi i_{13/2} $ state is farther than the$ \pi h_{9/2} $ orbital from the Fermi surface and therefore is expected to show more deformation driving tendency compared with the$ \pi h_{9/2} $ orbital. To verify this claim, the measurement of quadrupole momemt is necessary in all the excited bands populated in$ ^{177} {\rm{Re}}$ nucleus with enough intensities. As the lifetime of excited nuclear states give direct information about the quadrupole deformation parameter in the given nucleus so the lifetime measurements have been done. In this mass region, low-spin excited states in populated bands have lifetime in the range of picosecond. Thus, to measure such small lifetimes the recoil distance Doppler shift method (RDM) [7] is used. The RDM technique is based on Doppler's effect of light and is sensitive enough to measure the level lifetime of excited nuclear states ranging from picosecond to nanosecond.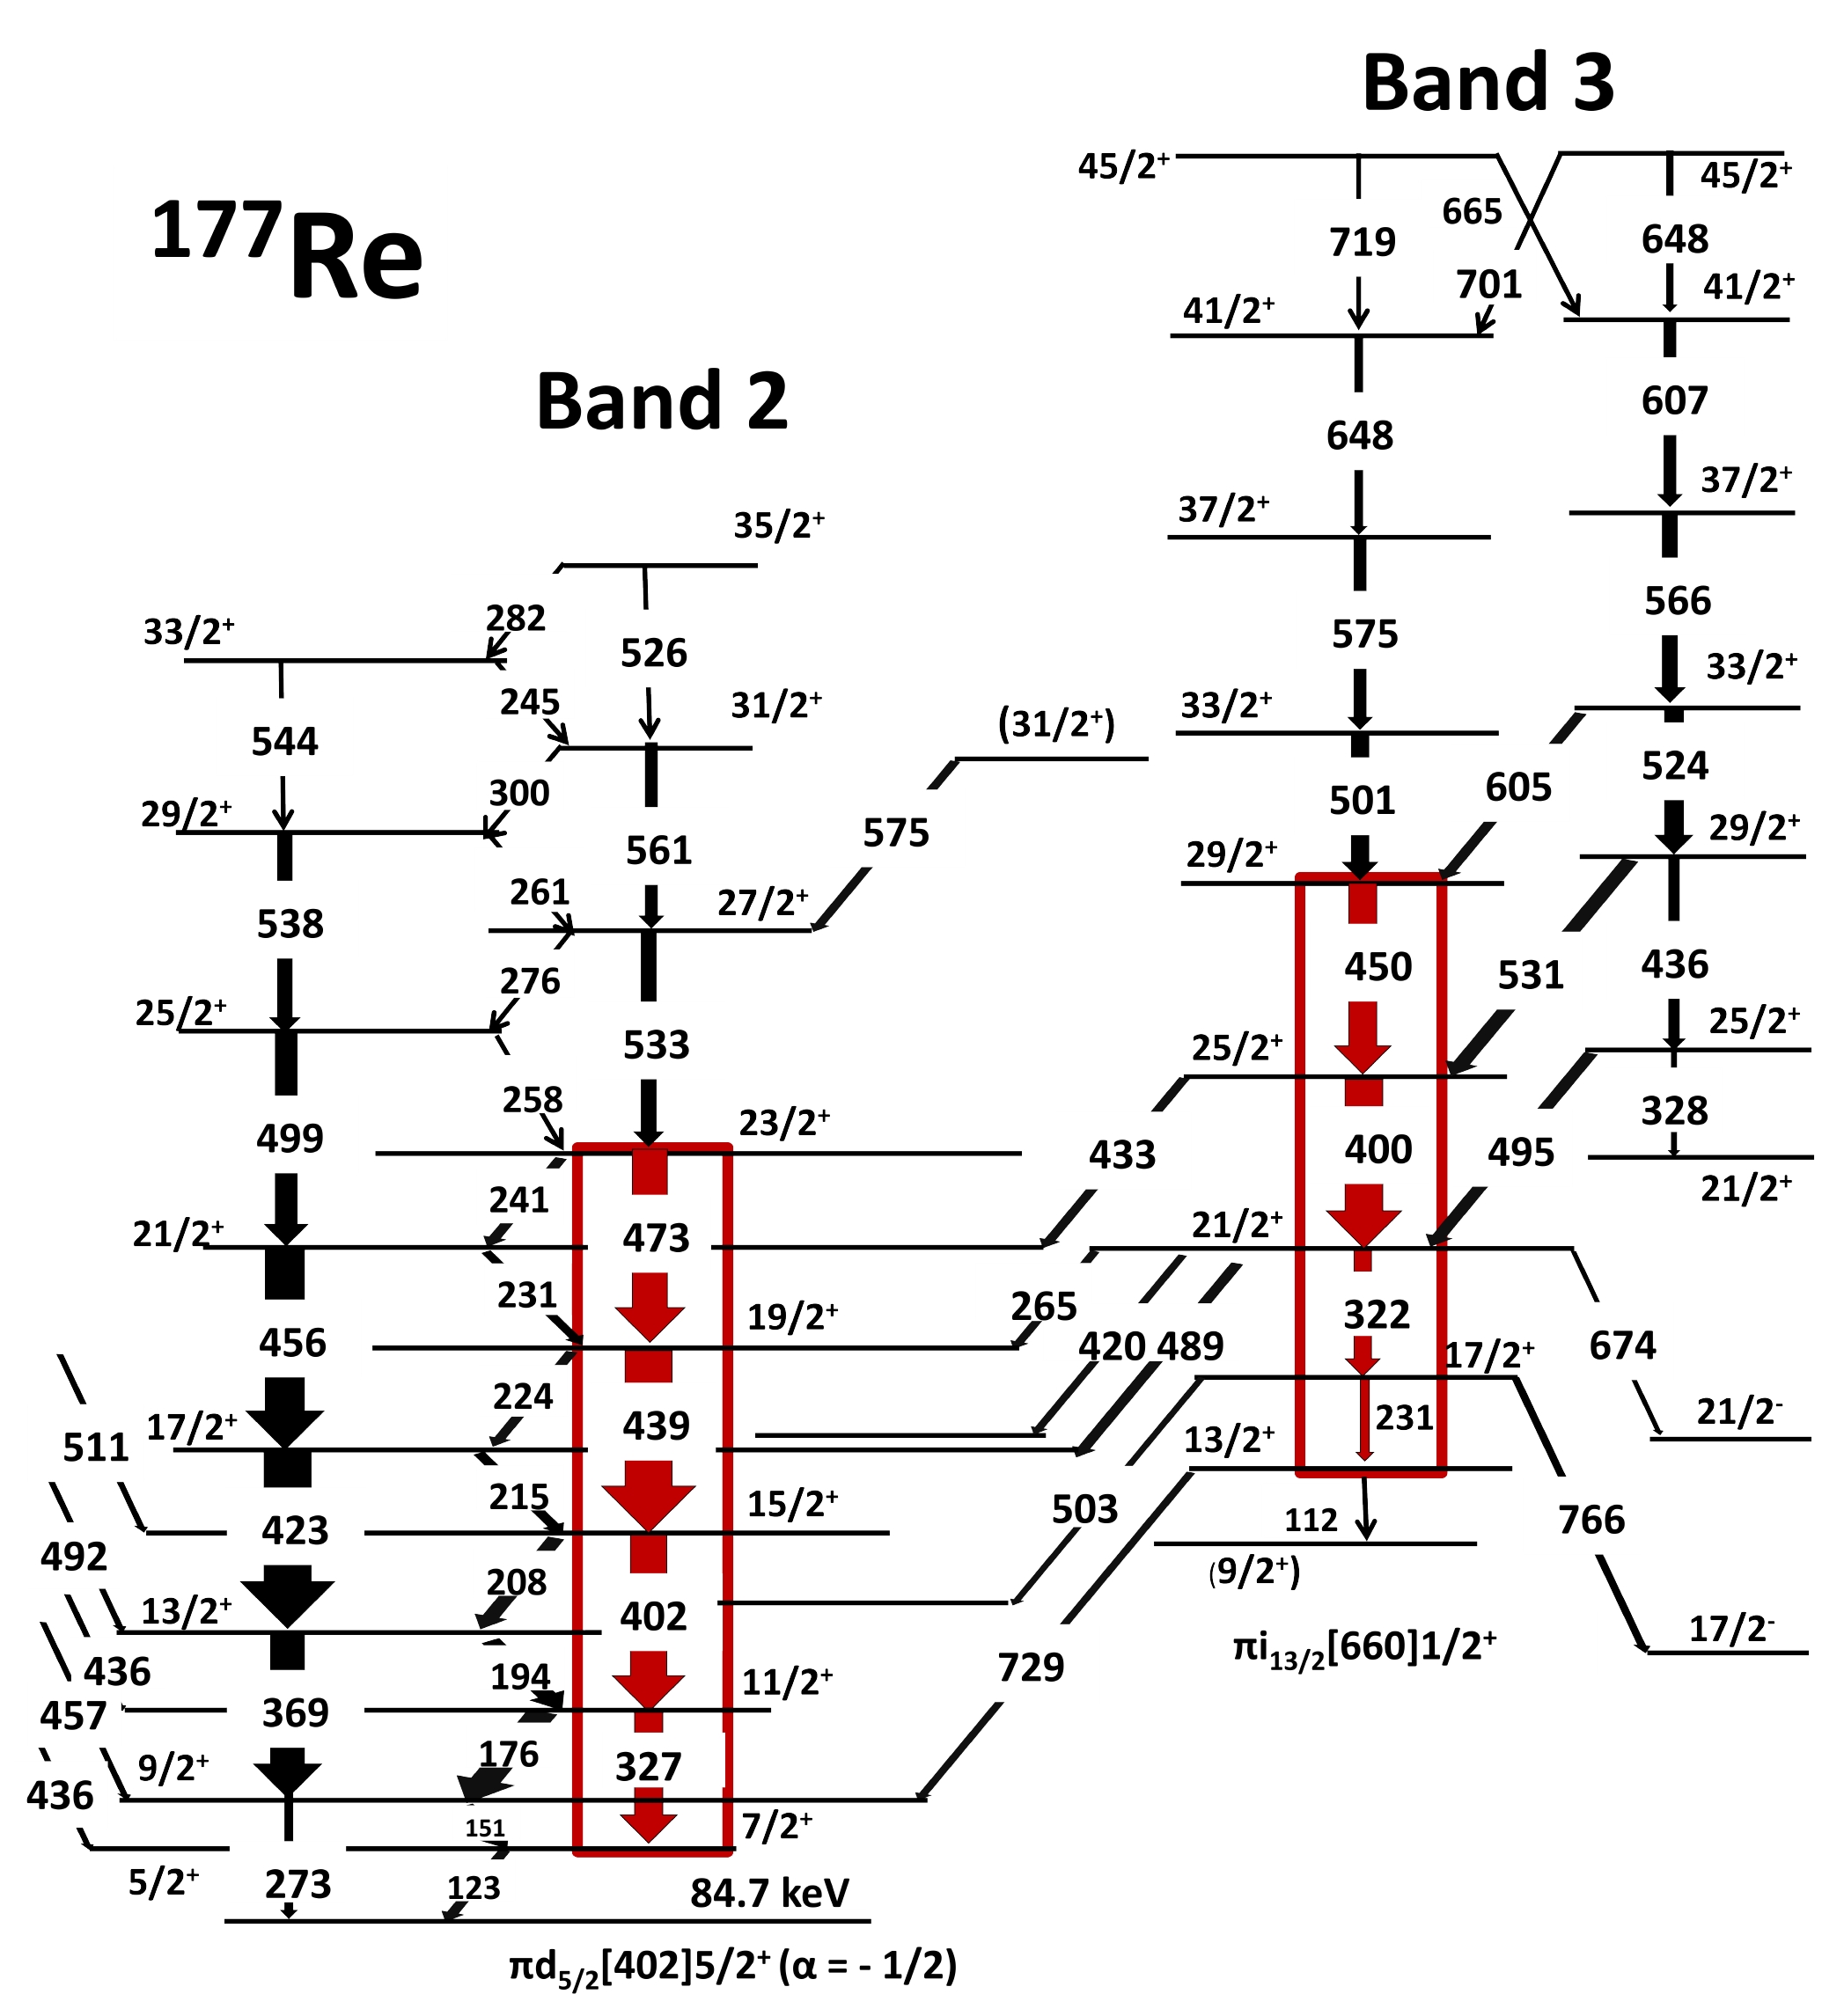
Figure 1. (color online) Partial level scheme of 177Re, relevant to this study, showing the eight γ-ray transitions of interest (marked with red) in Band 2 (
$ \pi d_{5/2}$ , α = –1/2) and Band 3 ($ \pi i_{13/2}$ ) for which the lifetime measurement were performed. The complete level scheme is available in Ref. [6]. -
The experiment was conducted at the Inter-University Accelerator Centre (IUAC), New Delhi. For this purpose, the
$ ^{177}{\rm Re} $ nucleus was populated with$ ^{165} {\rm{Ho}}$ ($ ^{16} {\rm O}$ , 4n)$ ^{177}{\rm Re} $ reaction at 84 MeV of beam energy. A self-supporting foil of$ ^{165} {\rm{Ho}}$ (enrichment level 99.9%) with an approximate thickness of 780 μg/cm2 was used as a target, and the stopper was made of highly pure natural Gold foil with an approximate thickness of 8$ \rm mg/cm^2 $ . For the detection of gamma rays, the Gamma detector Array (GDA) setup [8, 9], consisting of 12 HPGe detectors and 14 elements BGO multiplicity filter was used. The HPGe detectors in the array were arranged in three different rings (four detectors in each ring), positioned at angles of$ 50^{ \circ } $ ,$ 99^{ \circ } $ , and$ 144^{ \circ } $ to the beam direction. The 14 elements of BGO multiplicity filter were arranged in the array with seven crystals positioned above and seven below the target. The data was collected in the singles mode in coincidence with the BGO multiplicity condition$ M \geq 2 $ at 22 target-stopper distances ($D _{T-S} $ ), ranging from 10–10000 μm. "Singles mode" refers to events recorded by a single Ge detector in the GDA array, under the condition that at least two gamma rays have been simultaneously detected by the 14-element BGO crystals multiplicity array. The BGO multiplicity gating reduces the background contribution from the Coulomb excitation (low activity events), radioactivity, and other sources.The capacitance method [10] was used to measure small distances (less than approximately 50$μm$ ) between the target and the stopper foils. The capacitance method is useful at small distances, where the target and stopper foils in the RDM plunger act as two plates of a parallel plate capacitor. In this configuration, the capacitance between the target and stopper foil assembly is inversely proportional to the distance between them. The minimum distance between the foils was determined by interpolating a fitting curve plotted between the inverse of capacitance (assuming the small gap between the target and stopper foil assembly as two plates of a parallel plate capacitor) as a function of increasing target-stopper distance. The target-stopper distance was measured to the precession better than 1$ \mu\rm m $ . This slight variation in the measured distance was attributed to the target heating by the beam. Further details on the experimental setup, data acquisition, and analysis method are provided in [3].In this experiment, the lowest gamma-ray transitions from all populated bands, such as
$ \pi h_{9/2} $ [541]$ 1/2^- $ ($ \alpha= +1/2 $ ),$ \pi d_{5/2} $ [402]$ 5/2^+ $ ($ \alpha= \pm 1/2 $ ),$ \pi h_{11/2} $ [514]$ 9/2^- $ ($ \alpha= \pm 1/2 $ ), and$ \pi i_{13/2} $ [660]$ 1/2^+ $ ($ \alpha= +1/2 $ ), have been detected. The results of lifetime analysis for$ \pi h_{9/2} $ [541]$ 1/2^- $ ($ \alpha= +1/2 $ ),$ \pi d_{5/2} $ [402]$ 5/2^+ $ ($ \alpha= + 1/2 $ ), and$ \pi h_{11/2} $ [514]$ 9/2^- $ ($ \alpha= \pm 1/2 $ ) have already been reported previously (Ref. [3]). In our study, we report the lifetimes results obtained for the four lowest gamma-ray transitions of$ \pi i_{13/2} $ [660]$ 1/2^+ $ band, the 231 keV ($ 17/2^+ \rightarrow 13/2^+ $ ), the 322 keV ($ 21/2^+ \rightarrow 17/2^+ $ ), the 400 keV ($ 25/2^+ \rightarrow 21/2^+ $ ), and the 450 keV ($ 29/2^+ \rightarrow 25/2^+ $ ) and the four gamma-ray transitions in the$ \alpha = -1/2 $ signature partner of the$ \pi d_{5/2} $ [402]$ 5/2^+ $ band, 327 keV ($ 11/2^+ \rightarrow 7/2^+ $ ), 402 keV ($ 15/2^+ \rightarrow 11/2^+ $ ), 439 keV ($ 19/2^+ \rightarrow 15/2^+ $ ), and 473 keV ($ 23/2^+ \rightarrow 19/2^+ $ ). For clarity, the complete energy spectrum obtained with detectors at$ 144^{ \circ } $ (backward angle) for first target-stopper distance (${{D}} _{T-S} $ = 8 μm) has been shown in Fig. 2.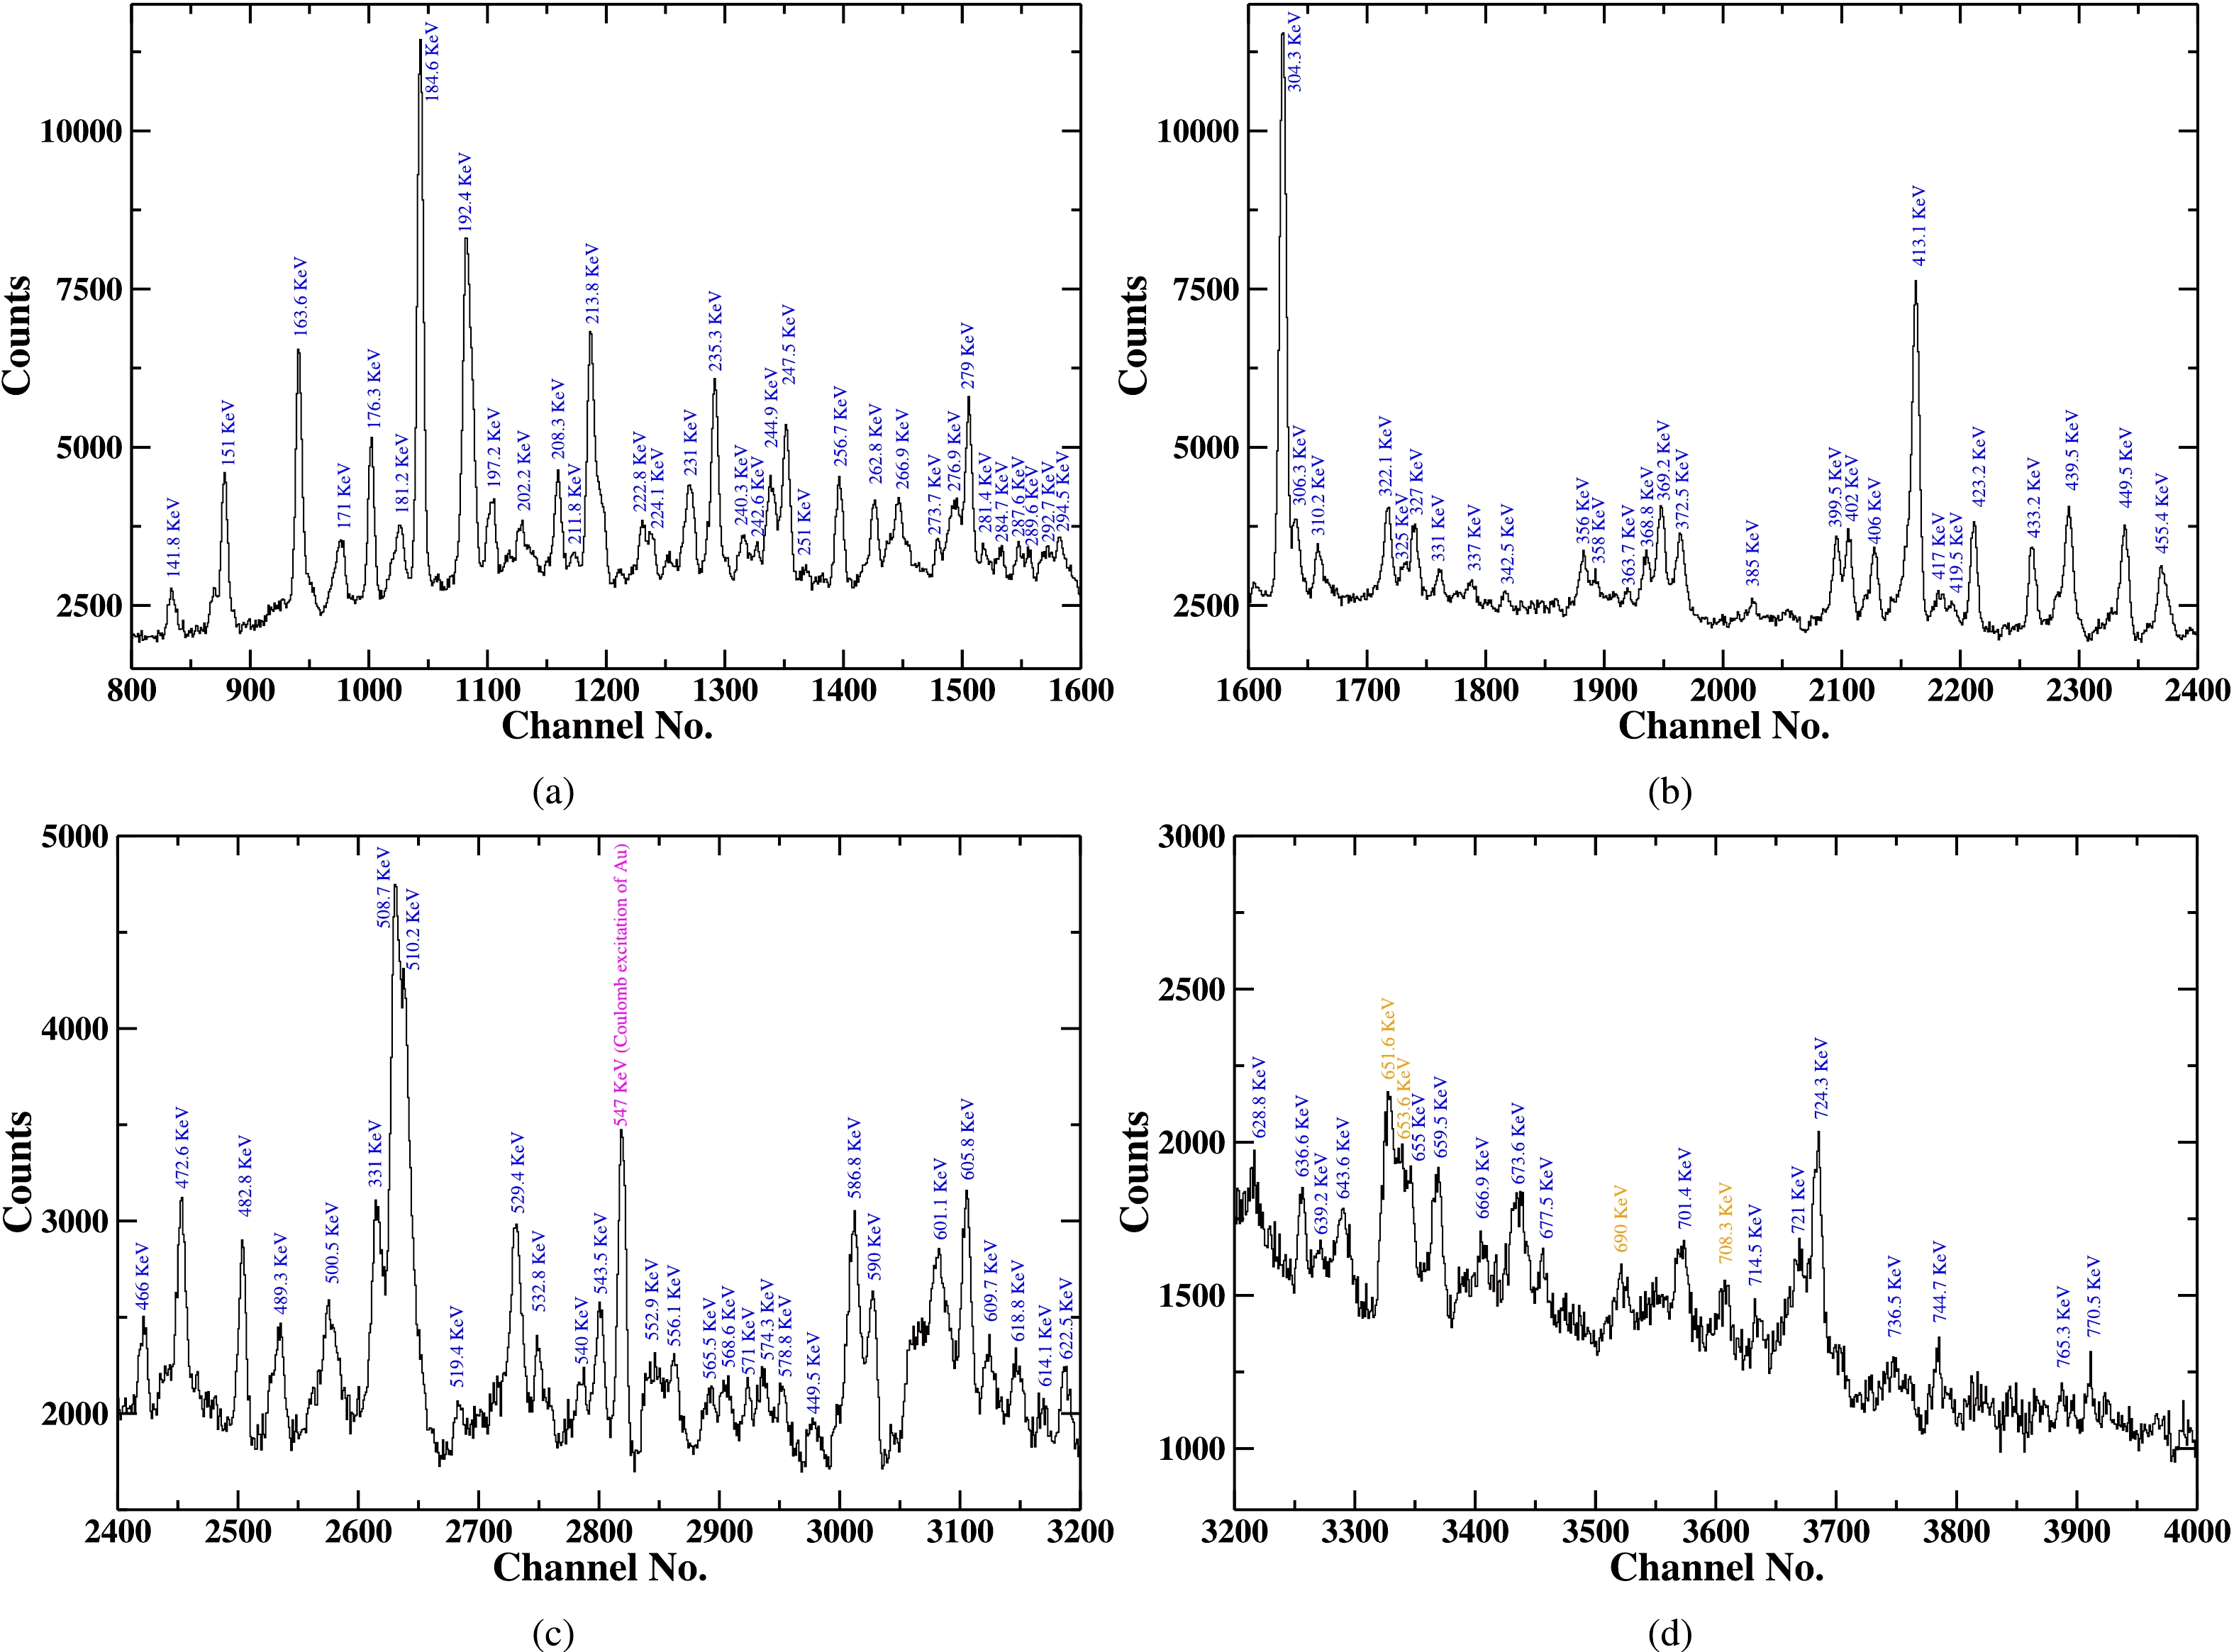
Figure 2. (color online) Complete energy spectra obtained with detectors at
$ 144^{ \circ } $ (backward angle) at first target-stopper distance ($ D _{T-S} $ = 8 μm), showing gamma-ray transtions from all bands populated in$ ^{177}{\rm Re} $ nucleus. The γ-ray transitions (marked in orange) are the peaks of contamination. -
For the observed gamma-ray transitions of interest, data from the four HPGe detectors at each angle were first gain-matched and then summed to produce a total spectrum at that angle. In this context, three resultant spectra corresponding to detectors at
$ 50^{ \circ } $ (forward angle),$ 99^{ \circ } $ , and$ 144^{ \circ } $ (backward angle) were produced. As an extensive level scheme of$ ^{177}{\rm Re} $ nucleus already exists [6], it was easy to identify the gamma-ray transitions of interest. -
The gamma energy peak of 327 keV (
$ 11/2^+ \rightarrow 7/2^+ $ ) is shown in Fig. 3. A closer examination of the level scheme [6] reveals that few nearby γ-ray energy transitions in the decay scheme could possibly contaminate the 327 keV γ-ray transition of interest. Notably, the 328.35 keV ($ 25/2^+ \rightarrow 21/2^+ $ ) γ-ray transition in Band 4, the 325.01 keV ($ 13/2^+ \rightarrow 9/2^+ $ ) γ-ray transition in Band 1, and the 327.97 keV ($ 23/2^+ \rightarrow 21/2^+ $ ) inter-connecting gamma transition between Band 1 and Band 2 could be the potential candidates for contamination. However, careful examination of the entire γ-ray energy spectrum shows that the transitions from Band 1 and Band 4 were not populated with enough intensity during measurement. From this spectrum, Fig. 2(b), it is clear that the intensity of first four lowest gamma-ray transitions of Band 1, specifically 281 keV ($ 9/2^+ \rightarrow 7/2^+ $ ), 325 keV ($ 13/2^+ \rightarrow 9/2^+ $ ), 367 keV ($ 15/2^+ \rightarrow 11/2^+ $ ), and 405 keV ($ 17/2^+ \rightarrow 13/2^+ $ ), is less than 10% of the intensity of first three lowest energy gamma-ray transitions (327 keV [$ 11/2^+ \rightarrow 7/2^+ $ ], 369 keV [$ 13/2^+ \rightarrow 9/2^+ $ ], and 402 keV [$ 15/2^+ \rightarrow 11/2^+ $ ]) of the πd-5/2. Conversely, the lowest gamma-ray transitions of Band 4, specifically 328 keV ($ 25/2^+ \rightarrow 21/2^+ $ ), 436 keV ($ 29/2^+ \rightarrow 25/2^+ $ ), and 524 keV ($ 33/2^+ \rightarrow 29/2^+ $ ), are not visible in the spectrum, as shown in Figs. 2 (b) and (c). Notably, no contamination affects the proposed γ-ray energy peak from nearby transitions. Therefore, the obtained intensity of 327 keV, normalized to the intensity of 547 keV Coulomb excited γ-ray energy peak of Au observed in the spectrum, is used for the lifetime analysis. The intensity variation of the shifted (S) and unshifted (U) energy components of the 327 keV γ-ray at three target-stopper distances is shown in Fig. 3 (a), while the representative fit of the unshifted gamma-ray energy peak at two target-stopper distances, 8 μm (first distance) and 323 μm (distance of minimum intensity), is shown in Fig. 3 (b).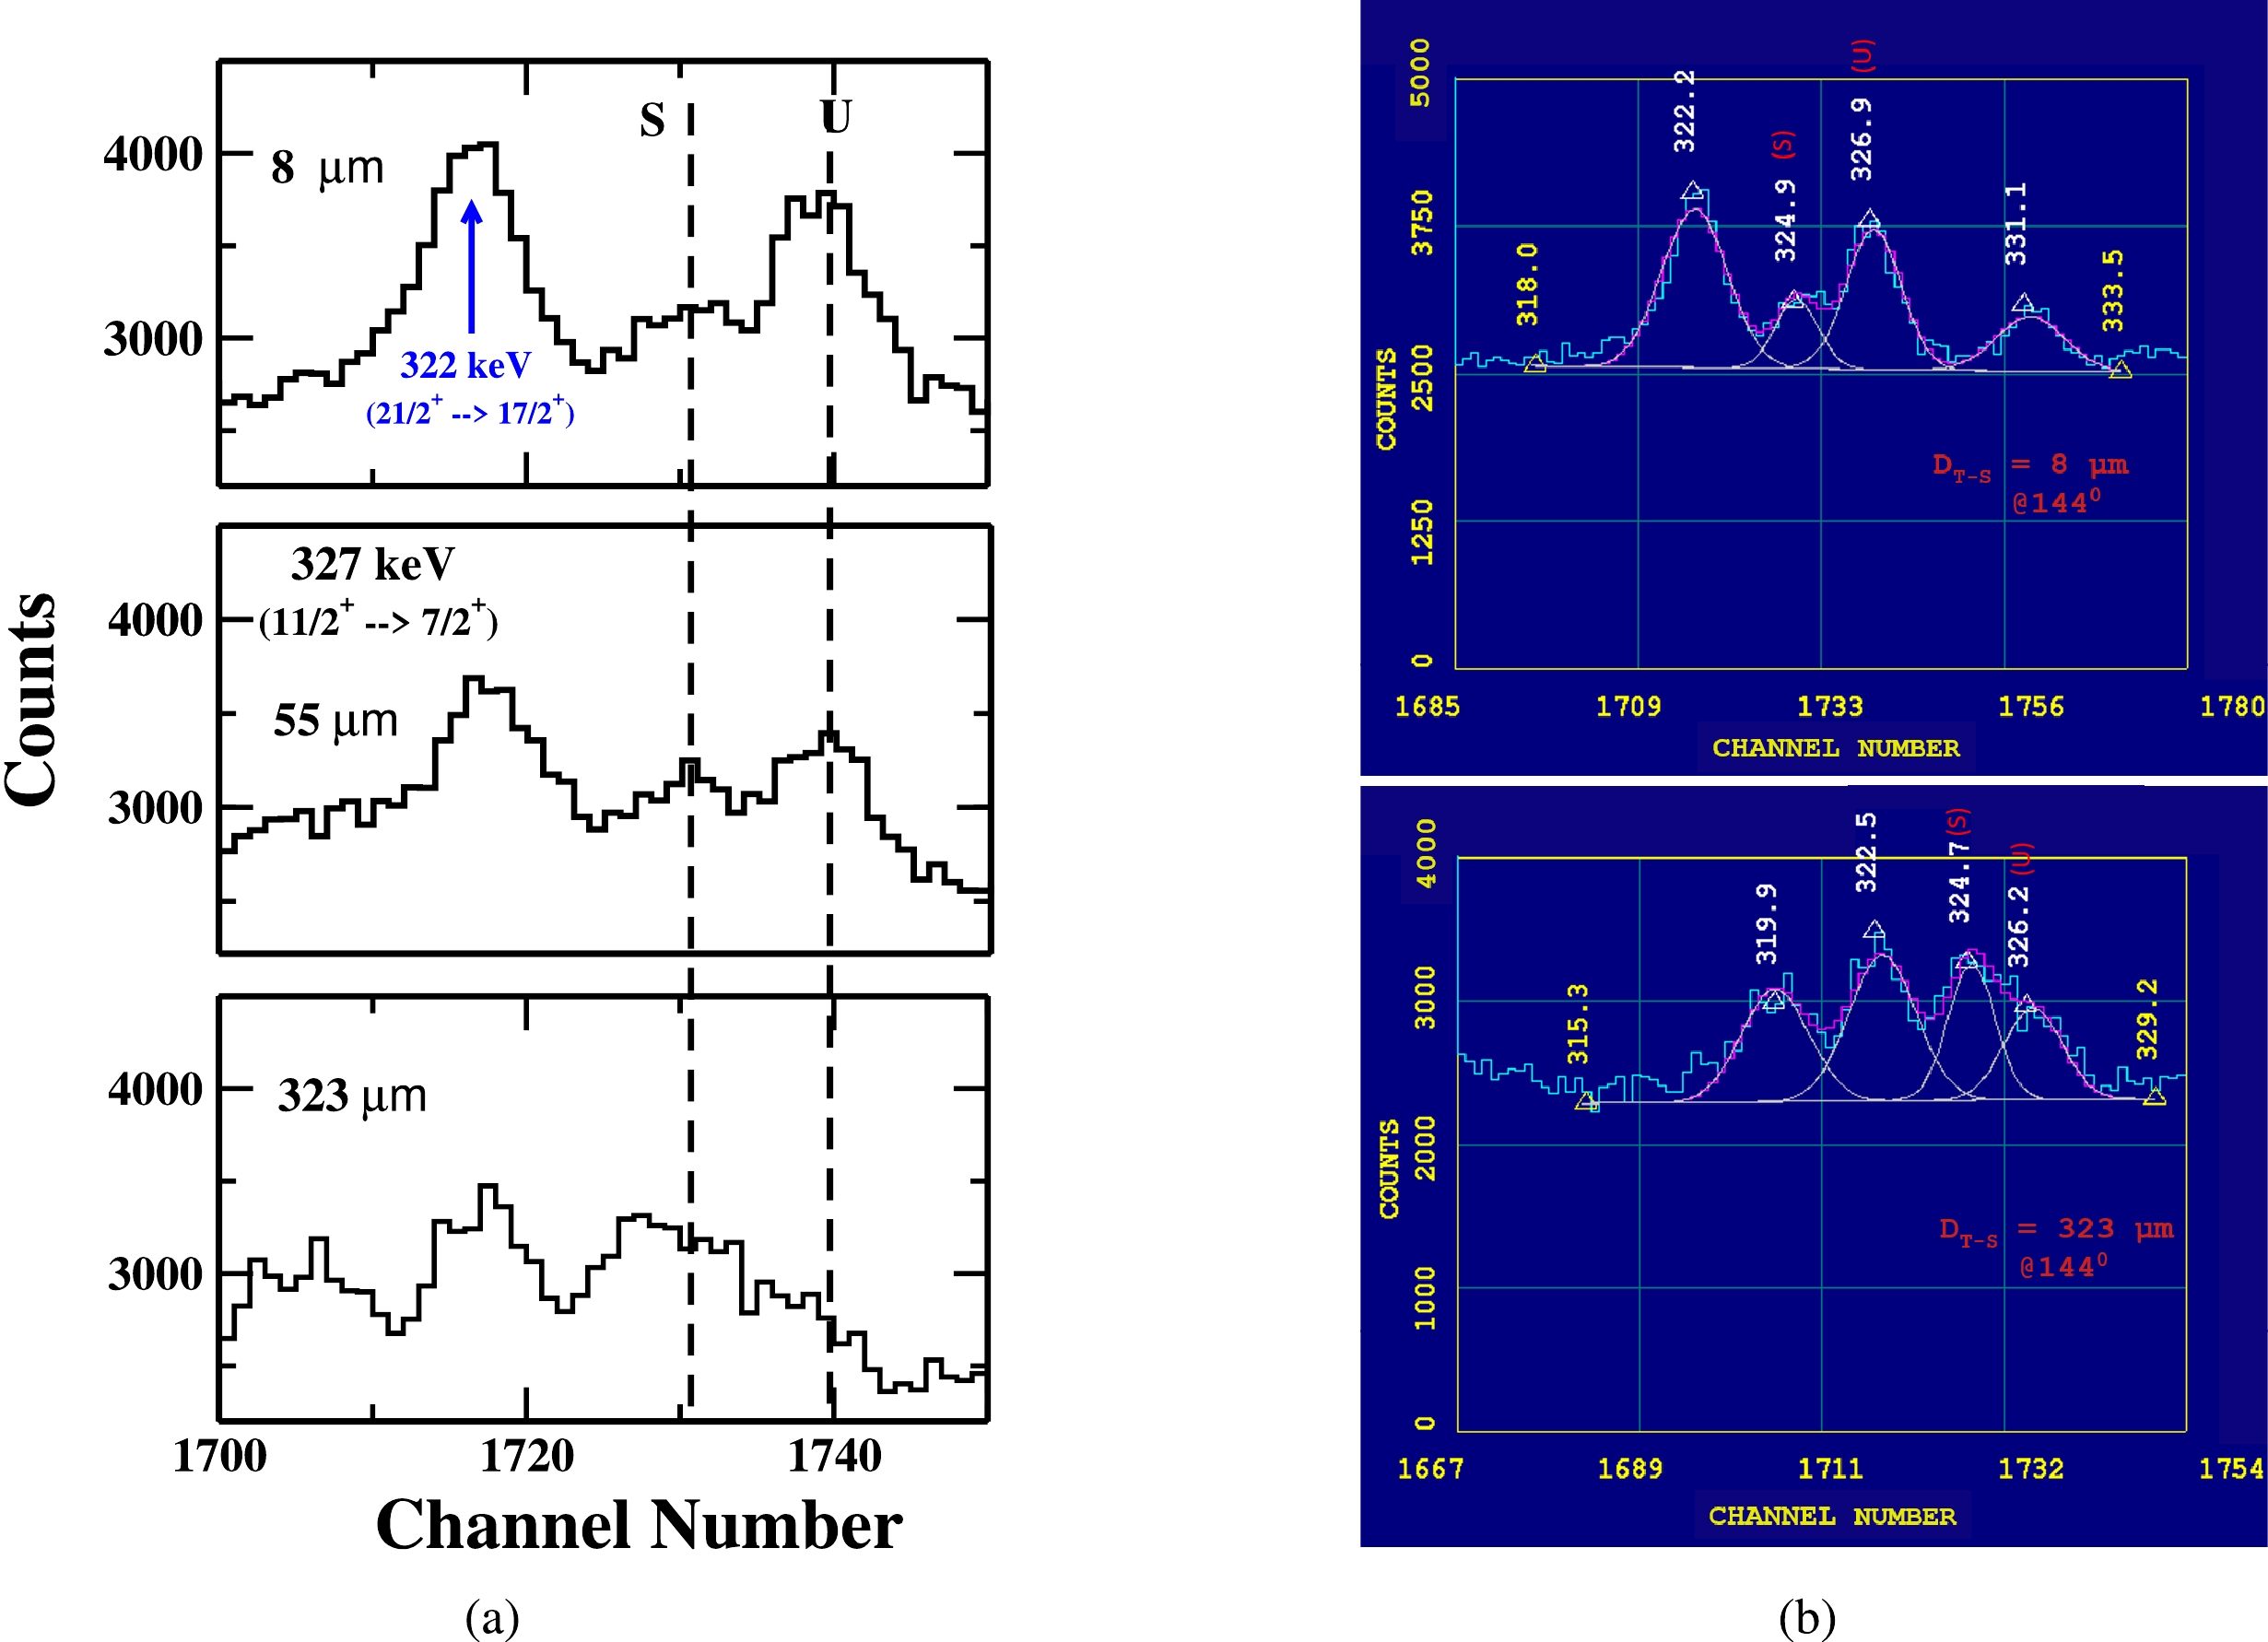
Figure 3. (color online) (a) A portion of energy spectrum showing the shifted (S) and unshifted (U) peaks of 327 keV γ-ray transition of yrast band in
$ ^{177}{\rm Re} $ at three different target-stopper distances (${{D}} _{T-S} $ ) and (b) A potion of energy spectrum showing the fitting of unshifted energy (U) of 327 keV (our peaks of interest) at${{D}} _{T-S} $ = 8 μm (first distance) and${{D}} _{T-S} $ = 323 μm (distance of minimum intensity). Data is taken with detectors at$ 144^{ \circ } $ with respect to the beam direction. (* The γ-ray energy peak marked in blue corresponds to the γ-ray transition belonging to Band 3 [6]) -
The gamma-ray energy peak of 402 keV (
$ 15/2^+ \rightarrow 11/2^+ $ ) shown in Fig. 4 is clearly visible without significant contamination from other decay transitions. To obtain the actual normalized intensity of 402 keV, only the fitted intensity of the unshifted component is normalized to the intensity of the 547 keV gamma-ray peak from the Coulomb excitation of gold. The intensity variation of the shifted (S) and unshifted (U) energy components of 402 the keV γ-ray at three target-stopper distances is shown in Fig. 4 (a), while the representative fit of the unshifted gamma-ray energy peak at two target-stopper distances, 8 μm (first distance) and 183 μm (distance of minimum intensity), is shown in Fig. 4 (b).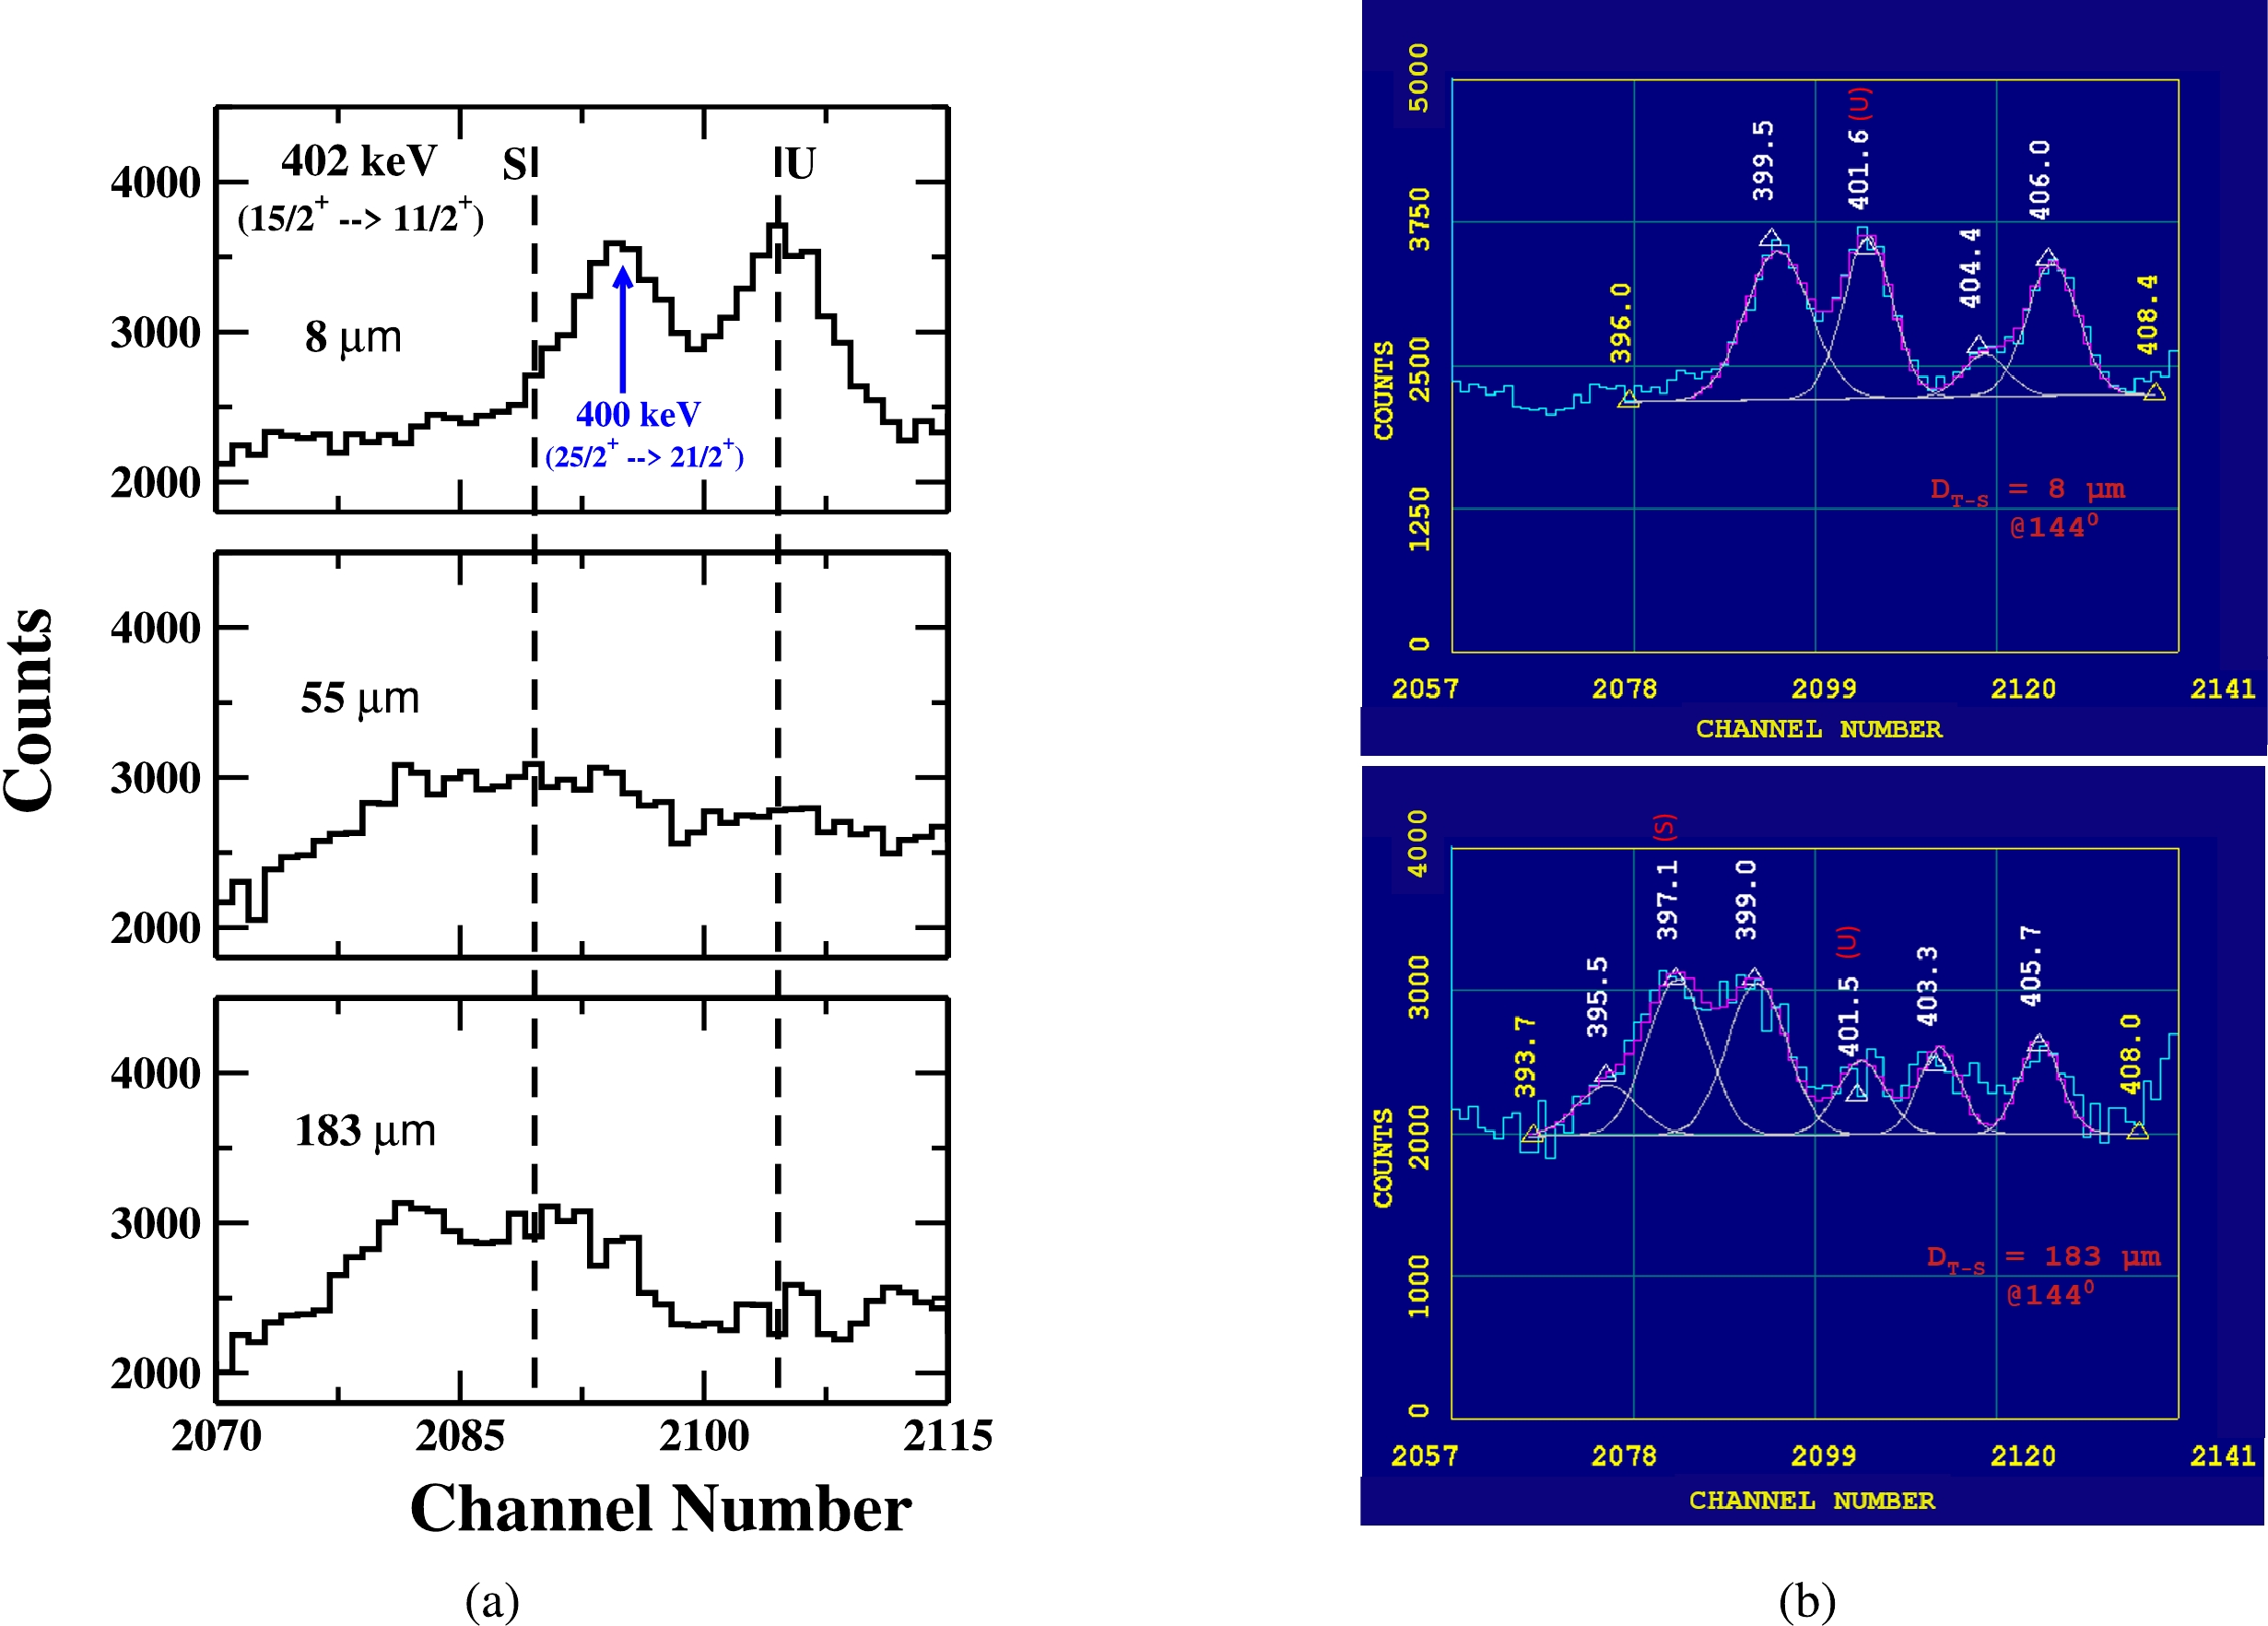
Figure 4. (color online) (a) A portion of energy spectrum showing the shifted (S) and unshifted (U) peaks of 402 keV γ-ray transition of yrast band in
$ ^{177}{\rm Re} $ at three different target-stopper distances (${{D}} _{T-S} $ ) and (b) A potion of energy spectrum showing the fitting of unshifted energy (U) of 402 keV (our peaks of interest) at${{D}} _{T-S} $ = 8 μm (first distance) and${{D}} _{T-S} $ = 183 μm (distance of minimum intensity). Data are obtained with detectors at$ 144^{ \circ } $ relative to the beam direction. (* The γ-ray energy peak marked in blue corresponds to the γ-ray transition belonging to Band 3 [6].) -
The gamma energy peak of 439 keV (
$ 19/2^+ \rightarrow 15/2^+ $ ), as shown in Fig. 5, potentially influences the intensity from two gamma-transitions with 437.48 keV ($ 19/2^+ \rightarrow 15/2^+ $ ) in Band 1 and 439 keV ($ 19/2^+ \rightarrow 15/2^+ $ ) in Band 2 (our gamma-ray transition of interest). However, a careful examination of the entire γ-ray energy spectrum reveals that the γ-ray energy transitions of Band 1 are not sufficiently populated in the present measurement. Therefore, the possibility of contamination by the intensity of 437.48 keV ($ 19/2^+ \rightarrow 15/2^+ $ ) in Band 1 can be excluded. The intensity variation of the shifted (S) and unshifted (U) energy components of 439 keV γ-ray at three target-stopper distances is shown in Fig. 5 (a), while the representative fit of the unshifted gamma-ray energy peak at two target-stopper distances; 8 μm (first distance) and 103 μm (distance of minimum intensity) is shown in Fig. 5 (b).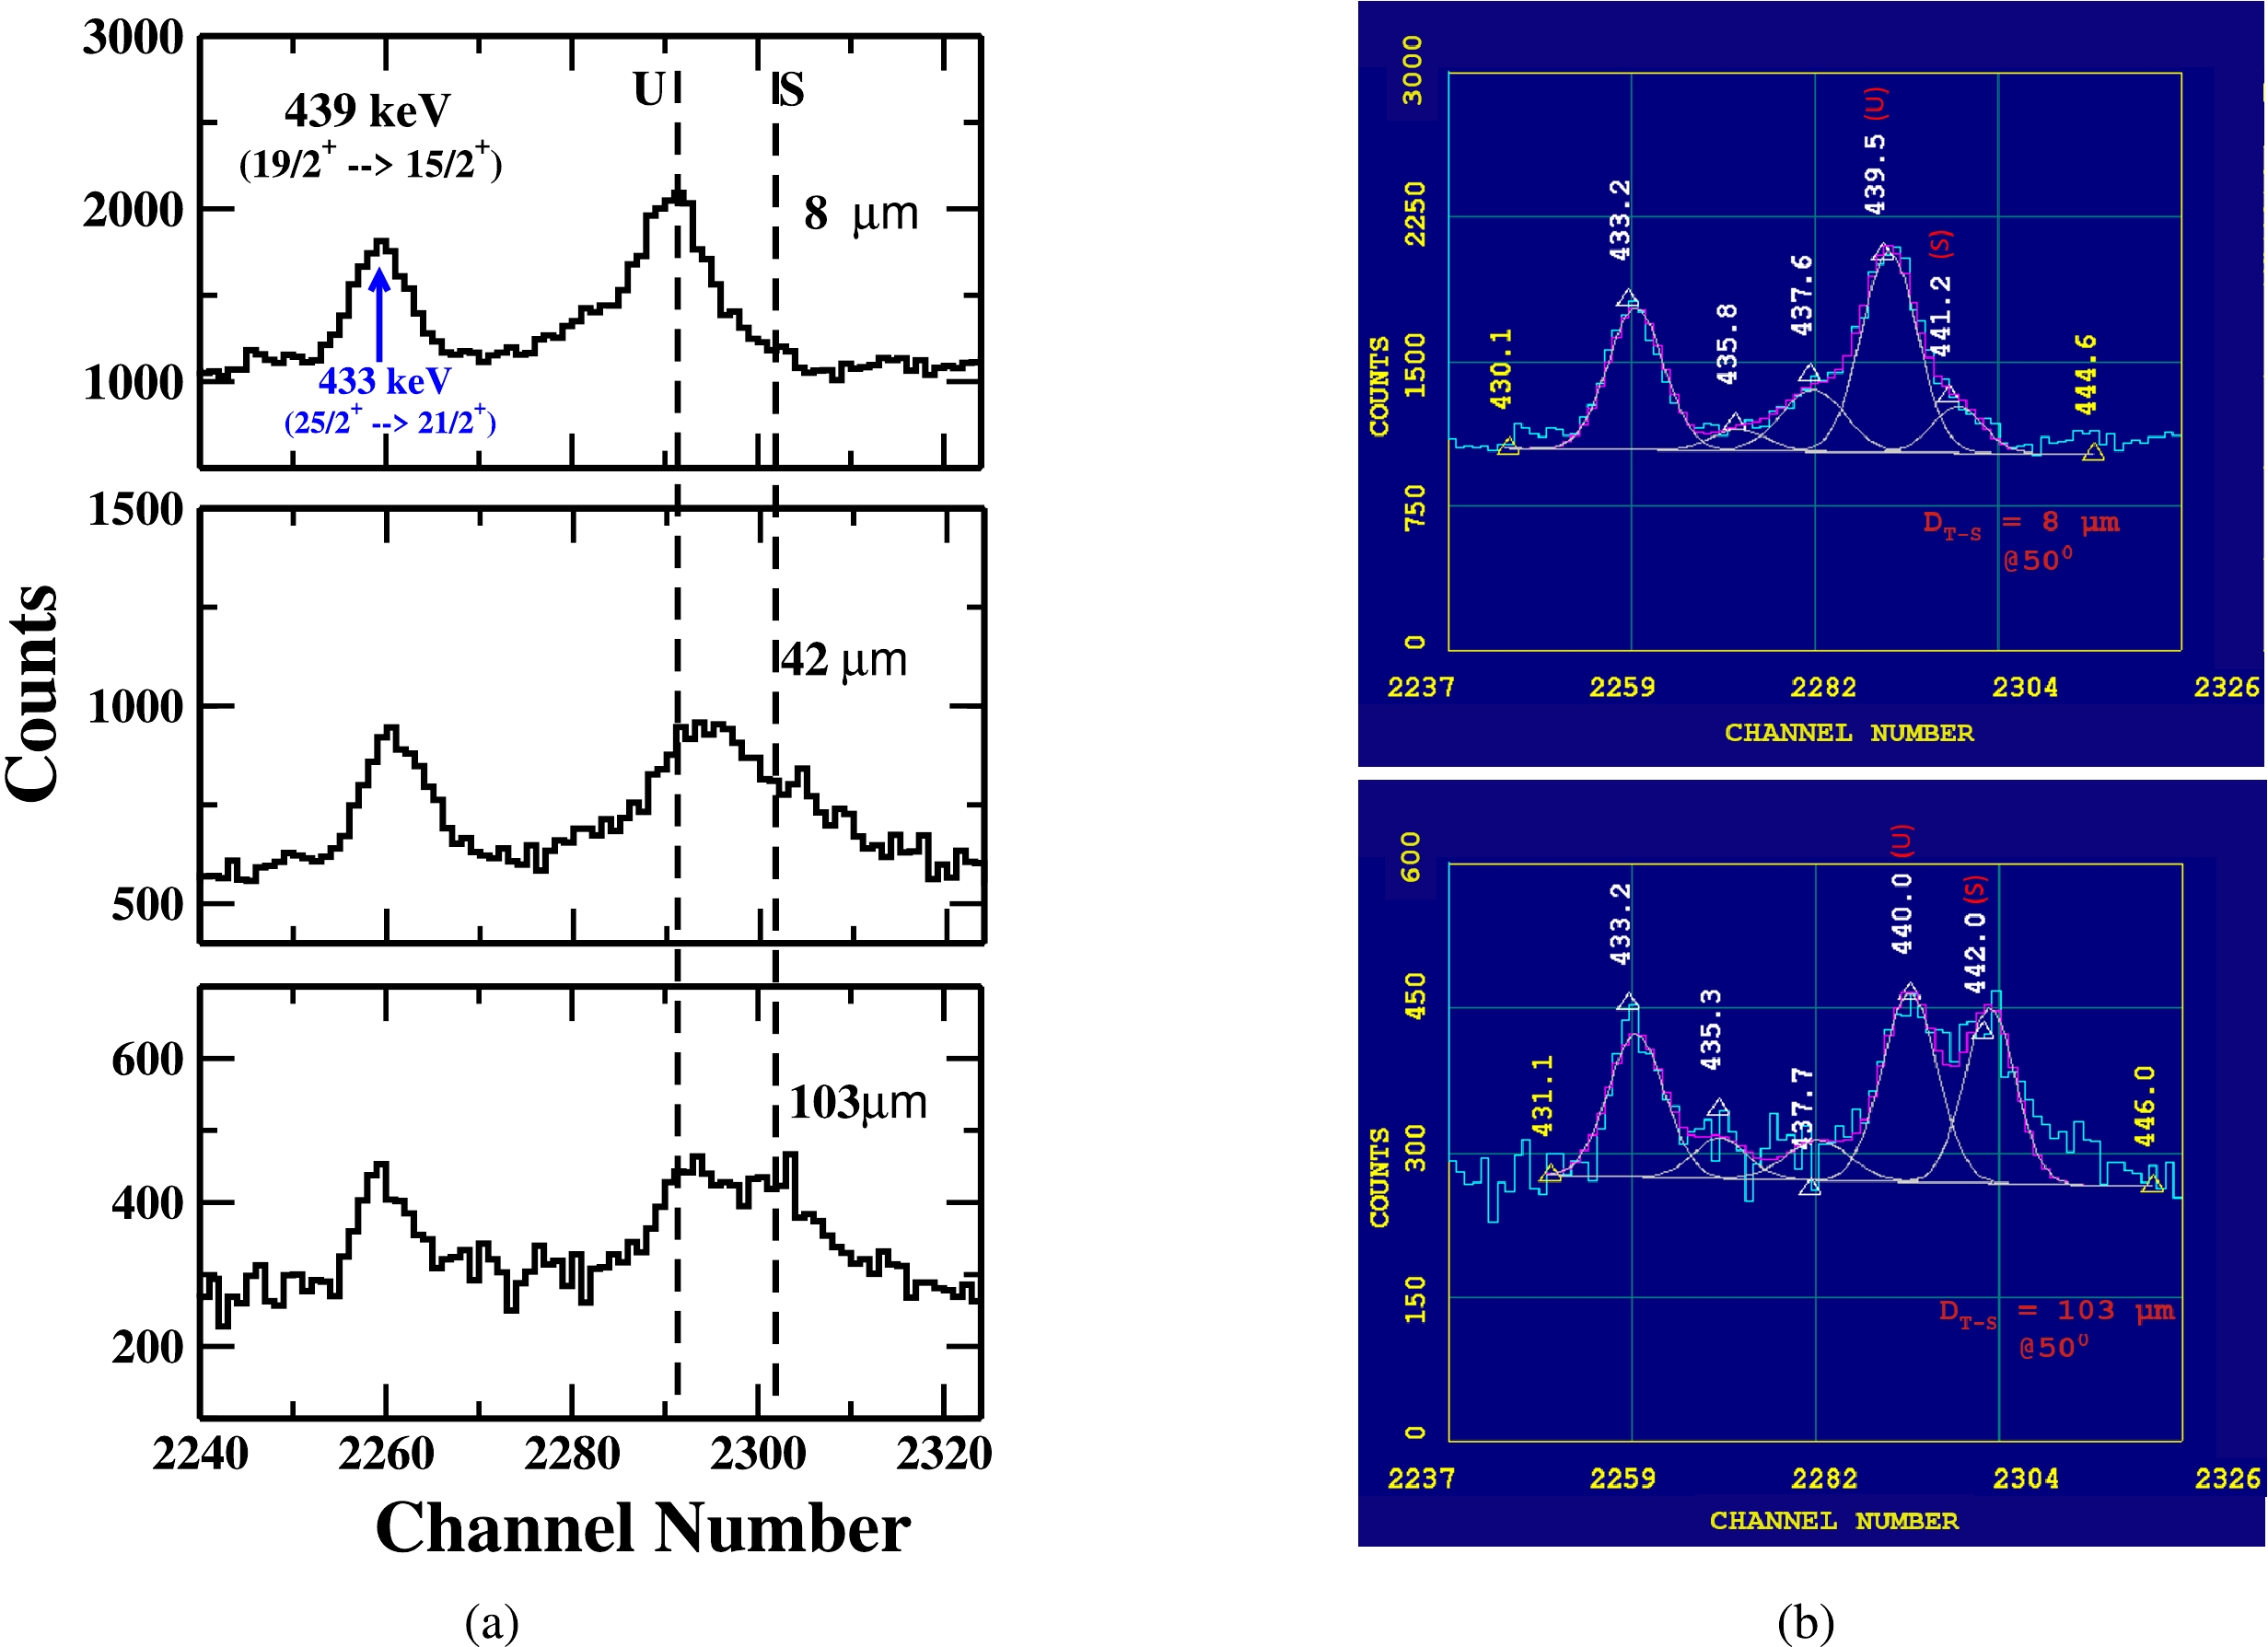
Figure 5. (color online) A portion of energy spectrum showing the shifted (S) and unshifted (U) peaks of 439 keV γ-ray transition of yrast band in
$ ^{177}{\rm Re} $ at three different target-stopper distances (${{D}} _{T-S} $ ) and (b) A potion of energy spectrum showing the fitting of unshifted energy (U) of 439 keV (our peaks of interest) at${{D}} _{T-S} $ = 8 μm (first distance) and${{D}} _{T-S} $ = 103 μm (distance of minimum intensity). Data are obtained with detectors at$ 50^{ \circ } $ relative to the beam direction. (* The γ-ray energy peak marked in blue corresponds to the γ-ray interlinking transition from Band 3 to Band 2 [6].) -
The gamma energy peak of 473 keV (
$ 23/2^+ \rightarrow 19/2^+ $ ), as shown in Fig. 6, has the possibility of contamination from the two γ-ray transitions: the 472.14 keV ($ 31/2^+ \rightarrow 27/2^+ $ ) γ-ray transition in Band 6 and the 470.49 keV γ-ray transition in Band 10. Analyzing the level scheme and the entire γ-energy spectrum of$ ^{177}{\rm Re} $ nucleus shows that Band 10 is not populated in present measurements, as none of the lowest-energy gamma-ray transitions are visible in the total energy spectrum. However, when examining the intensity of lowest 285 keV gamma ray transition ($ 23/2^+ \rightarrow 19/2^+ $ ) in the total energy spectrum Fig. 2, Band 6 is populated with less than 10% of the intensity of Band 2. Therefore, possible contamination of the 472.14 keV gamma-ray transition from Band 6 in the proposed gamma-ray transition of interest at 473 keV is estimated to be less than 10 %. Thus, the γ-transitions of the energies 472.14 keV ($ 31/2^+ \rightarrow 27/2^+ $ ) in Band 6 and 470.49 keV in Band 10 can be easily excluded. Subsequently, the net intensity of the gamma transition of 473 keV is normalized to the intensity of 547 keV gamma ray peak from the Coulomb excitation of gold and used for the present lifetime analysis. The intensity variation of the shifted (S) and unshifted (U) energy components of 473 keV γ-ray at three target-stopper distances is shown in Fig. 6 (a), while the fit of the unshifted gamma-ray energy peak at two target-stopper distances, at 8 μm (first distance) and 70 μm (distance of minimum intensity), is shown in Fig. 6 (b).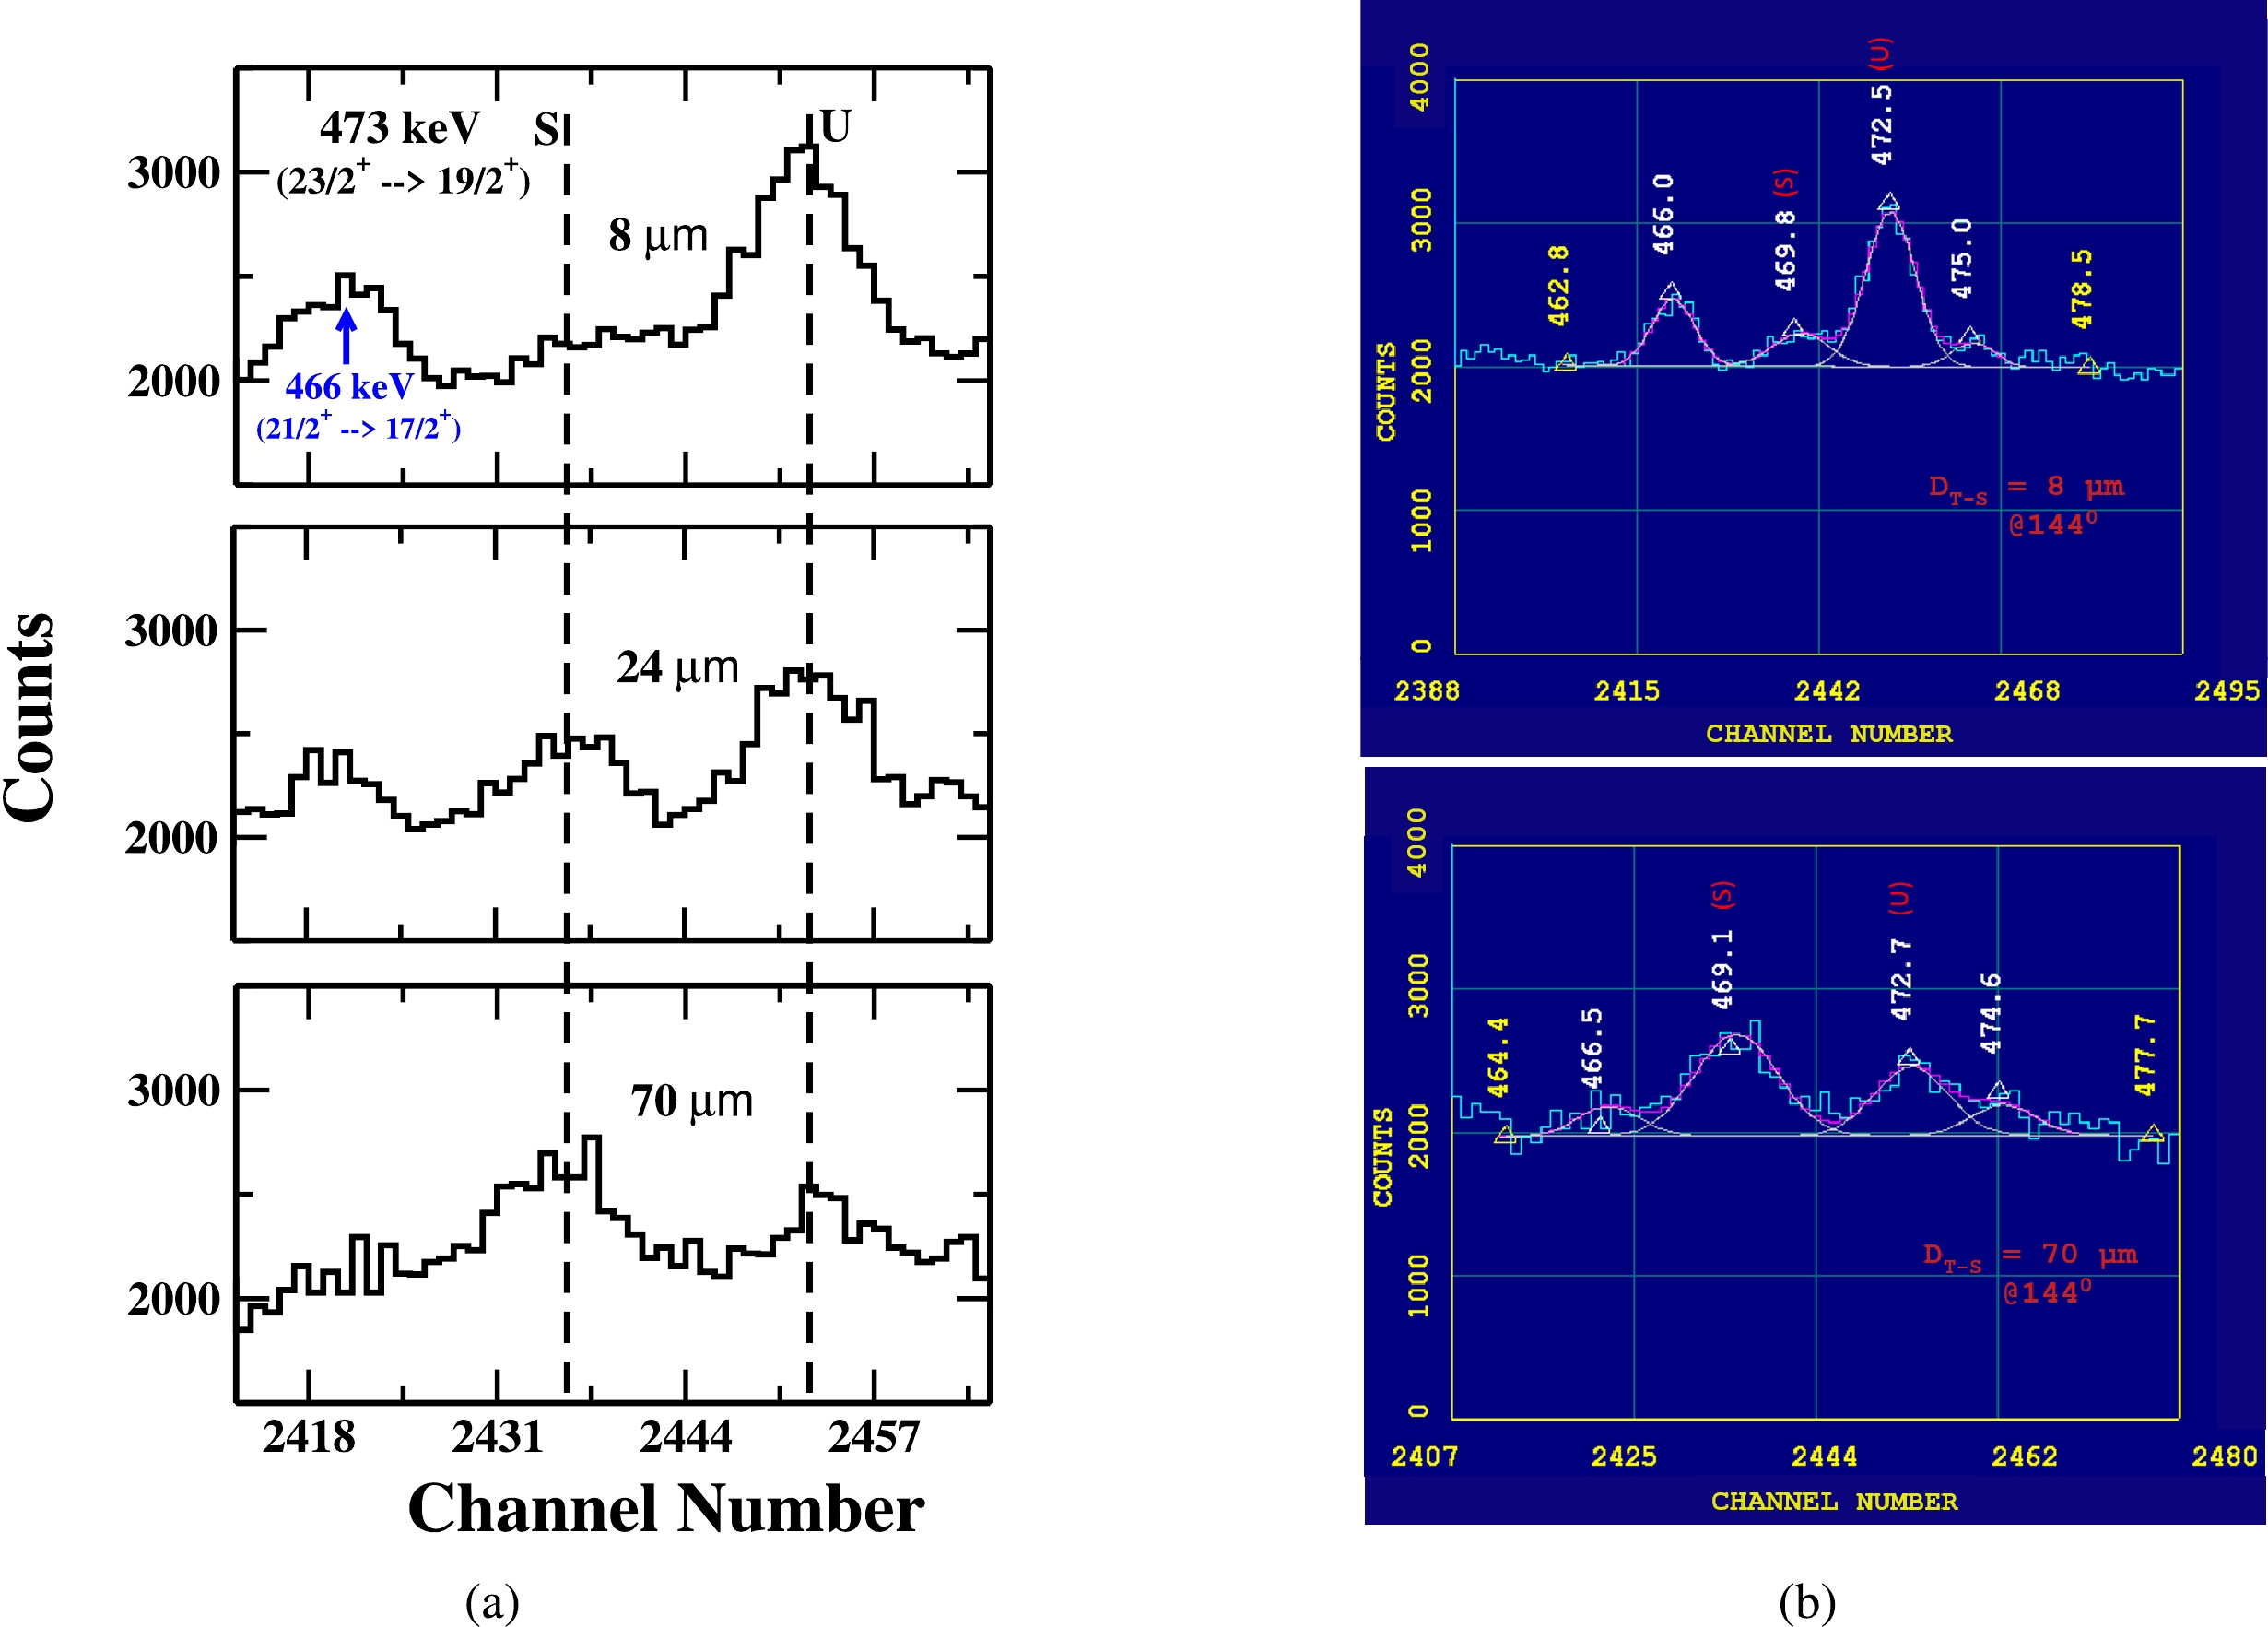
Figure 6. (color online) A portion of energy spectrum showing the shifted (S) and unshifted (U) peaks of 473 keV γ-ray transition of yrast band in
$ ^{177}{\rm Re} $ at three different target-stopper distances (${{D}} _{T-S} $ ) and (b) A potion of energy spectrum showing the fitting of unshifted energy (U) of 473 keV (our peaks of interest) at${{D}} _{T-S} $ = 8 μm (first distance) and${{D}} _{T-S} $ = 70 μm (distance of minimum intensity). Data are obtained with detectors at$ 144^{ \circ } $ relative to direction of the beam. (* The γ-ray energy peak marked in blue corresponds to the γ-ray transition belonging to Band 1 [6].) -
The gamma energy peak of 231 keV (
$ 17/2^+ \rightarrow 13/2^+ $ ) belonging to Band 3 is shown in Fig. 7. A careful examination of the decay scheme of the$ ^{177}{\rm Re} $ nucleus suggests possible contamination of this γ-ray transition by a few nearby γ-ray transitions, with the 230.44 keV ($ 33/2^+ \rightarrow 31/2^+ $ ) γ-ray transition in Band 19 and the 231.26 keV ($ 21/2^+ \rightarrow 19/2^+ $ ) inter-connecting γ-ray transition in Band 2 being possible candidates for the contamination. A close inspection of the entire energy spectrum reveals no gamma-ray energy peak at 230.44 keV, indictaing that Band 19 is not populated in the present measurement. Therefore, the 230.44 keV transition ($ 33/2^+ \rightarrow 31/2^+ $ ) can be excluded as a potential contaminant. The 231 keV γ-energy transition shown in Fig. 7 may include contributions from only two nearby energies: the 231.26 keV ($ 21/2^+ \rightarrow 19/2^+ $ ) (inter-connecting γ-ray transition in Band 2) and 231 keV gamma-ray energy of interest.
Figure 7. (color online) A portion of energy spectrum showing the shifted (S) and unshifted (U) peaks of 231 keV γ-ray transition of yrast band in
$ ^{177}{\rm Re} $ at three different target-stopper distances (${{D}} _{T-S} $ ) and (b) A potion of energy spectrum showing the fitting of unshifted energy (U) of 231 keV (our peaks of interest) at${{D}} _{T-S} $ = 8 μm (first distance) and${{D}} _{T-S} $ = 323 μm (distance of minimum intensity). Data are obtained with detectors at$ 144^{ \circ } $ with respect to the beam direction. (* The γ-ray energy peak marked in blue corresponds to the γ-ray transition belonging to Band 15 [6].)To compare the relative populations of Bands 2 and 3 in the present measurement with those reported in Ref. [6], we compared the intensities of the 400 keV transition from Band 3 and the 402 keV transition from Band 2, as observed in our measurements and those reported in Ref. [6]. In our measurements, the ratio of intensity of 402 keV (Band 3) to the 400 keV (Band 2) is found to be 1.05 (3%), while the ratio of the intensities of the two transitions reported in Ref. [6] is found to be 1.07 (2%). The same ratio (within experimental error) of population of the two bands in our measurements and that reported in Ref. [6] shows that the relative population of various bands is consistent between the two studies, despite using different reactions to populate the bands. Therefore the data reported in Ref. [6] for intensity of various gamma-ray transitions can also be used in present analysis. As per the intensity table [6], the intensity of 231 keV (
$ 17/2^+ \rightarrow 13/2^+ $ ) is 54.1 and the intensity of other γ-transition 231.26 keV ($ 21/2^+ \rightarrow 19/2^+ $ ) in Band 2 is 117.5, respectively. Thus, in step 1, the total intensity of 231 keV peak obtained in the experiment is divided in the ratio of 31.5 % and 68.5 % at each target-stopper distance. Also as for the interlinking γ-transition 231.26 keV ($ 21/2^+ \rightarrow 19/2^+ $ ) in Band 2 from the state (21/2+), the mean lifetime (τ = 4.4 ps, the upper limit of the lifetime) has been measured and previously reported [3]. In step 2, using the target-stopper distances covered and recoil velocity of nuclei obtained in this experiment, the intensity of 231.26 keV γ-transition at each target-stopper distance is found using the following expression:$ I = I_{ \circ } {\rm e}^{\frac{-d}{v\tau}}, $

(1) where d is the target–stopper distance, τ is the mean lifetime of state (21/2+), and v is the recoil velocity. In the present experiment, by examining the location of the shifted (
$ E _s $ ) and unshifted ($ E _u $ ) gamma-ray energy peaks for various gamma transitions of interest and considering the angle of the detectors relative to the beam direction, the recoil velocity of the excited$ ^{177}{\rm Re} $ nuclei is found to be 2.7 μm/ps using following well known formula [7]:$ E_s = E_u \left(1+\frac{v}{c} \cos \theta \right). $

(2) This recoil velocity was obtained under the following assumptions: (i) both the target and stopper foils are sufficiently thin to account for the loss of energy of the recoil nuclei as they pass through them; (ii) all Re nuclei are produced in the excited state due to the reaction of the incoming beam particles with the target foil, with no reaction occuring elsewhere within the middle or target; (iii) there is a complete vacuum between the target and stopper foils in the plunger setup, ensuring that no energy loss occurs for the recoil
$ ^{177}{\rm Re} $ nuclei; (iv) the recoiling$ ^{177}{\rm Re} $ nuclei after reaching at the stopper foil stopped immediately on its surface; (v) both the target and stopper are of uniform thickness; and (vi) the detector opening angle is small, thus there is no spread in the angle subtended by detector at the target foil. Now taking the difference of the two intensities (intensity in step 1−intensity in step 2) at each target-stopper distance and adding that difference to the intensity obtained in step 1, the actual intensity of 231 keV (17/2$ ^+ \rightarrow $ 13/2+) γ-transition of Band 3 at each target-stopper (${{D}} _{T-S} $ ) distance was obtained. The resulting intensity of 231 keV ($ 17/2^+ \rightarrow $ 13/2+) γ-transition, obtained using the limiting value (maximum possible) of lifetime value 21/2+ state in Band 2, was then normalized to the intensity of the 547 keV gamma energy peak from the Coulomb excitation of gold. This normalized intensity was used in the present lifetime analysis. The intensity variation of the shifted (S) and unshifted (U) energy components of 231 keV γ-ray at three target-stopper distances is shown in Fig. 7 (a), while the representative fit of the unshifted gamma-ray energy peak at two target-stopper distances, 8 μm (first distance) and 323 μm (distance of minimum intensity), is shown in Fig. 7 (b). -
The gamma-ray energy peak 322 keV (
$ 21/2^+ \rightarrow 17/2^+ $ ) is shown in Fig. 8. A careful analysis of the level scheme of$ ^{177}{\rm Re} $ suggest the possible contamination of this γ-ray energy by the following γ-ray transitions: the 322 keV ($ 43/2^+ \rightarrow 41/2^+ $ ) γ-ray transition in Band 19, the 323.19 keV ($ 39/2^+ \rightarrow 37/2^+ $ ) γ-ray transition in Band 18, the 323.97 keV ($ 43/2^+ \rightarrow 41/2^+ $ ) γ-ray transition in Band 20, the 319.32 keV ($ 15/2^- \rightarrow 11/2^- $ ) γ-ray transition in Band 7, and the 320.01 keV ($ 31/2^+ \rightarrow 29/2^+ $ ) inter-connecting γ-ray transition between Bands 5 and 6. Examining the full energy spectrum obtained in the present measurement and shown in Fig. 2, it appears that none of the γ-ray energy transitions in Bands 5, 6, 7, 18, 19, and 20 were obtained with sufficient intensity. Therefore, the possibility of contamination of our γ-ray energy peak of interest by these nearby γ-transitions can be excluded. The net intensity of the 322 keV transition, as shown in Fig. 8, represents the total intensity of our gamma transition of interest. The intensity variation of the shifted (S) and unshifted (U) energy components of 322 keV γ-ray at three target-stopper distances is shown in Fig. 8 (a), while the representative fit of the unshifted gamma-ray energy peak at two target-stopper distances, 8 μm (first distance) and 163 μm (distance of minimum intensity), is shown in Fig. 8 (b).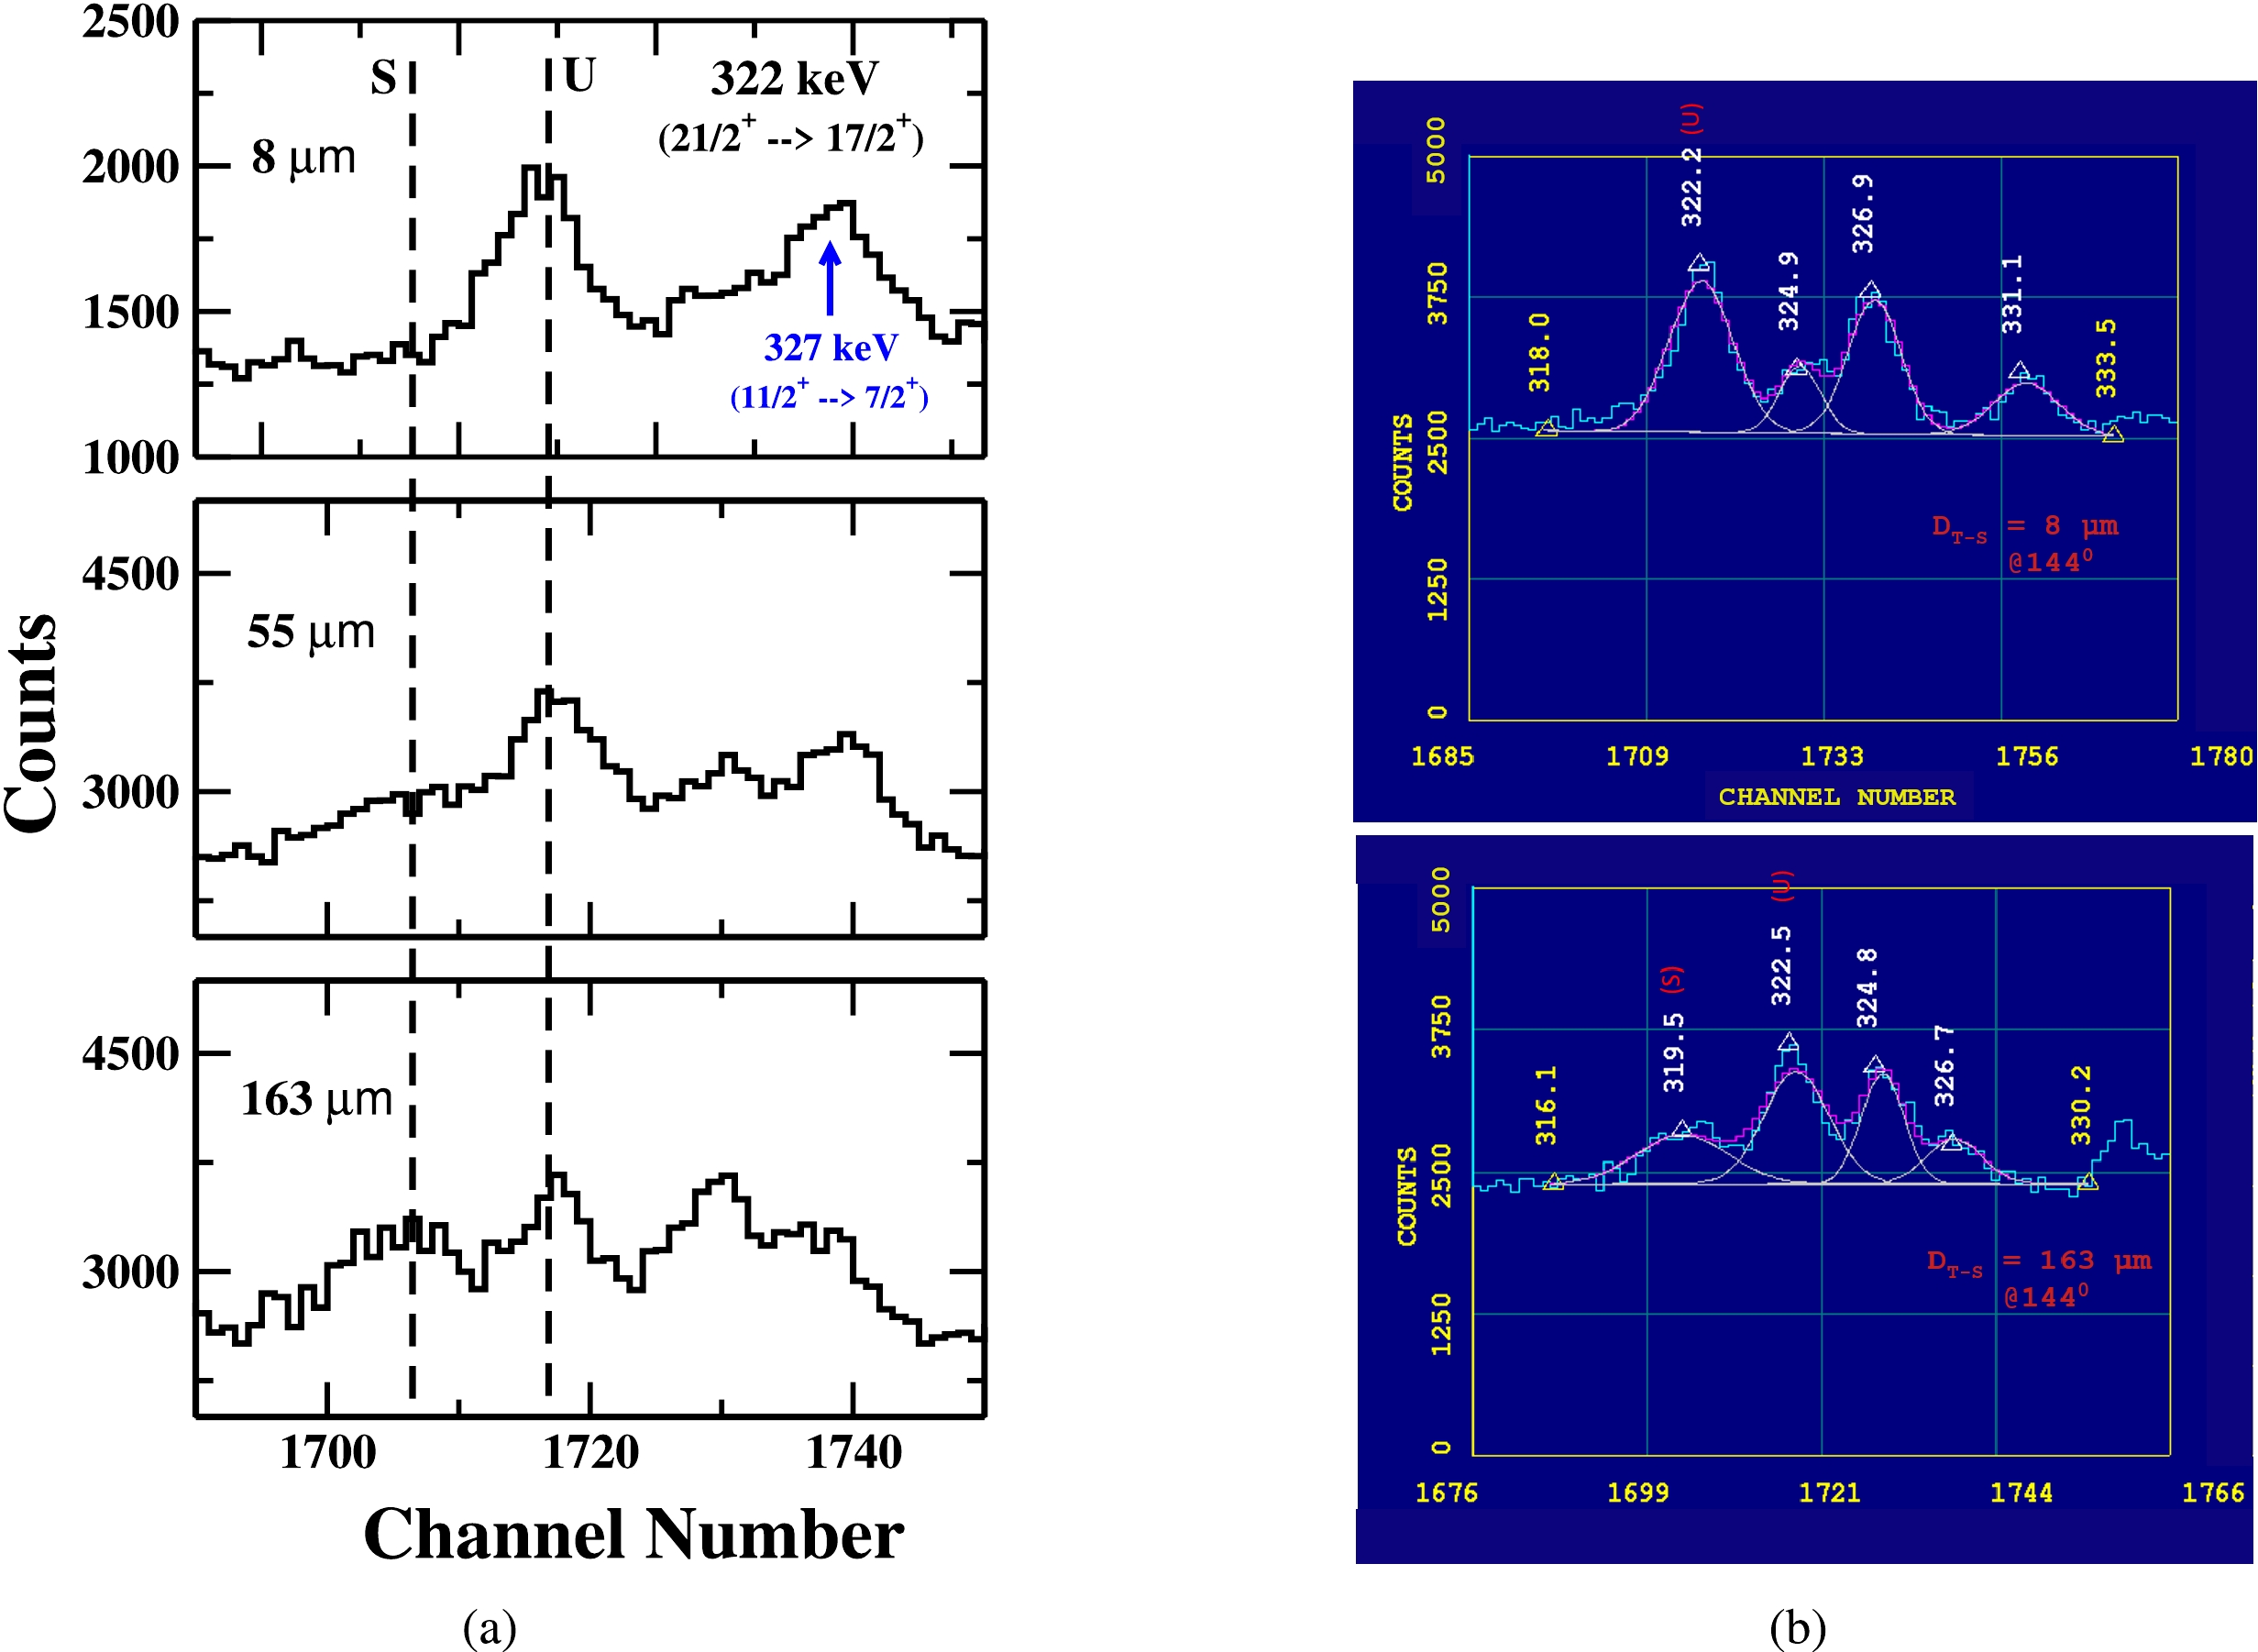
Figure 8. (color online) A portion of energy spectrum showing the shifted (S) and unshifted (U) peaks of 322 keV γ-ray transition of yrast band in
$ ^{177}{\rm Re} $ at three different target-stopper distances (${{D}} _{T-S} $ ) and (b) A potion of energy spectrum showing the fitting of unshifted energy (U) of 322 keV (our peaks of interest) at${{D}} _{T-S} $ = 8 μm (first distance) and${{D}} _{T-S} $ = 163 μm (distance of minimum intensity). Data are obtained with detectors at$ 144^{ \circ } $ relative to the beam direction. (* The γ-ray energy peak marked in blue corresponds to the γ-ray transition belonging to Band 2 [6].) -
The gamma-ray energy peak of 400 keV (
$ 25/2^+ \rightarrow 21/2^+ $ ) in Band 3 is shown in Fig. 9. This γ-ray peak is clearly observed without significant contamination from other decay transitions. Therefore, the actual intensity of the 400 keV γ-ray energy peak is used in the present lifetime analysis. The intensity variation of the shifted (S) and unshifted (U) energy components of 400 keV γ-ray at three target-stopper distances is shown in Fig. 9 (a), while the representative fit of the unshifted gamma-ray energy peak at two target-stopper distances, 8 μm (first distance) and 123 μm (distance of minimum intensity), is shown in Fig. 9 (b).
Figure 9. (color online) A portion of energy spectrum showing the shifted (S) and unshifted (U) peaks of 400 keV γ-ray transition of yrast band in
$ ^{177}{\rm Re} $ at three different target-stopper distances (${D} _{T-S} $ ) and (b) A potion of energy spectrum showing the fitting of unshifted energy (U) of 400 keV (our peaks of interest) at${{D}} _{T-S} $ = 8 μm (first distance) and${{D}} _{T-S} $ = 123 μm (distance of minimum intensity). Data are obtained with detectors at$ 50^{ \circ } $ relative to the beam direction. (* The γ-ray energy peaks marked in blue correspond to γ-ray transitions 400 keV and 406 keV belonging to Bands 2 and 15, respectively [6].) -
The gamma-ray energy peak of 450 keV (
$ 29/2^+ \rightarrow 25/2^+ $ ) in Band 3 is shown in Fig. 10. A careful examination of the level scheme$ ^{177}{\rm Re} $ nucleus indicates that this gamma-energy peak may be contaminated by other two γ-decay transitions: the 448.41 keV ($ 29/2^+ \rightarrow 25/2^+ $ ) in Band 17 and the 449.08 keV ($ 17/2^- \rightarrow 13/2^- $ ) in Band 15. However, a detailed assessment of the complete energy spectrum indicates that transitions from Band 17 are not being populated in the present measurement. This conclusion is based on the population of the four lowest gamma-ray transitions of Band 17 (i.e., 151, 180, 211, and 391 keV) in the complete energy spectrum shown in Fig. 2. Although a large gamma-ray peak appears at 151 keV in complete energy spectrum (Fig. 2 (a)), it corresponds to the 151.4 keV ($ 9/2^+ \rightarrow 7/2^+ $ ) transition from Band 2, not from Band 17. Similarly, the peak at 181.2 keV observed in the spectrum (Fig. 2 (a)) is from Band 18 (transition from$ 27/2^+ \rightarrow 25/2^+ $ ), while no peak at 180 keV (Band 17) is observed in the complete energy spectrum. Additionally, a small peak is observed at 211.2 keV in the complete energy spectrum (Fig. 2 (a)) corresponds to the 211.10 keV ($ 17/2^+ \rightarrow 15/2^+ $ ) gamma-ray transition from Band 1, not from Band 17. Regarding the 391 keV gamma-ray transition from Band 17, no gamma-ray energy peak is observed in the complete energy spectrum (Fig. 2 (b)). Thus, the contamination of intensity by the transition 448.41 keV ($ 29/2^+ \rightarrow 25/2^+ $ ) in Band 17 can be excluded from the intensity calculations. To separate the intensity of contaminant γ-transition 449.08 keV ($ 17/2^- \rightarrow 13/2^- $ ) of Band 15 from our peak of interest, the following procedure was adopted: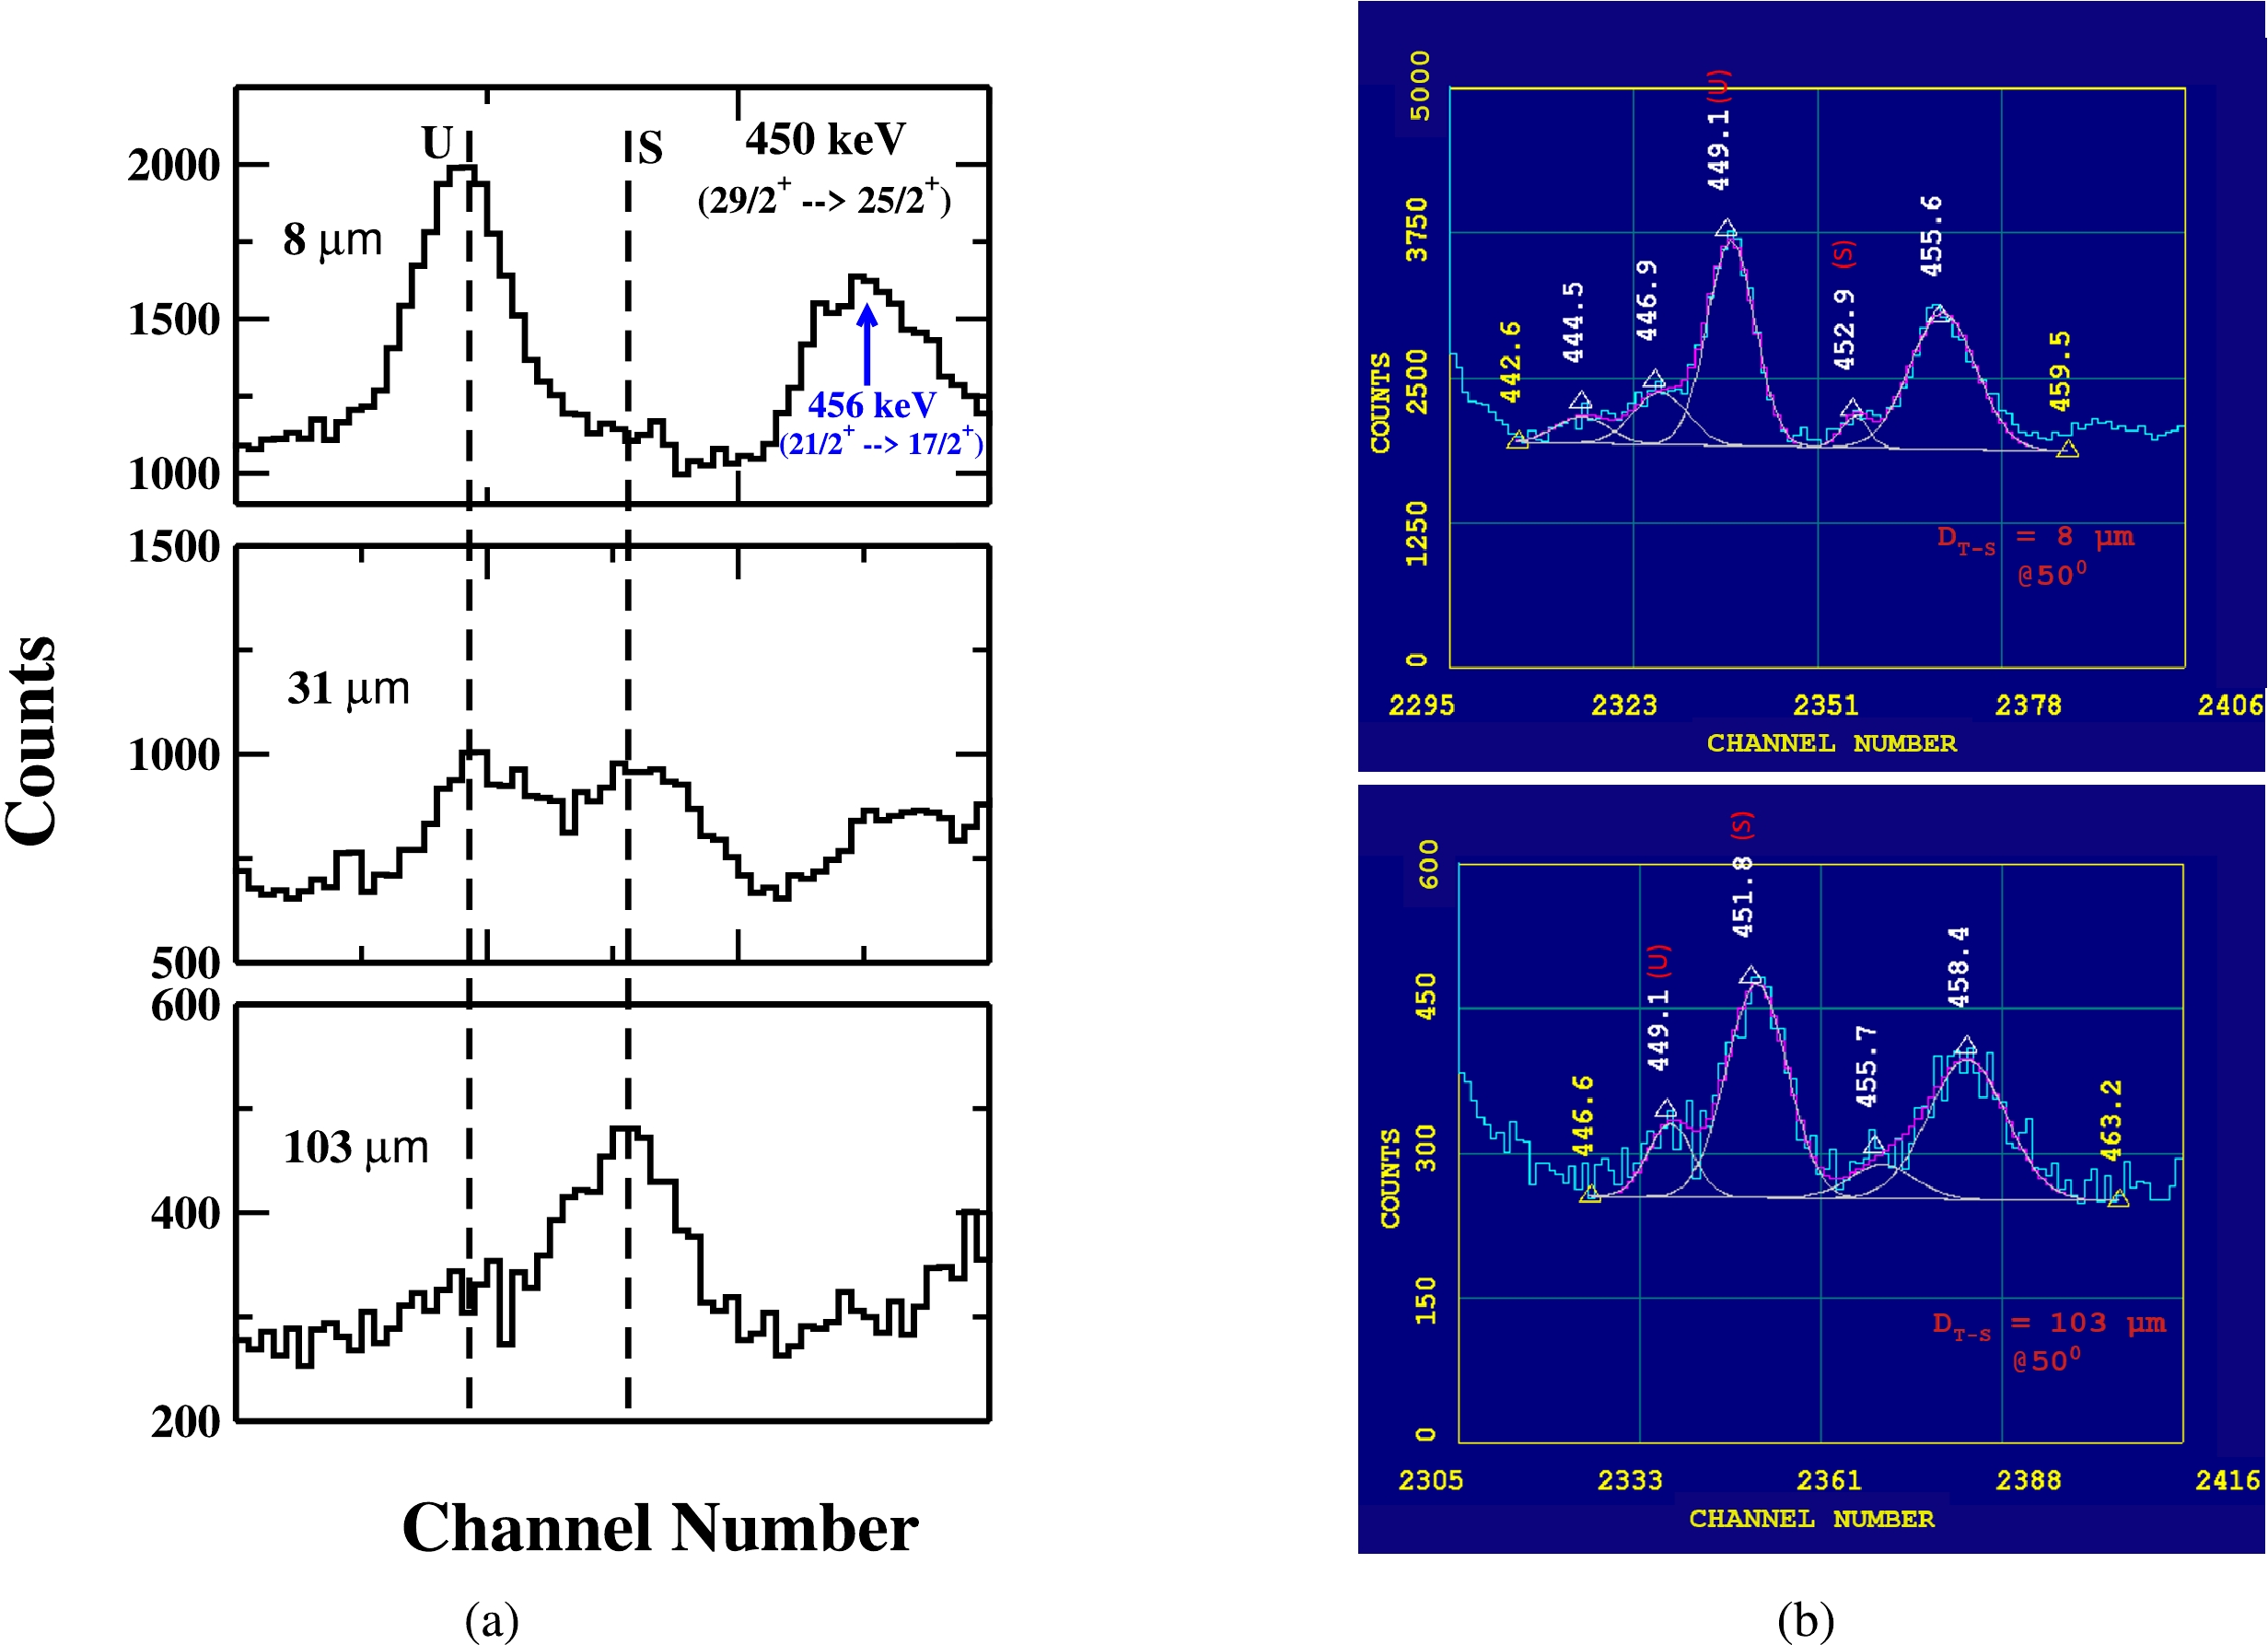
Figure 10. (color online) A portion of energy spectrum showing the shifted (S) and unshifted (U) peaks of 450 keV γ-ray transition of yrast band in
$ ^{177}{\rm Re} $ at three different target–stopper distances (${{D}} _{T-S} $ ) and (b) A potion of energy spectrum showing the fitting of unshifted energy (U) of 450 keV (our peaks of interest) at${{D}} _{T-S} $ = 8 μm (first distance) and${{D}} _{T-S} $ = 103 μm (distance of minimum intensity). Data are obtained with detectors at$ 50^{ \circ } $ relative to the beam direction. (* The γ-ray energy peak marked in blue corresponds to the γ-ray transition belonging to Band 2 [6].)As per the intensity table [6], the relative intensity of two gamma-transitions of energy 449.08 keV (
$ 17/2^- \rightarrow 13/2^- $ ) and 450 keV ($ 29/2^+ \rightarrow 25/2^+ $ ) are 324 and 270, respectively. Thus, in the first step, the total intensity of 450 keV peak obtained in the experiment is divided in the ratio of 54.5 % and 45.5 % at each target–stopper distance. Additionally, the 449.08 keV γ-ray transition from the decay of state ($ 17/2^- $ ) in Band 15 lies between two decay states:$ 19/2^- $ and$ 15/2^- $ . Given that the lifetimes of both states have already been measured and reported in previous studies [3], the transition probability (i.e., the B(E2) value) for the ($ 17/2^- \rightarrow 15/2^- $ ) transition was determined by taking the average of the reported B(E2) values for ($ 19/2^- \rightarrow 15/2^- $ ) and ($ 15/2^- \rightarrow 11/2 $ ) gamma-ray transitions. Using the B(E2) value obtained for the ($ 17/2^- \rightarrow 15/2^- $ ) transition, the mean lifetime (τ = 2.4 ps) of the state ($ 17/2^- $ ) is obtained using the following relation:$ B(E2; J_i \rightarrow J_f) = \frac{0.0816 B_\gamma}{\tau E_\gamma^5 (1+\alpha_{t})}, $

(3) where τ is the level lifetime (in ps),
$ E_\gamma $ denotes the γ-ray energy of transition (in MeV),$ B_\gamma $ is the branching ratio and$ \alpha_t $ represents the total internal conversion coefficient.Using the lifetime of τ = 2.4 ps of
$ 17/2^- $ state, the actual intensity of 450 keV ($ 29/2^+ \rightarrow 25/2^+ $ ) gamma-transition is obtained using the same procedure described earlier for the actual intensity of 231 keV γ-transition in Band 3. Thus, the actual intensity of our γ-transition 450 keV ($ 29/2^+ \rightarrow 25/2^+ $ ) in Band 3 is obtained at various target–stopper distances and subsequently used in the lifetime analysis. The intensity variation of the shifted (S) and unshifted (U) energy components of 450 keV γ-ray at three target–stopper distances is shown in Fig. 10 (a), while the representative fit of the unshifted gamma-ray energy peak at two target-stopper distances, 8 μm (first distance) and 103 μm (distance of minimum intensity), is shown in Fig. 10 (b). -
The basic strategy of the PSM approach is similar to that of the spherical shell model, with the only difference that a deformed basis is used for diagonalizing the shell model Hamiltonian rather than a spherical one. This deformed basis is constructed by solving the triaxial Nilsson potential using optimal quadrupole deformation parameters of
$ \epsilon$ and$ \epsilon' $ . In principle, the deformed basis can be constructed using arbitrary deformation parameters. However, the basis is typically constructed with expected or known deformation parameters (referred to as the optimum values) for a given system under consideration. These deformation values lead to an accurate Fermi surface, and it is possible to choose a minimal subset of the basis states around the Fermi surface for a realistic description of a given system. The Nilsson basis states are then transformed to the quasiparticle space using the simple Bardeen-Cooper-Schriefer (BCS) ansatz for treating the pairing interaction.The inclusion of multi-quasiparticle basis space in the PSM approach has made it feasible to investigate both the ground-state properties and high-spin band structures in deformed and transitional nuclei [11]. Using the PSM approach, odd-proton systems have previously been studied with a model space comprising one-proton and one-proton coupled to two-neutron quasiparticle states. However, to investigate the high-spin spectroscopy of these systems, the basis space needs to be extended by including proton aligning configurations in addition to the neutron states. In our study, this extended basis space has been implemented, and the complete basis space in the generalized approach is given by
$ : $ $ \begin{array}{r} \; \; \hat P^I_{MK}\; a^\dagger_{\pi_1} |\Phi\rangle;\\ \; \; \hat P^I_{MK}\; a^\dagger_{\pi_1}a^\dagger_{\nu_1}a^\dagger_{\nu_2} |\Phi\rangle;\\ \; \; \hat P^I_{MK}\; a^\dagger_{\pi_1}a^\dagger_{\pi_2}a^\dagger_{\pi_3} |\Phi\rangle;\\ \; \; \hat P^I_{MK}\; a^\dagger_{\pi_1}a^\dagger_{\pi_2} a^\dagger_{\pi_3}a^\dagger_{\nu_1} a^\dagger_{\nu_2} |\Phi\rangle; \end{array} $

(4) where
$ |\Phi\rangle; $ is the triaxially-deformed quasiparticle vacuum state.$ P^I_{MK} $ is the three-dimensional angular-momentum-projection operator given by [12]$ : $ $ \hat P ^{I}_{MK}= \frac{2I+1}{8\pi^2}\int {\rm d} \Omega\, D^{I}_{MK} (\Omega)\,\hat R(\Omega), $

(5) with the rotation operator
$ \hat R(\Omega)= {\rm e}^{-{\rm i}\alpha \hat J_z}{\rm e}^{-{\rm i}\beta \hat J_y} {\rm e}^{-{\rm i}\gamma \hat J_z}. $

(6) Where
$ ''\Omega'' $ represents the set of Euler angles ($ \alpha, \gamma = [0,2\pi], ~\beta= [0, \pi] $ ) and$ \hat{J}^{,}s $ are the angular-momentum operators. The angular-momentum projection operator in Eq. (5) projects out the good angular-momentum but also states having good K-values by specifying a value for K in the rotational matrix,$ ''D'' $ in Eq. (5). The constructed projected basis of Eq. (4) is then used to diagonalize the shell model Hamiltonian, consisting of the harmonic oscillator single-particle Hamiltonian and a residual two-body interaction comprising of quadrupole-quadrupole, monopole pairing, and quadrupole pairing terms. These terms represent specific correlations considered essential for describing the low-energy nuclear phenomena. The Hamiltonian is expressed as:$ \hat H = \hat H_0 - {1 \over 2} \chi \sum\limits_\mu \hat Q^\dagger_\mu \hat Q^{}_\mu - G_M \hat P^\dagger \hat P - G_Q \sum\limits_\mu \hat P^\dagger_\mu\hat P^{}_\mu . $

(7) Where
$ \hat H_0 $ is the spherical single-particle part of the Nilsson potential [13]. The QQ-force strength, χ, in Eq. (7) is related to the quadrupole deformation$ \epsilon$ as a result of the self-consistent HFB condition, and the relation is given by [14]:$ \chi_{\tau\tau'} = {{{2\over3}\epsilon\hslash\omega_\tau\hslash\omega_{\tau'}}\over {\hslash\omega_n\left<\hat Q_0\right>_n+\hslash\omega_p\left<\hat Q_0\right>_p}}, $

(8) where
$ \omega_\tau = \omega_0 a_\tau $ , with$ \hslash\omega_0=41.4678 A^{-{1\over 3}} $ MeV, and the isospin-dependence factor$ a_\tau $ is defined as$ a_\tau = \left[ 1 \pm {{N-Z}\over A}\right]^{1\over 3},\nonumber $

with
$ + (-) $ for$ \tau = $ neutron (proton). The harmonic oscillation parameter is given by$ b^2_\tau=b^2_0/a_\tau $ with$ b^2_0=\hbar/{(m\omega_0)}= A^{1\over 3} $ fm2. The monopole pairing strength$ G_M $ (in MeV) is of the standard form$ G_M = {{G_1 \mp G_2{{N-Z}\over A}}\over A}, $

(9) where the minus (plus) sign applies to neutrons (protons). In the present calculation, we select
$ G_1 $ and$ G_2 $ such that the calculated gap parameters reproduce the experimental mass differences. This choice of$ G_M $ is appropriate for the single-particle space employed in the present calculation, where three major oscillator shells are used for each type of nucleons ($ N= $ 3, 4, 5 major shells for both neutrons and protons). The quadrupole pairing strength$ G_Q $ is assumed to be proportional to$ G_M $ , with the proportionality constant fixed at 0.1 in accordance with standard practice. These interaction strengths, although not exactly the same, are consistent with those used earlier in the PSM calculations [15, 16]. Using the angular-momentum projected states as the basis, the spherical shell model Hamiltonian of Eq. (7) is assessed following the Hill– Wheeler approach. The generalized eigenvalue equation is given by:$ \sum\limits_{\kappa^{'}K^{'}}\{{\cal{H}}_{\kappa K \kappa^{'}K^{'}}^{I}-E{\cal{N}}_{\kappa K \kappa^{'}K^{'}}^{I}\}f^{I}_{\kappa^{'} K^{'}}=0, $

(10) where the Hamiltonian and norm kernels are given by
$ {\cal{H}}_{\kappa K \kappa^{'}K^{'}}^{I} = \langle \Phi_{\kappa}|\hat H\hat P^{I}_{KK^{'}}|\Phi_{\kappa^{'}}\rangle , \;\; {\cal{N}}_{\kappa K \kappa^{'}K^{'}}^{I}= \langle \Phi_{\kappa}|\hat P^{I}_{KK^{'}}|\Phi_{\kappa^{'}}\rangle. $

(11) The Hill–Wheeler wavefunction is given by
$ |\psi_{IM}{>} = \sum\limits_{\kappa K} f_{\kappa K}^{I}\hat {P}_{MK}^{I} |\Phi_{\kappa}\rangle {>}, $

(12) where
$ f_{\kappa K}^{I} $ are the variational coefficients, and the index ''κ'' designates the basis states of Eq. (4). The Hamiltonian in Eq. (7) is diagonalized using the projected basis. The obtained wavefunction can be written as:$ \psi^{\sigma}_{IM} = \sum\limits_{K,\kappa}a^{\sigma}_{\kappa K} \hat P^{I}_{MK}| \; \Phi_{\kappa}\rangle { >\,}. $

(13) Where the index ''σ'' denotes the states with same angular momentum and ''κ'' the basis states. In Eq. (13),
$ a^{\sigma}_{\kappa} $ are the amplitudes of the basis states κ. These wavefunctions are used to calculate the electromagnetic transition probabilities. The reduced electric quadrupole transition probability$ B(E2) $ from an initial state$ ( \sigma_i , I_i) $ to a final state$ (\sigma_f, I_f) $ is given by [17]:$ B(E2,I_i \rightarrow I_f) = {\frac {e^2} {2 I_i + 1}} | {\,< } \sigma_f , I_f || \hat Q_2 || \sigma_i , I_i{ >\,} |^2 . $

(14) The transitional quadruple moment can be obtained from B(E2) values using the following relation:
$ Q_t(I\rightarrow I') = \frac{1}{(I0, 20|I'0)}\sqrt{\frac{4\pi}{5}\frac{2I' +1}{2I+1}}B(E2; I \rightarrow I'). $

(15) As in our earlier publications [15, 16, 18−20], we use effective charges of 1.6 e (for protons) and 0.6 e (for neutrons). Effective charges are employed instead of bare charges because the core is considered in the PSM approach, and valance particles occupy only three major oscillator shells. In Ab-initio approaches, where no core is assumed, only bare charges are required. The PSM calculations proceed in several stages. In the first stage, the deformed basis space is constructed by solving the triaxially-deformed Nilsson potential. In this study, we perform PSM calculations using two deformation values: one with a deformation value of
$ \epsilon=0.21 $ and the other with a larger value of$ \epsilon=0.28 $ [21]. In Tables 1 and 2, we present the B(E2) transition probabilities and$ Q_t $ . Notably, the measured values are reproduced with the larger value of$ \epsilon=0.28 $ . In Ref. [21], the deformation value has been calculated using Woods-Saxon potential and this value may not be the optimum one in the TPSM study. The non-axial deformation parameter$ \epsilon' = 0.100 $ is chosen to accurately describe the behavior of the γ band. The configuration space employed corresponds to three principal oscillator shells$ \nu[4,5,6] $ and$ \pi[3,4,5] $ . The pairing strengths have been parameterized in terms of two constants$ G_1 $ and$ G_2 $ . In this study, we select$ G_1 $ = 21.14 MeV and$ G_2 $ = 13.86 MeV; with these pairing strengths, we approximately reproduce the experimental odd-even mass differences in this region. The quadrupole pairing strength$ G_Q $ is assumed to be proportional to$ G_M $ , and the proportionality constant is set to 0.18. In the second step, the good angular-momentum states are obtained from the deformed basis by employing the three-dimensional angular-momentum projection technique. The projected bands obtained from one and three-quasiparticle states close to the Fermi surface, which is referred to as band diagram, are the diagonal matrix elements before band mixing. The projection from the one-quasiparticle configuration gives rise to band structures with$ K= $ 1/2, 5/2, 9/2, 13/2, and 3-qp bands with$ K= $ 3/2, 7/2, 11/2, 15/2, corresponding to the K value of different rotational bands. In the PSM calculation on$ ^{177} {\rm{Re}}$ nucleus, the band energies obtained after diagonalization are shown in Fig. 11 alongside the available experimental data. Notably, the PSM results show excellent agreement with the available experimental energies.Energy ( $ E _\gamma $ )

/keVSpin ( $ \hslash $ )

$ (I^{\pi}_{i} \rightarrow I^{\pi}_{f}) $ 

lifetime ( $ \tau $ )

/psConv. Coeff.
($ \alpha_t $ )

B(E2)
($ e^2b^2 $ )

${{Q}} _t $ 

/ebB(E2) ( $ e^2b^2 $ ) (PSM)

$ \varepsilon = 0.28 $ (

$ 0.21 $ )

${{Q}} _t $ /eb (PSM)

$ \varepsilon = 0.28 $ (

$ 0.21 $ )

327 11/2 $ ^{+}\rightarrow $ 7/2

$ ^{+} $ 

$ 17.0_{-1.2}^{+1.9} $ 

0.047 (7) $ 0.36_{-0.09}^{+0.14} $ 

$ 4.6_{-0.6}^{+0.9} $ 

0.40 (0.52) 4.8 (6.0) 402 15/2 $ ^{+}\rightarrow $ 11/2

$ ^{+} $ 

$ 4.2_{-0.4}^{+0.2} $ 

0.028 (4) $ 0.93_{-0.17}^{+0.08} $ 

$ 6.2_{-0.6}^{+0.3} $ 

0.94 (0.75) 5.9 (3.0) 439 19/2 $ ^{+}\rightarrow $ 15/2

$ ^{+} $ 

$ 2.8_{-0.5}^{+0.5} $ 

0.022 (4) $ 1.29_{-0.29}^{+0.29} $ 

$ 6.7_{-0.7}^{+0.7} $ 

1.17 (0.94) 6.5 (7.0) 473 23/2 $ ^{+}\rightarrow $ 19/2

$ ^{+} $ 

< 1.7 0.019 > 1.70 > 7.4 1.01 (1.17) 7.1 (7.2) Table 1. The experimental and calculated B(E2)(PSM) results for different γ-ray transitions of interest of the
$ \pi d_{5/2} $ (Band 2)$ ^{177}{\rm Re} $ nucleus.Energy ( ${{E}} _\gamma $ )

/keVSpin ( $ \hslash $ )

$ (I^{\pi}_{i} \rightarrow I^{\pi}_{f}) $ 

lifetime ( $ \tau $ )

/psConv. Coeff.
($ \alpha_t $ )

B(E2)
($ e^2b^2 $ )

${{Q}} _t $ 

/ebB(E2) ( $ e^2b^2 $ ) (PSM)

$ \varepsilon = 0.28 $ (

$ 0.21 $ )

${Q} _t $ /eb (PSM)

$ \varepsilon = 0.28 $ (

$ 0.21 $ )

$ \tau_{\rm SF} $ /ps Side feeding

231 17/2 $ ^{+}\rightarrow $ 13/2

$ ^{+} $ 

$ 24.7_{-1.2}^{+1.4} $ 

0.116 (17) $ 1.60_{-0.22}^{+0.25} $ 

$ 7.0_{-0.5}^{+0.6} $ 

1.70 (1.72) 7.1 (4.0) 1.5 322 21/2 $ ^{+}\rightarrow $ 17/2

$ ^{+} $ 

$ 3.8_{-0.2}^{+0.2} $ 

0.048 (7) $ 1.95_{-0.29}^{+0.36} $ 

$ 7.6_{-0.6}^{+0.7} $ 

1.79 (1.62) 7.3 (3.0) 0.9 400 25/2 $ ^{+}\rightarrow $ 21/2

$ ^{+} $ 

$ 2.4_{-0.6}^{+0.7} $ 

0.028 (4) $ 2.47_{-0.88}^{+0.80} $ 

$ 8.5_{-1.4}^{+0.5} $ 

2.24 (1.94) 7.9 (9.0) 1.1 450 29/2 $ ^{+}\rightarrow $ 25/2

$ ^{+} $ 

< 1.1 0.021 > 3.93 > 10.6 2.87 (1.64) 8.5 (3.0) − Table 2. The experimental and calculated B(E2)(PSM) results for different γ-ray transitions of interest of the
$ \pi i_{13/2} $ (Band 3) of$ ^{177}{\rm Re} $ nucleus.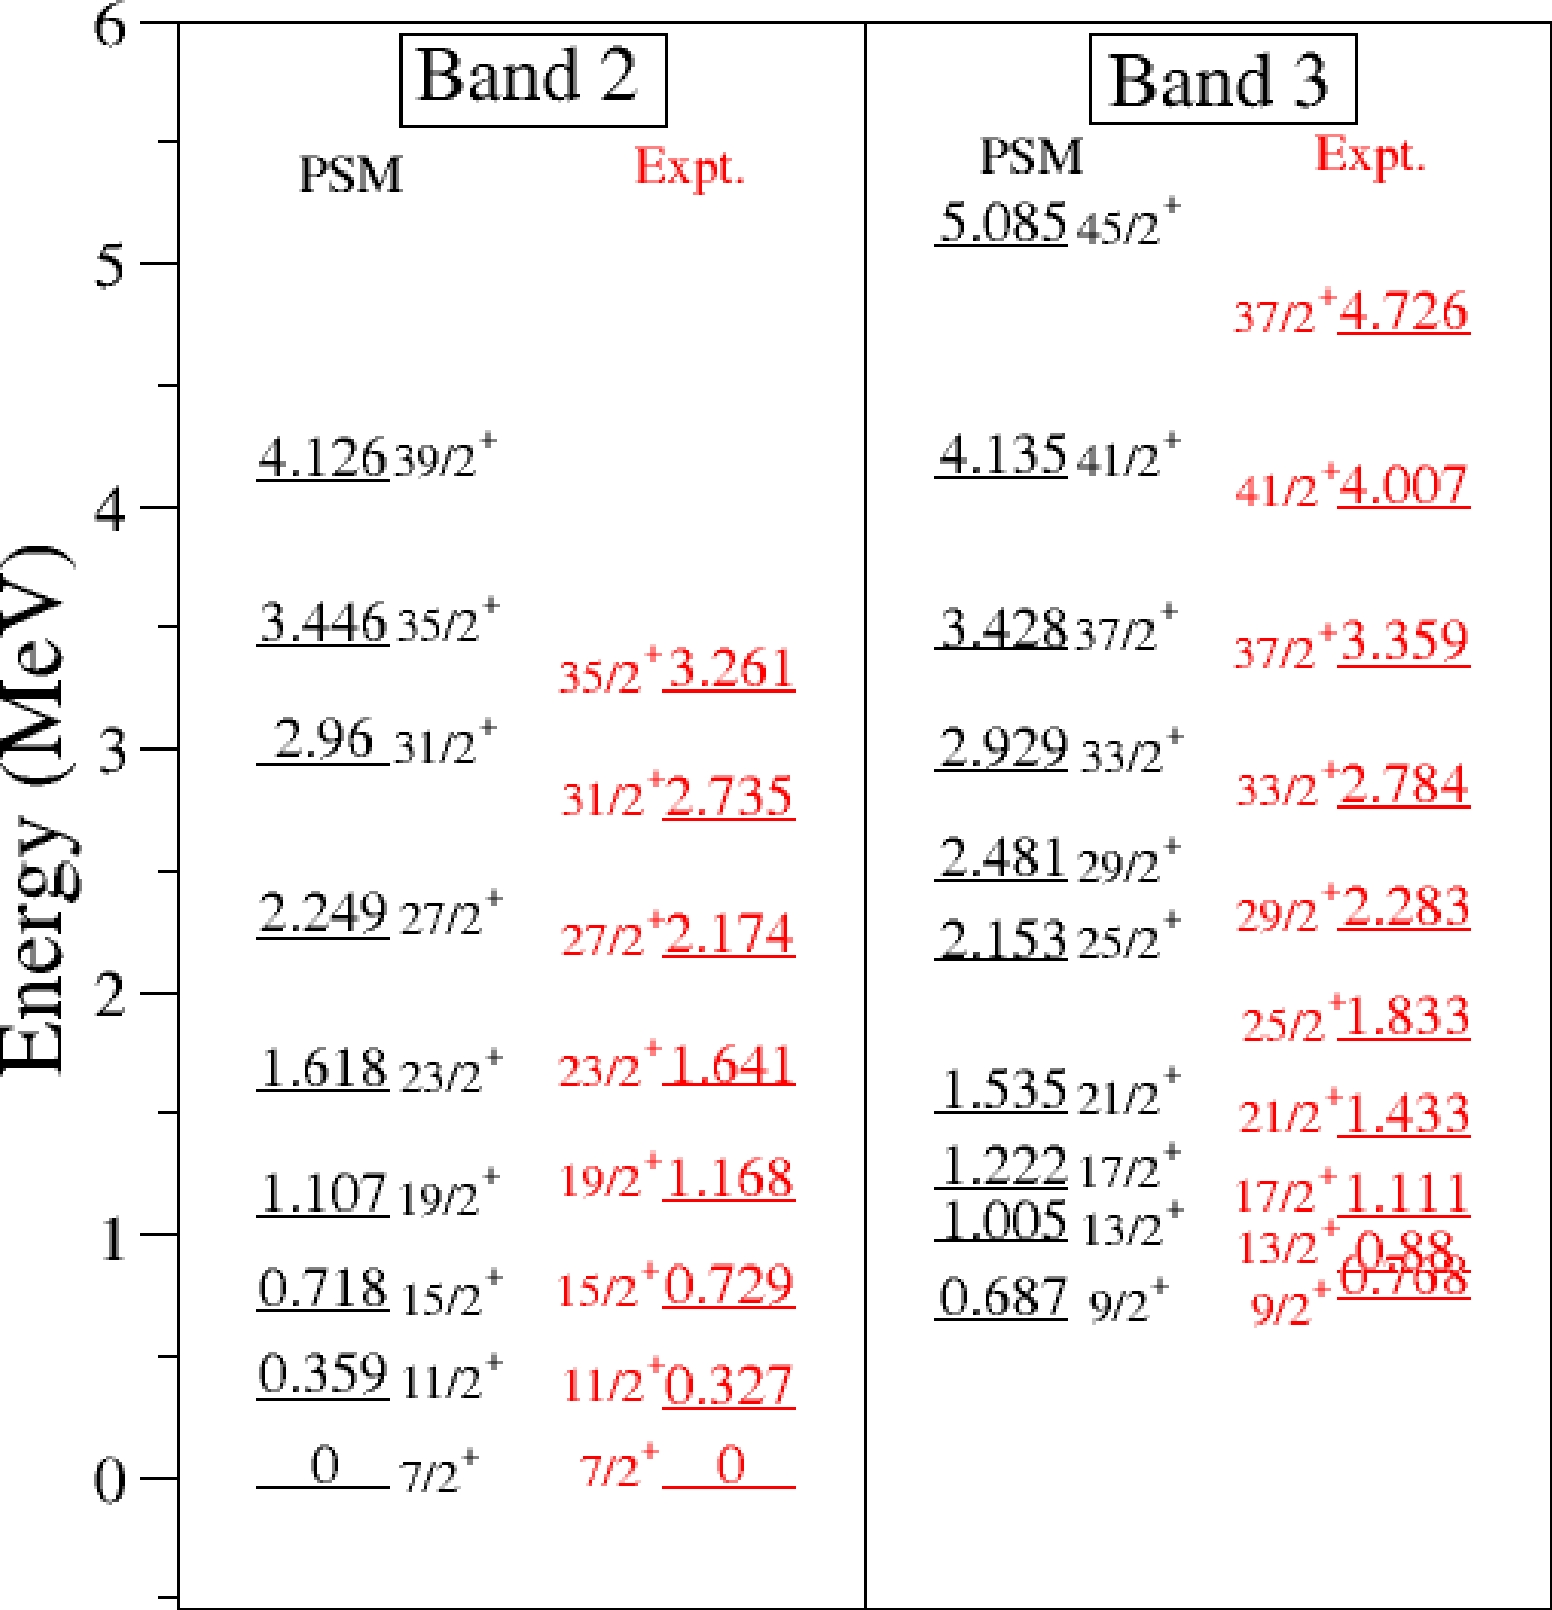
Figure 11. (color online) Comparison between the experimental and PSM results for the band structures of
$ ^{177} {\rm{Re}}$ . -
To extract the level lifetime information, the normalized intensity decay curves of unshifted γ-ray transitions for all eight gamma energies of interest are analyzed using the computer program LIFETIME [22] (the details of LIFETIME program have been provided in Ref. [7]). Comprehensive details of the lifetime analysis, including the extraction of B(E2) values and
$ Q_t $ values using the LIFETIME program, are described in [7]. The LIFETIME program uses sets of coupled differential equations, known as Batemanʼs equations [23], to determine the level population and intensities of both the shifted and unshifted γ-ray energy for each transition of interest. At each level of the modelled band, the LIFETIME program considers two types of feeding: cascade feeding from above and side feeding. However, for the highest level, only feeding from above is considered, attributed to an unknown rotational band. The quadrupole moment for this feeding band is varied to achieve the best fit with the observed highest energy level. Further details on the lifetime analysis through the LIFETIME program and the steps involved are reported in [7]. For each γ-ray transition of interest, the error in intensity is calculated as the sum of the fitting error and the statistical error only. The errors in the lifetimes have been calculated through the least-square minimization package, MINUIT [24] included in the LIFETIME program. This routine calculates true parameter errors by executing the behavior of the$ \chi^2 $ function over the unit interval on both side of the minimum$ \chi^2 $ . -
The intensity decay curves as a function of distance for various γ-ray energies of interest of
$ \pi d_{5/2} $ (α = –1/2) (Band 2) and$ \pi i_{13/2} $ (α = +1/2)(Band 3) are analyzed using the LIFETIME code [22], and mean lifetime values for various excited states are obtained. The resulting intensity decay curves of unshifted energies for the γ-transitions of interest in Band 2 and Band 3 are shown in Figs. 12 and 13, respectively. From the extracted mean lifetimes, the reduced electric quadrupole transition probability B(E2) values are obtained using Eq. (2). From the B(E2) values the transitional quadrupole moment$ Q_t $ have been deduced using the following relation: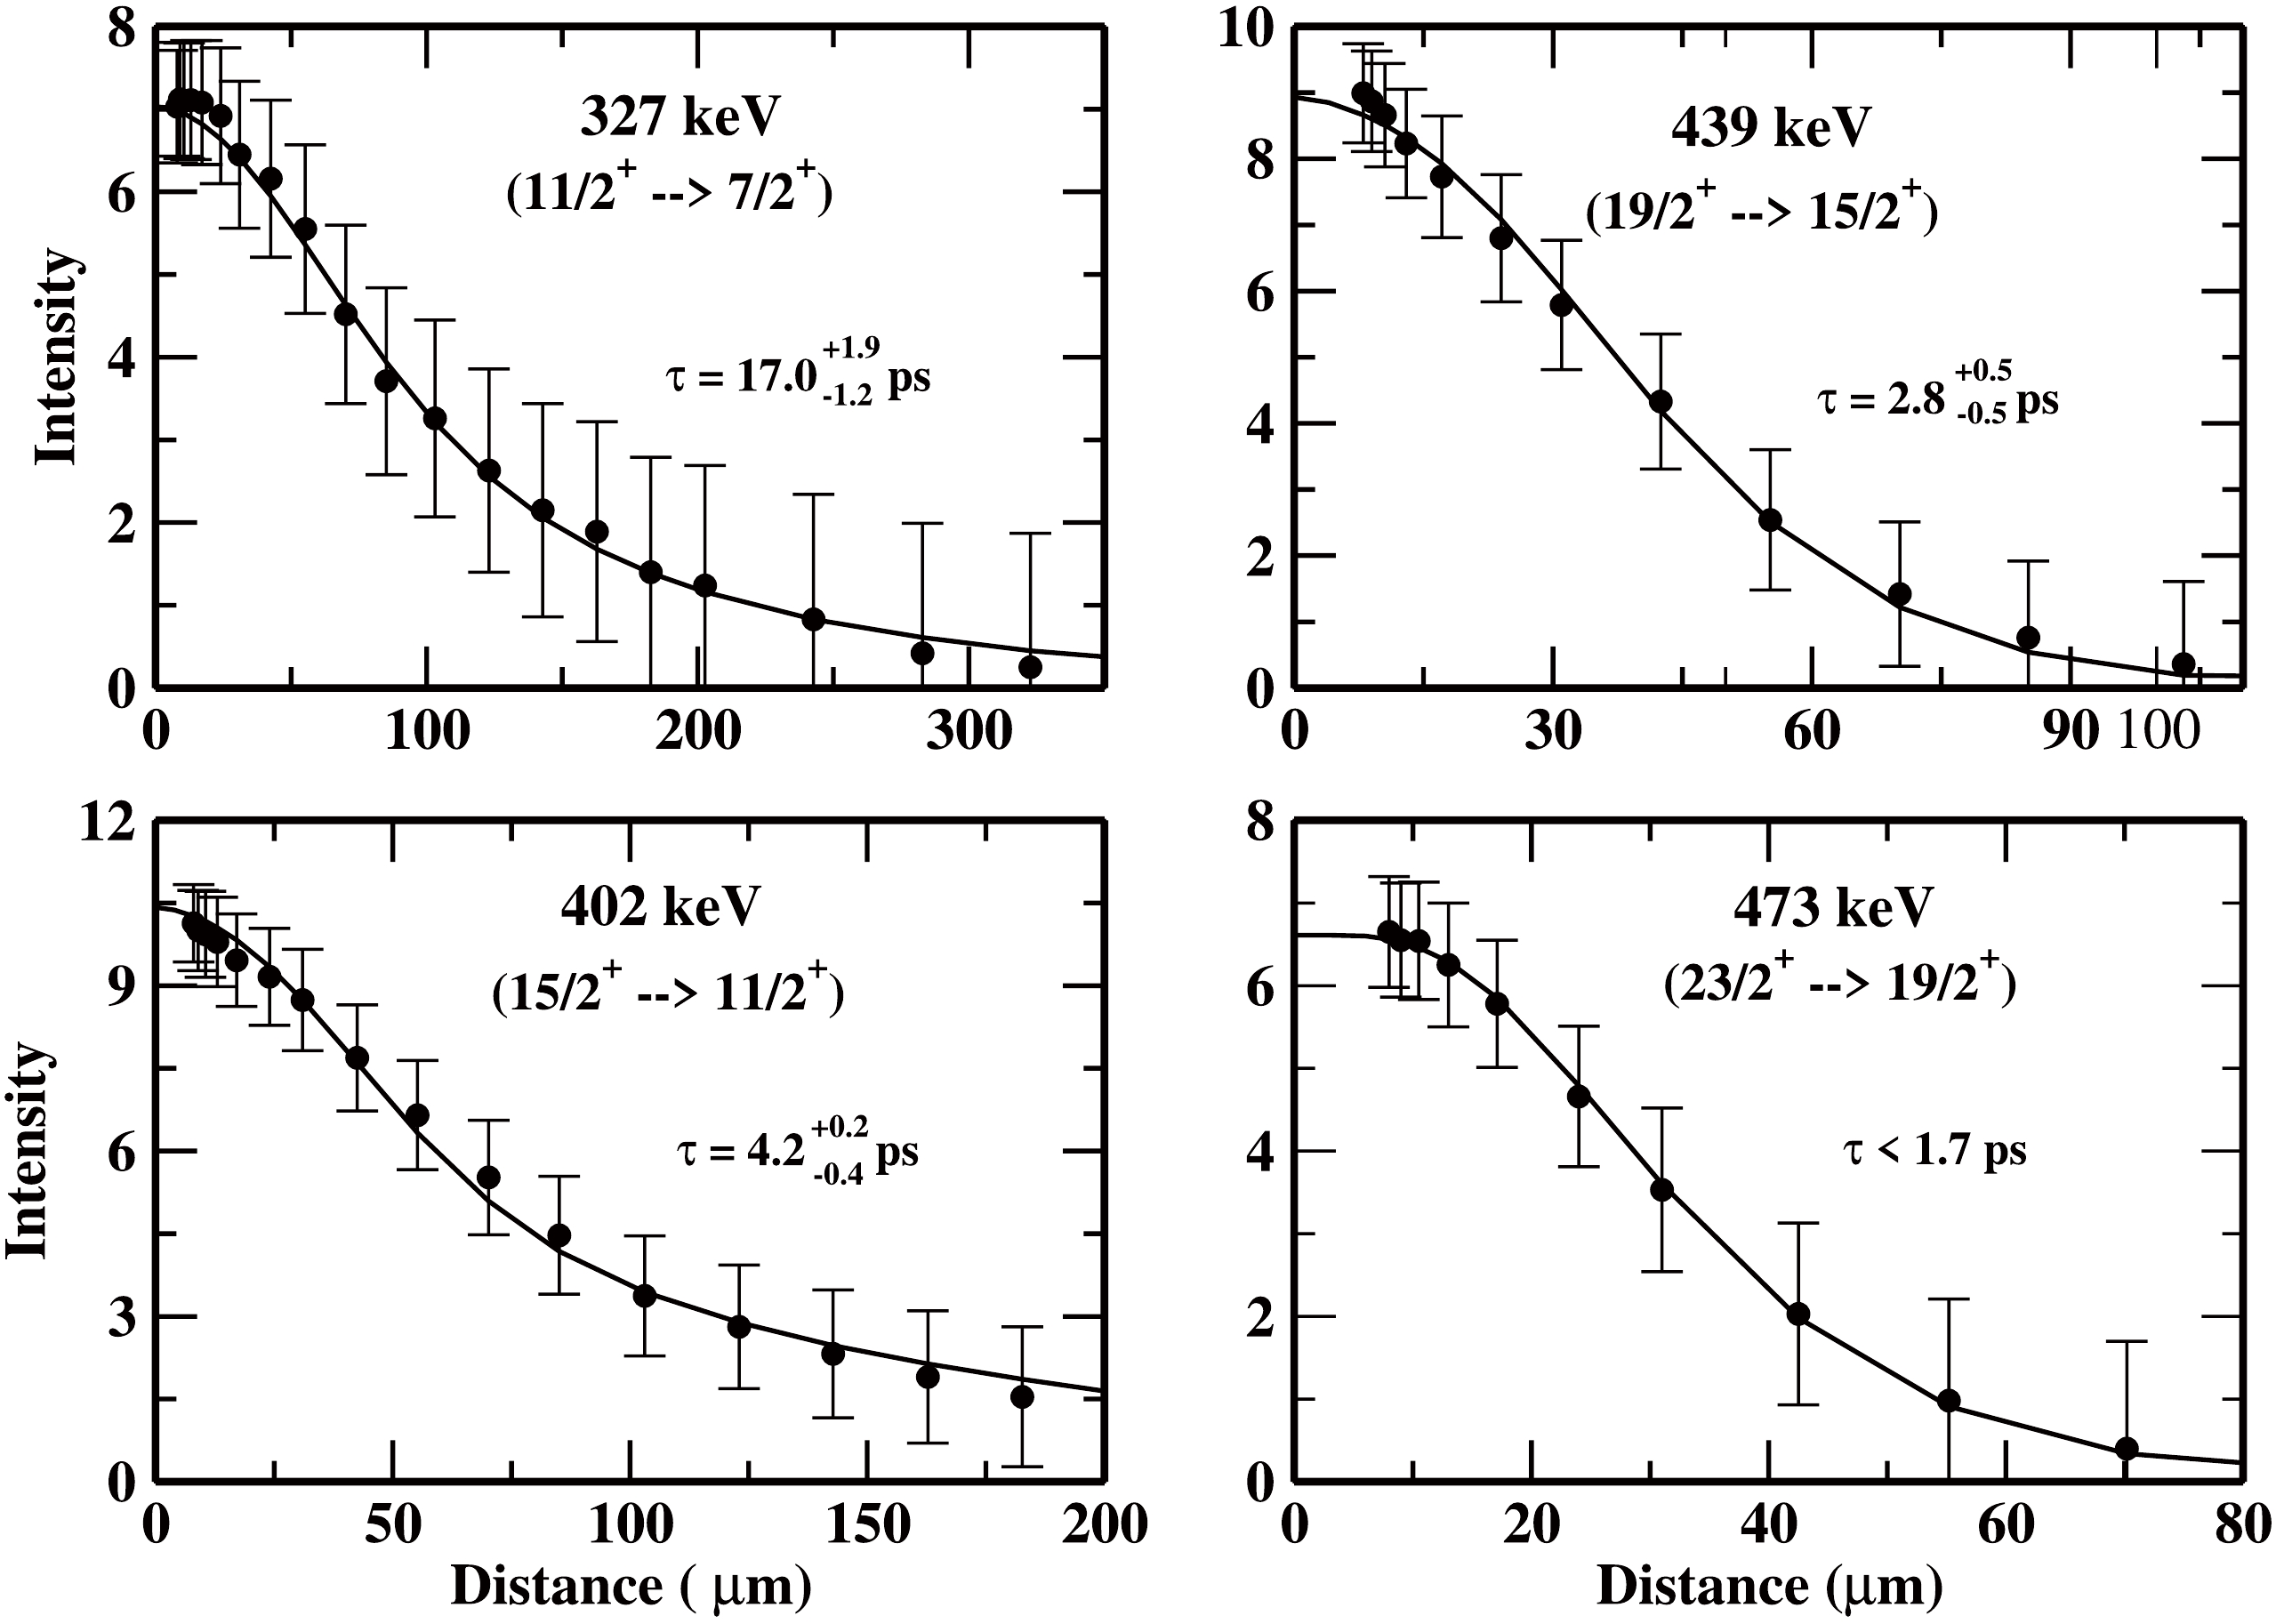
Figure 12. Unshifted intensity decay curve for the γ-ray transitions of the Band 2 (
$ \pi d_{5/2} $ , α = –1/2) in$ ^{177} {\rm{Re}}$ nucleus obtained by fitting through the LIFETIME code. (* Intensities are normalized to the intensity of 547 keV γ-ray from Coulomb excitation of Au.)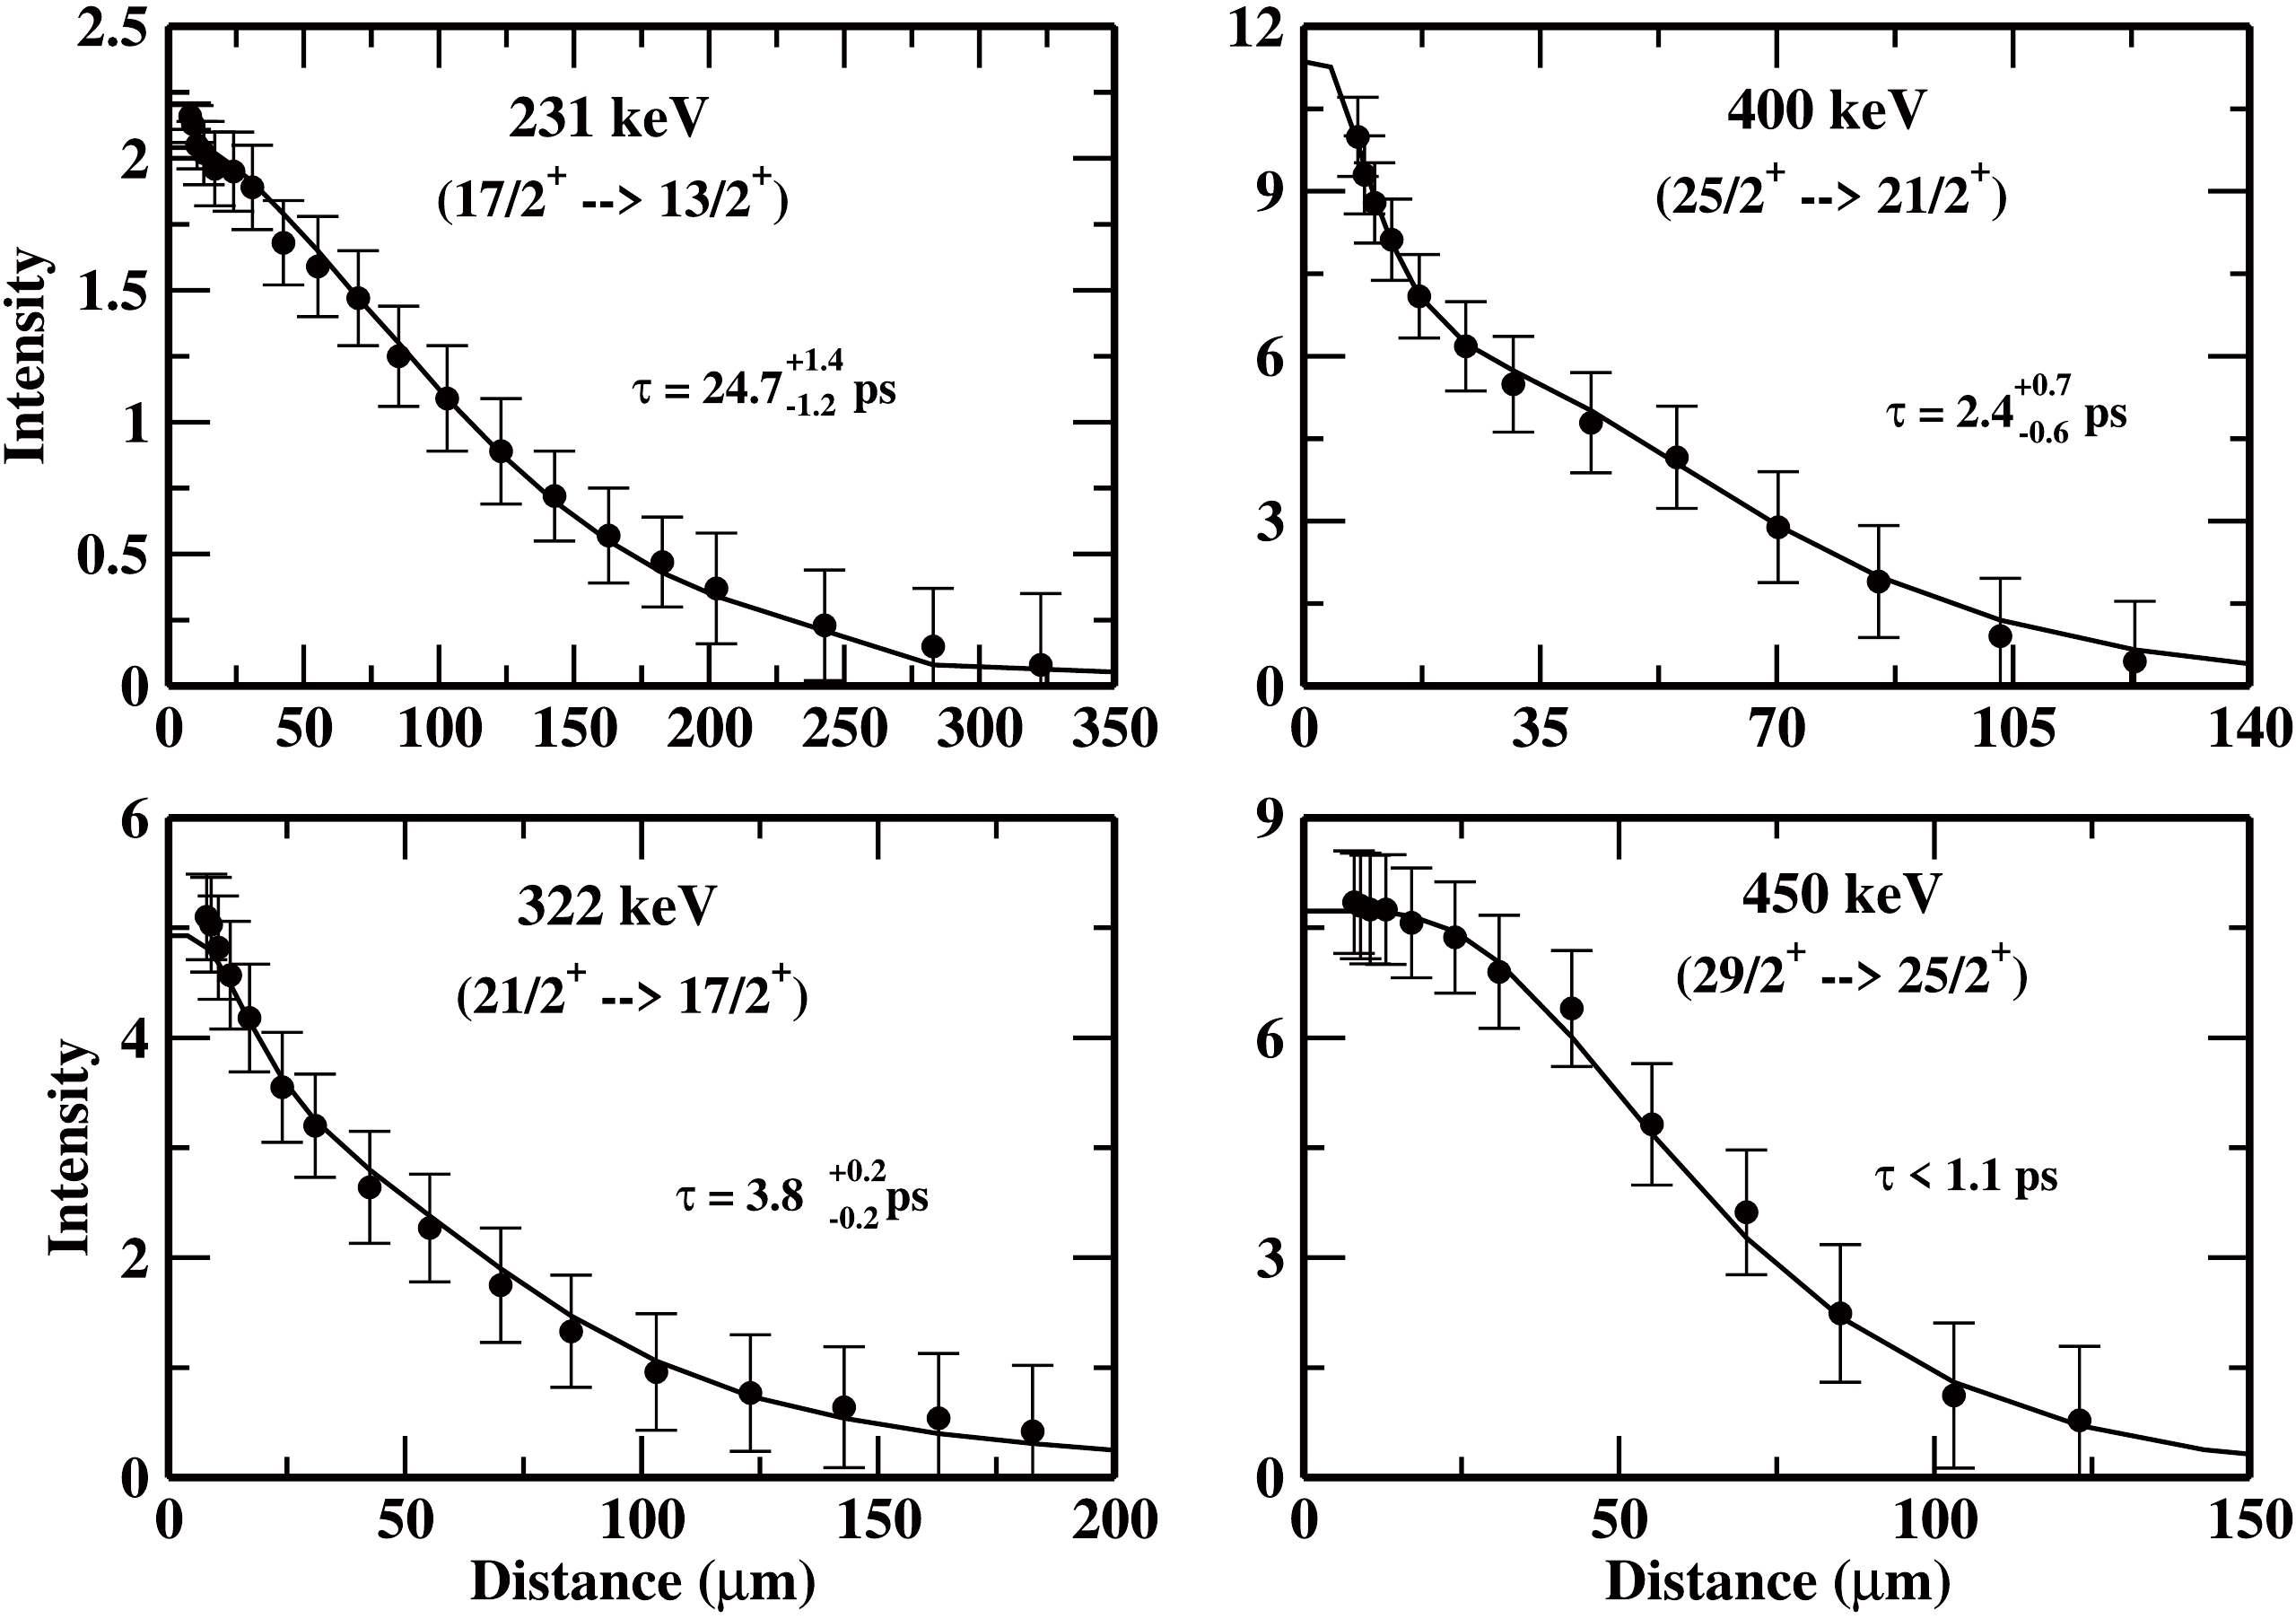
Figure 13. Unshifted intensity decay curve for the γ-ray transitions of the Band 3 (
$ \pi i_{13/2} $ ) in$ ^{177} {\rm{Re}}$ nucleus obtained by fitting through the LIFETIME code. (*Intensities are normalized to the intensity of 547 keV γ-ray from Coulomb excitation of Au)$ Q_t^2 = (\frac{16\pi}{5})\frac{B(E2; I \rightarrow I-2 )}{<I2K0|I-2K>^2} \quad\rm eb, $

(16) where,
$ \langle I2K0|I-2 K\rangle $ are the Clebsch-Gordon (C.G) coefficient, given by:$ C.G=\sqrt{\frac{3(I-K)(I-K-1)(I+K)(I+K-1)}{(2I-2)(2I-1)I(2I+1)}}. $

(17) In this study, K = 5/2 and 1/2 are used for Bands 2 and 3, respectively. The results obtained are summarised in Table 1 for the
$ \pi d_{5/2} $ (Band 2) and Table 2 for the$ \pi i_{13/2} $ (Band 3). The experimental results are also compared with those obtained from PSM model calculations in Tables 1 and 2. Examining the results for$ \pi d_{5/2} $ (Band 2) in Table 1, it is clear that the experimental B(E2) values are steadily increasing from$ {11}/{2}^+ \hslash $ to$ {15}/{2}^+ \hslash $ state, which suggest changes in the structure of$ ^{177} {\rm{Re}}$ nucleus in this high -K configuration. Beyond$ {15}/{2}^+ \hslash $ state, the B(E2) values appear to remain approximately constant within experimental error, indicating structural stability in the yrast configuration in the$ ^{177} {\rm{Re}}$ nucleus. The results of the PSM calculations support the changing nucleus strcuture in this configuration, as the calculated B(E2) values are also found to increase with spin, showing overall agreement with the experimental B(E2) values within the error bars. However, for the$ \pi i_{13/2} $ (α = +1/2) band, the behavior of B(E2) values with increasing spin differs from that observed in the$ \pi d_{5/2} $ band. For this low-K high-j band, as shown in Table 2,the experimental B(E2) values remain constant within the error bars up to$ {21}/{2}^+ \hslash $ spin, and then increase sharply at higher spins. The increase in B(E2) value from$ {21}/{2}^+ \hslash $ to$ {25}/{2}^+ \hslash $ is found to be apporximately 27%, with values ranging from$ {25}/{2}^+ \hslash $ to$ {29}/{2}^+ \hslash $ showing an increase of up to approximately 59%. The significant increase in B(E2) values suggests substantial shape stretching in this intruder configuration at high spins. However, the results of the PSM calculations do not support this interpretation. As shown in Table 2, the PSM calculated B(E2) values differ significantly from the experimental B(E2) values and tend to suggest an almost stable structure of$ ^{177} {\rm{Re}}$ nucleus in this low-K configuration. Figure 14 shows the variation of the observed transitional quadrupole moment (${ {Q}} _t $ ) as a function of rotational frequency for various observed bands in$ ^{177} {\rm{Re}}$ . From the figure, the following conclusion can be drawn: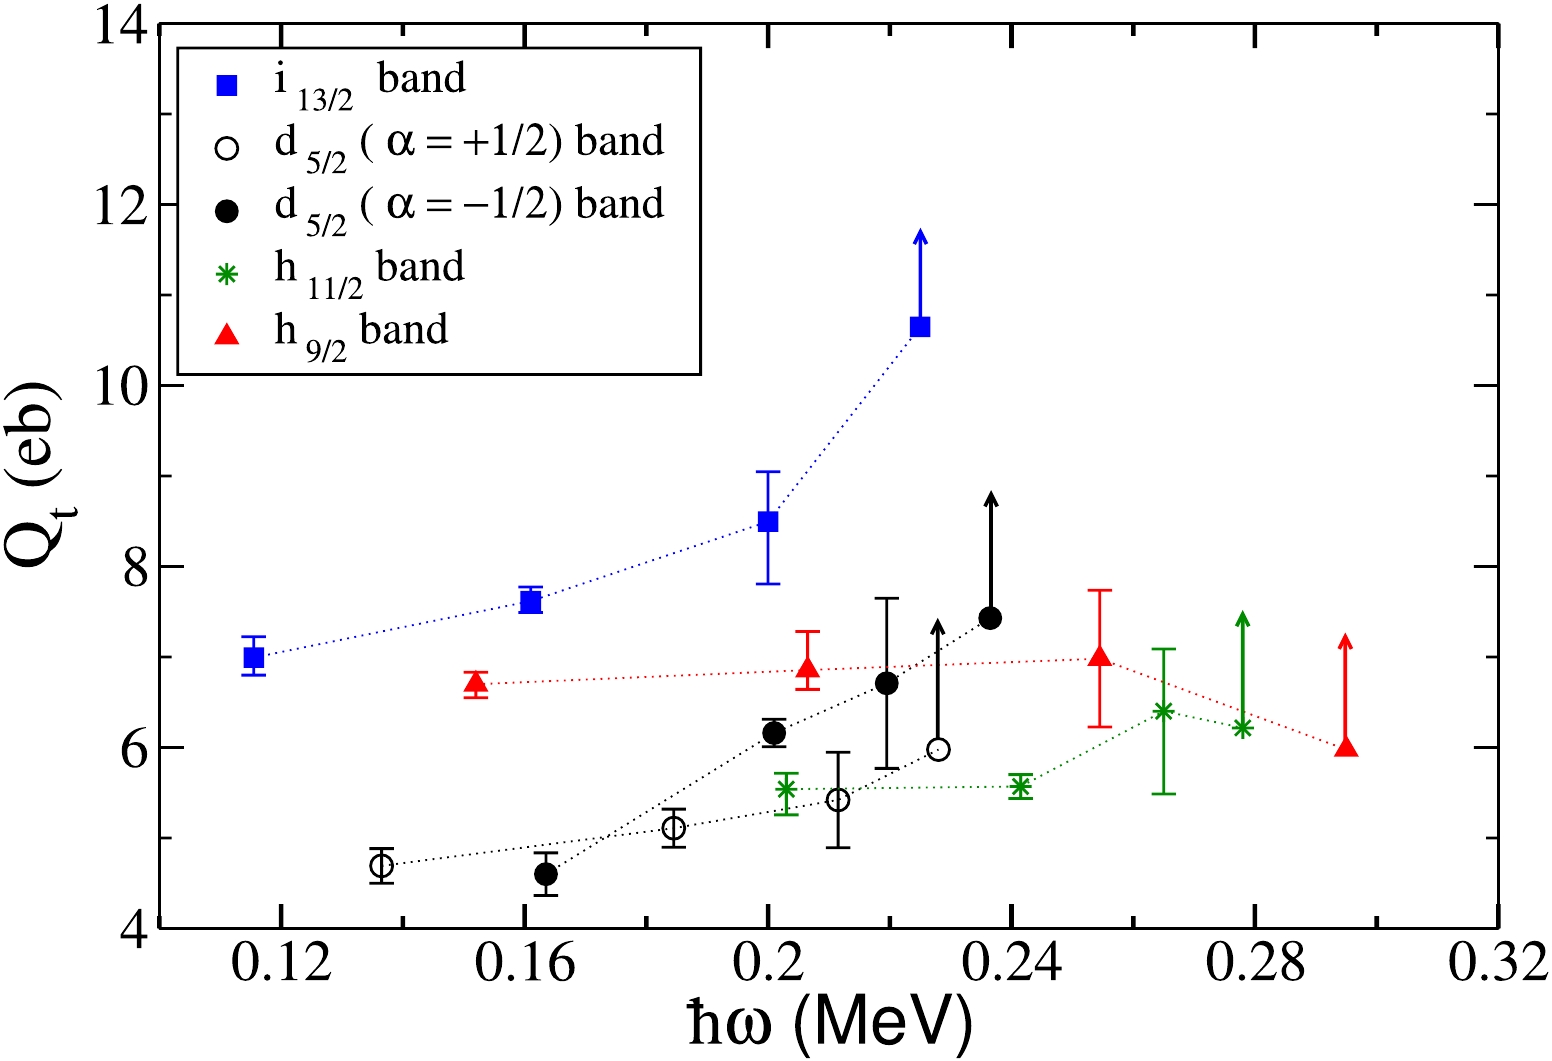
Figure 14. (color online) Comparison of
$ Q_t $ values for various observed quasi-proton bands in$ ^{177}{\rm Re} $ nucleus. Data for the$ d_{5/2} (\alpha = +1/2) $ band, as well as for the$ h_{11/2} $ and$ h_{9/2} $ bands, were obtained from reference [3].● The average
${ {Q}} _t $ value for the$ \pi i_{13/2} $ band is the highest (${ {Q}} _t $ ) among all the other observed bands, clearly demonstrating the strong deformation-driving capability of this low-K intruder configuration.● The higher average
${{Q}} _t $ (approximately 8.7 (6)) value for low-K$ \pi i_{13/2} $ intruder band compared with${{Q}} _t $ (approximately 6.5 (4)) value for low-K$ \pi h_{9/2} $ intruder band, the average${{Q}} _t $ values for other high-K bands in$ ^{177} {\rm{Re}}$ nucleus,${{d}} _{5/2} $ (α = +1/2, K = 5/2,${{Q}} _t $ ~ 5.3 (4)),${{d}} _{5/2} $ (α = –1/2, K = 5/2,${{Q}} _t $ ~ 6.3 (5)) and${{h}} _{11/2} $ (α = +1/2, K = 9/2,${{Q}} _t $ ~ 5.7 (5)) is indicative of the deformation-driving character of this orbital.● The almost constant nature of
${{Q}} _t $ values as a function of rotational frequency for the$ \pi h_{9/2} $ ,$ \pi d_{5/2} $ and$ \pi h_{11/2} $ bands within the error bars indicate the stable structure of the$ ^{177} {\rm{Re}}$ nucleus in these configurations. However, the sharply increasing trend of${{Q}} _t $ values at high spins in$ \pi i_{13/2} $ indicates the shape stretching of the nucleus in this intruder configuration.● Comparing the nature of
${{Q}} _t $ values for the two intruder configurations$ \pi h_{9/2} $ [541]$ {1}/{2}^- $ and$ \pi i_{13/2} $ [660]${1}/{2}^+ $ , it is clear that although both contribute to deformation, the deformation-driving capability of$ \pi i_{13/2} $ orbital is more than that for the$ \pi h_{9/2} $ orbital. As both orbitals are well above the Fermi surface ($ \pi i_{13/2} $ orbital above the$ \pi h_{9/2} $ orbital), the higher average${{Q}} _t $ value for the$ \pi i_{13/2} $ band compared with the$ \pi h_{9/2} $ band is indicative of more particle nature of the$ \pi i_{13/2} $ band than the$ \pi h_{9/2} $ band in this nucleus.To clearly assess the effect of proton and neutron Fermi surfaces on the deformation driving capabilities of the two intruder high-j orbitals (
$ \pi i_{13/2} $ orbital and$ \pi h_{9/2} $ orbital), the average${{Q}} _t $ values for the$ \pi h_{9/2} $ and$ \pi i_{13/2} $ bands in$ ^{177}{\rm Re} $ (present case),$ ^{179} {\rm{Ir}}$ [25] and$ ^{181} {\rm{Ir}}$ [26] have been tabulated in Table 3.Table 3. The comparison of transitional quadrupole moment (
${{Q}} _t $ ) observed for$ \pi h_{9/2} $ [541]${1}/{2}^- $ band and$ \pi i_{13/2} $ [660]$ {1}/{2}^+ $ band in$ ^{177} {\rm{Re}}$ ,$ ^{179} {\rm{Ir}}$ and$ ^{181} {\rm{Ir}}$ nuclei.Examining the values in Table 3, it can inferred that the increase of proton Fermi surface from Re (Z = 75) to Ir (Z = 77) has almost no effect on the relative deformation-driving capabilities of the two orbitals. However, comparing the average
${ {Q}} _t $ values for the two orbitals in$ ^{179} {\rm{Ir}}$ and$ ^{181} {\rm{Ir}}$ (Z = 77), it can be concluded that an increase in neutron Fermi surface from N = 102 to 104 has almost no effect on the deformation-driving capability of$ \pi h_{9/2} $ orbital but has a significant influence on the deformation-driving capability of the$ \pi i_{13/2} $ orbital. This observation is expected, because in the case of Ir, the$ \pi h_{9/2} $ orbital lies close to the Fermi surface and therefore acts as a quasi-particle orbital, whereas the$ \pi i_{13/2} $ orbital remains well above the Fermi surface${ {E}} _{\rm exc} \sim 1$ MeV, allowing it to retain its deformation-driving capability. -
The lifetime measurements in
$ ^{177}{\rm Re} $ indicate that the B(E2) values for the high-K$ \pi d_{5/2} $ ($ \alpha = -1/2) $ (Band 2) gradually increase with increasing spins at low spin values. This indicates a changing structure or a possible shape stretching (β-stretching) of the nucleus in this high -K configuration. For the$ \pi i_{13/2} $ (K = 1/2) band, on the other hand, the B(E2) values are significantly higher than those of the B(E2) values of$ \pi d_{5/2} $ band, but show constant nature with increase in spin values. This indicates the larger collectivity and stable nuclear shape for$ ^{177}{\rm Re} $ nucleus in this low-K configuration. Although the results of B(E2) values calculated using PSM model calculations are inconsistent with the experimental values for both the bands, their behavior as a function of spin support the different deformed structures of$ ^{177}{\rm Re} $ nucleus in the two configurations. Additionally, comparing$ Q_t $ values for the$ \pi h_{9/2} $ (K = 1/2) [3] and the$ Q_t $ values obtained for the$ \pi i_{13/2} $ band in the present measurement, the$ \pi i_{13/2} $ band is found to be more collective and hence has more deformation driving tendency compared with the$ \pi h_{9/2} $ band. -
The authors are grateful for the support provided by the pelletron and support staff of the IUAC, New Delhi.
Lifetime measurement of high spin states in non-yrast bands in 177Re
- Received Date: 2024-08-17
- Available Online: 2025-08-15
Abstract: The deformation driving tendency of various single particle orbitals near the Fermi surface has been investigated with the lifetime measurements of high spin states in the non-yrast bands of


 DownLoad: