


 Abstract
 HTML
HTML Reference
 Related
 PDF
PDF


-
In 1899, Rutherford discovered the phenomenon of natural α-radioactivity, marking the beginning of significant developments in nuclear decay studies. The process of α decay, explained by quantum tunneling, was first formulated by Gurney and Condon [1] and Gamow [2] in 1928. Within Wenzel-Kramers-Brillouin (WKB) approximation, α-decay is treated as two key stages: (1) the preformation of an α cluster, bound within the parent nucleus with a certain probability known as the α preformation factor
$ P_{\alpha} $ , and (2) the escape of the α cluster through quantum tunneling, resulting in an independent α particle with a penetration probability$ P_0 $ . α decay is the primary decay mode for many unstable nuclei, and its study provides valuable insights into nuclear structure, including ground-state properties, level structures, and shell closure effects [3–8]. Additionally, α decay plays a vital role in the discovery of new elements and the synthesis of superheavy nuclei [9–11]. Thus, research on α decay is significant in the field of nuclear physics, contributing to both theoretical understanding and experimental advancements.Various nuclear models have been proposed to study α-decay half-lives, including the generalized liquid drop model (GLDM) [12–15], Coulomb and proximity potential model (CPPM) [16], two-potential approach (TPA) [17–19], unified fission model (UFM) [9], and density-dependent cluster model (DDCM) [20–22]. Additionally, numerous empirical formulas have been developed for calculating α-decay half-lives, including the Geiger-Nuttall law [23], the Viola-Seaborg formula [24, 25], Brown’s formula [26], Royer's formula [12], and the universal decay law (UDL) [27]. To improve the accuracy in describing experimental α-decay half-lives, researchers have proposed several modifications to these formulas [28–33].
Recent studies [34–38] have demonstrated that nuclear deformation plays an essential role in α-decay. Recently, Li et al. [38] systematically study the α-decay half-lives of even-even nuclei using a deformed TPA by considering nuclear deformation in the cosh potential. The corresponding root mean square deviation (RMSD) reduces from 0.573 to 0.506, which shows that some improvement can be achieved by considering nuclear deformations. In Ref. [39], the authors emphasized that a nontrivial behavior of the nuclear diffuseness as the system becomes increasingly deformed. For the spherical nucleus, a diffuseness parameter
$ a_0 $ = 0.59 fm is used, whereas for the deformed$ ^{238}{\rm{U}} $ , the three values are$ a_0 $ = 0.494, 0.5504, and 0.5832 fm. These values correspond to the minimal, average, and maximal values of the radial diffuseness, respectively. In addition, in Ref. [40], the authors showed that for different mass numbers, the value of average diffuseness$ a_0 $ is different, approximately ranging form 0.27 to 0.65. Within the DDCM+ framework, Ren et al. investigated the impacts of diffuseness polarization and anisotropy on α-decay half-lives. They showed that, by introducing an adjustable parameter of deformation-dependent diffuseness in the nuclear density distribution, the model's capability of reproducing the half-lives of α-decay can be improved [21].In this study, the α-decay half-lives of 195 even-even nuclei are systematically investigated using a deformed TPA. The nuclear potential is modeled using a cosh potential with a fixed diffuseness parameter, and nuclear deformations are taken from the FRDM, WS4, and DRHBc models, respectively. Building on this, a novel approach is introduced: the diffuseness parameter
$ a_0 $ is refitted to experimental α-decay half-lives across distinct mass regions. To further validate the fitted diffuseness parameter, we apply the deformed TPA model with nuclear deformations from ws4 and DRHBc models. The RMSDs between calculated and experimental α-decay half-lives are then evaluated. These results are compared with those obtained using the fixed diffuseness parameter$ a_0 $ = 0.5958.The remainder of this paper is organized as follows. In Sec. II, the detailed framework of the calculation of α-decay half-lives with a deformed TPA is presented. The corresponding calculated results are given and discussed in Sec. III. A brief summary is given in Sec. IV.
-
In the framework of the two-potential approach, the α-decay half-lives can be obtained using the decay width Γ [40–42]. It can be expressed as follows:
$ T_{1/2} = \frac{\hbar \ln 2}{\Gamma}, $

(1) where the decay width Γ is defined as
$ \Gamma = \frac{\hbar^2 P_\alpha FP_0}{4\mu}, $

(2) where
$ P_{\alpha} $ and$ P_0 $ are the preformation and penetration factors, respectively.$ \mu = \dfrac{m_d m_\alpha}{m_d + m_\alpha} $ represents the reduced mass between the α particle and daughter nucleus, where$ m_d $ and$ m_\alpha $ denote the masses of the daughter nucleus and α particle, respectively. F is the normalization factor, which characterizes the assault frequency of the α particle.The α-preformation factor, denoted as
$ P_\alpha $ , represents the probability of an α-cluster existing within the parent nucleus under the cluster model. A precise determination of$ P_\alpha $ is crucial for enhancing the accuracy of theoretical α-decay half-lives. In this study, we employ a formalism extended from the cluster-formation model (CFM), using the formation energy derived from separation energy to estimate$ P_\alpha $ , based on the formula provided in references [43, 44].$ P_{\alpha}=\frac{E_{{\rm{f}}\alpha}}{E_{\alpha}}. $

(3) For even-even nuclei, the formation energy
$ E_{{\rm{f}}\alpha} $ and α-cluster separation energy are given by$ E_{f\alpha} = 2S_p + 2S_n - S_{\alpha}, $

(4) $ E_{\alpha} = S_{\alpha}(A,Z) = B(A,Z) - B(A-4,Z-2). $

(5) Here,
$ B(A, Z) $ denotes the binding energy of a nucleus with mass number A and proton number Z.For the normalization factor, denoted as F, it can be approximated by the following expression:
$ F = \frac{1}{\int_{r_1}^{r_2} \frac{1}{2k(r)} \, \mathrm{d}r}. $

(6) The penetration probability
$ P_0 $ is calculated using the Wentzel-Karmers-Brillouin (WKB) approximation:$ P_{0} = exp\left[ -\dfrac{2}{\hbar}\int_{r_{2}}^{r_{3}}\sqrt{2\mu(r)(V(r)-Q_{\alpha})}{\rm d}r\right], $

(7) where
$ r_{1} $ ,$ r_{2} $ , and$ r_{3} $ are the classical turning points of the WKB action integral with$ V(r_{1})=V(r_{2})=V(r_{3})=Q_{\alpha} $ , and$ Q_{\alpha} $ is the α-decay energy. When considering the influence of deformation, F and$ P_0 $ can be expressed as$ F = \frac{1}{2}\int_0^{\pi}\frac{1}{\int_{r_1}^{r_2} \dfrac{1}{2k(r(\theta)} \, \mathrm{d}r}\sin\theta \, {\rm d}\theta, $

(8) $P_0 = \frac{1}{2} \int_0^{\pi} {\rm{exp}}\left[ -2 \int_{r_{2}}^{r_{3}} k(r(\theta)) \, {\rm d}r \right] \sin\theta \, {\rm d}\theta,$

(9) where
$ k(r(\theta)) = \sqrt{\left(\dfrac{2\mu}{\hbar^2} \right) |Q_\alpha - V(r(\theta))|} $ . θ is the angle between the emission direction of the α particle and the axis of rotational symmetry of the deformed nucleus.The effective potential
$ V(r) $ between the α cluster and the daughter nucleus is expressed as$ V(r) = V_N(r)+ V_C(r)+ V_l(r), $

(10) with
$ V_N(r) $ being the nuclear potential,$ V_C(r) $ being the Coulomb potential, and$ V_l(r) $ being the centrifugal potential.For the nuclear potential
$ V_N(r) $ , we employ the cosh-parametrized form [45]:$ V_N(r)=\frac{-V_{0}(1+\cosh(R_d^{'}/a_0)}{(\cosh(r/a_0)+\cosh(R_d^{'}/a_0))}, $

(11) where the parameters
$ V_0 $ and$ a_0 $ denote the depth and diffuseness of the potential [46], respectively. The parameter$ V_0 $ is given as$ V_0=192.42+31.059\dfrac{N_d-Z_d}{A_d} $ [47]. Considering the effects of the deformation,$ R_d^{'} $ of the daughter nucleus is given by [48]$ R_d^{'}(\theta) = R_d \left( 1 + \beta_2 Y_{20}(\theta) + \beta_4 Y_{40}(\theta) + \beta_6 Y_{60}(\theta) \right), $

(12) where
$ \beta_2 $ ,$ \beta_4 $ , and$ \beta_6 $ are quadrupole, hexadecapole, and hexacontatetrapole deformations of daughter nuclei, respectively [49].$ Y_{lm} $ is spherical harmonics function.$ R_d $ is the sharp radius of daughter nucleus, which is expressed by an empirical formula.$ R_{d} = \left( 1.28A_{d}^{1/3}-0.76+0.8A_{d}^{-1/3}\right){\rm fm}. $

(13) Considering the effect of the deformations, the Coulomb potential
$ V_{C}(r) $ between the α cluster and the daughter nucleus is expressed as [50]$ V_C(\vec{r}, \theta) = \int \int \frac{\rho_{\rm d}(\vec{r}_1) \rho_\alpha(\vec{r}_2)}{|\vec{r} + \vec{r}_2 - \vec{r}_1|} \, {\rm d}\vec{r}_2 \, {\rm d}\vec{r}_1, $

(14) where
$ \vec{r} $ is the vector between the centres of the α particle and daughter nucleus,$ \vec{r}_1 $ and$ \vec{r}_2 $ are the radius vectors in the charge distributions of the α particle and daughter nucleus. θ represents the angle between the emission direction of the α particle and the axis of rotational symmetry of deformed nucleus, which are implicit in$ \rho_\alpha $ and$ \rho_d $ . Properly simplified using Fourier transform, the Coulomb potential can be approximated as$ V_C(\vec{r}, \theta) = V_C^{(0)}(r) + V_C^{(1)}(\vec{r}, \theta) + V_C^{(2)}(\vec{r}, \theta), $

(15) where
$ V_C^{(0)}(r) $ ,$ V_C^{(1)}(\vec{r}, \theta) $ , and$ V_C^{(2)}(\vec{r}, \theta) $ are the bare Coulomb interaction, linear Coulomb coupling, and second-order Coulomb coupling, respectively [51].The centrifugal potential is given by [52]
$ V_l(r) =\dfrac{\hbar^2}{2\mu r^2}l(l+1), $

(16) where l is the angular momentum taken away by the α cluster. For even-even nuclei, l is always 0. Hence, the influence of the angular momentum on α-decay half-lives is not considered in this work.
-
In the framework of the two-potential approach, the α-decay half-lives can be obtained using the decay width Γ [40–42]. It can be expressed as follows:
$ T_{1/2} = \frac{\hbar \ln 2}{\Gamma}, $
(1) where the decay width Γ is defined as
$ \Gamma = \frac{\hbar^2 P_\alpha FP_0}{4\mu}, $
(2) where
$ P_{\alpha} $ and$ P_0 $ are the preformation and penetration factors, respectively.$ \mu = \dfrac{m_d m_\alpha}{m_d + m_\alpha} $ represents the reduced mass between the α particle and daughter nucleus, where$ m_d $ and$ m_\alpha $ denote the masses of the daughter nucleus and α particle, respectively. F is the normalization factor, which characterizes the assault frequency of the α particle.The α-preformation factor, denoted as
$ P_\alpha $ , represents the probability of an α-cluster existing within the parent nucleus under the cluster model. A precise determination of$ P_\alpha $ is crucial for enhancing the accuracy of theoretical α-decay half-lives. In this study, we employ a formalism extended from the cluster-formation model (CFM), using the formation energy derived from separation energy to estimate$ P_\alpha $ , based on the formula provided in references [43, 44].$ P_{\alpha}=\frac{E_{{\rm{f}}\alpha}}{E_{\alpha}}. $
(3) For even-even nuclei, the formation energy
$ E_{{\rm{f}}\alpha} $ and α-cluster separation energy are given by$ E_{f\alpha} = 2S_p + 2S_n - S_{\alpha}, $
(4) $ E_{\alpha} = S_{\alpha}(A,Z) = B(A,Z) - B(A-4,Z-2). $
(5) Here,
$ B(A, Z) $ denotes the binding energy of a nucleus with mass number A and proton number Z.For the normalization factor, denoted as F, it can be approximated by the following expression:
$ F = \frac{1}{\int_{r_1}^{r_2} \frac{1}{2k(r)} \, \mathrm{d}r}. $
(6) The penetration probability
$ P_0 $ is calculated using the Wentzel-Karmers-Brillouin (WKB) approximation:$ P_{0} = exp\left[ -\dfrac{2}{\hbar}\int_{r_{2}}^{r_{3}}\sqrt{2\mu(r)(V(r)-Q_{\alpha})}{\rm d}r\right], $
(7) where
$ r_{1} $ ,$ r_{2} $ , and$ r_{3} $ are the classical turning points of the WKB action integral with$ V(r_{1})=V(r_{2})=V(r_{3})=Q_{\alpha} $ , and$ Q_{\alpha} $ is the α-decay energy. When considering the influence of deformation, F and$ P_0 $ can be expressed as$ F = \frac{1}{2}\int_0^{\pi}\frac{1}{\int_{r_1}^{r_2} \dfrac{1}{2k(r(\theta)} \, \mathrm{d}r}\sin\theta \, {\rm d}\theta, $
(8) $P_0 = \frac{1}{2} \int_0^{\pi} {\rm{exp}}\left[ -2 \int_{r_{2}}^{r_{3}} k(r(\theta)) \, {\rm d}r \right] \sin\theta \, {\rm d}\theta,$
(9) where
$ k(r(\theta)) = \sqrt{\left(\dfrac{2\mu}{\hbar^2} \right) |Q_\alpha - V(r(\theta))|} $ . θ is the angle between the emission direction of the α particle and the axis of rotational symmetry of the deformed nucleus.The effective potential
$ V(r) $ between the α cluster and the daughter nucleus is expressed as$ V(r) = V_N(r)+ V_C(r)+ V_l(r), $
(10) with
$ V_N(r) $ being the nuclear potential,$ V_C(r) $ being the Coulomb potential, and$ V_l(r) $ being the centrifugal potential.For the nuclear potential
$ V_N(r) $ , we employ the cosh-parametrized form [45]:$ V_N(r)=\frac{-V_{0}(1+\cosh(R_d^{'}/a_0)}{(\cosh(r/a_0)+\cosh(R_d^{'}/a_0))}, $
(11) where the parameters
$ V_0 $ and$ a_0 $ denote the depth and diffuseness of the potential [46], respectively. The parameter$ V_0 $ is given as$ V_0=192.42+31.059\dfrac{N_d-Z_d}{A_d} $ [47]. Considering the effects of the deformation,$ R_d^{'} $ of the daughter nucleus is given by [48]$ R_d^{'}(\theta) = R_d \left( 1 + \beta_2 Y_{20}(\theta) + \beta_4 Y_{40}(\theta) + \beta_6 Y_{60}(\theta) \right), $
(12) where
$ \beta_2 $ ,$ \beta_4 $ , and$ \beta_6 $ are quadrupole, hexadecapole, and hexacontatetrapole deformations of daughter nuclei, respectively [49].$ Y_{lm} $ is spherical harmonics function.$ R_d $ is the sharp radius of daughter nucleus, which is expressed by an empirical formula.$ R_{d} = \left( 1.28A_{d}^{1/3}-0.76+0.8A_{d}^{-1/3}\right){\rm fm}. $
(13) Considering the effect of the deformations, the Coulomb potential
$ V_{C}(r) $ between the α cluster and the daughter nucleus is expressed as [50]$ V_C(\vec{r}, \theta) = \int \int \frac{\rho_{\rm d}(\vec{r}_1) \rho_\alpha(\vec{r}_2)}{|\vec{r} + \vec{r}_2 - \vec{r}_1|} \, {\rm d}\vec{r}_2 \, {\rm d}\vec{r}_1, $
(14) where
$ \vec{r} $ is the vector between the centres of the α particle and daughter nucleus,$ \vec{r}_1 $ and$ \vec{r}_2 $ are the radius vectors in the charge distributions of the α particle and daughter nucleus. θ represents the angle between the emission direction of the α particle and the axis of rotational symmetry of deformed nucleus, which are implicit in$ \rho_\alpha $ and$ \rho_d $ . Properly simplified using Fourier transform, the Coulomb potential can be approximated as$ V_C(\vec{r}, \theta) = V_C^{(0)}(r) + V_C^{(1)}(\vec{r}, \theta) + V_C^{(2)}(\vec{r}, \theta), $
(15) where
$ V_C^{(0)}(r) $ ,$ V_C^{(1)}(\vec{r}, \theta) $ , and$ V_C^{(2)}(\vec{r}, \theta) $ are the bare Coulomb interaction, linear Coulomb coupling, and second-order Coulomb coupling, respectively [51].The centrifugal potential is given by [52]
$ V_l(r) =\dfrac{\hbar^2}{2\mu r^2}l(l+1), $
(16) where l is the angular momentum taken away by the α cluster. For even-even nuclei, l is always 0. Hence, the influence of the angular momentum on α-decay half-lives is not considered in this work.
-
In this study, the α-decay half-lives of 195 even-even nuclei are systematically investigated using a two-potential approach improved by considering nuclear deformation. The experimental α-decay half-lives, α-decay energies (
$ Q_\alpha $ ), and binding energies are taken from NUBASE2020 [53] and AME2020 [54]. Using a fixed diffuseness parameter of$ a_0 = 0.5958 $ in a cosh potential, α-decay half-lives are calculated for the even-even nuclei without considering nuclear deformation, denoted as$ \log _{10}T_{1/2}^{\rm{Cal(1)}} $ . Within the deformed two-potential approach, when the nuclear deformations of the daughter nuclei ($ \beta_2 $ ,$ \beta_4 $ , and$ \beta_6 $ ) are taken from the FRDM2012 [55], WS4 [49], and DRHBc [56] mass models, the corresponding α-decay half-lives are denoted by$ \log _{10}T_{1/2}^{\rm{Cal(2)}} $ ,$ \log _{10}T_{1/2}^{\rm{Cal(3)}} $ , and$ \log_{10}T_{1/2}^{\rm{Cal(4)}} $ . Note that the DRHBc mass model does not include the hexadecapole and hexacontatetrapole deformations ($ \beta_4 $ and$ \beta_6 $ ); therefore, we fix$ \beta_4 $ =$ \beta_6 $ = 0 in the α-decay half-lives calculations.In Ref. [39], the authors emphasized that the average diffuseness parameter
$ a_0 $ varies with different mass numbers. In this study, in the deformed TPA, the diffuseness parameter$ a_0 $ is determined by fitting the experimental α-decay half-lives of the nuclei within a deformed two-potential approach, when nuclear deformations are taken from the FRDM model. The values of fitted diffuseness parameter$ a_0 $ are listed in Table 1 and the corresponding calculated α-decay half-lives of the nuclei is denoted by$ \log _{10}T_{1/2}^{\rm{Cal(5)}} $ . Using the fitted diffuseness parameter$ a_0 $ , the α-decay half-lives are also calculated with the deformed TPA approach, using nuclear deformations taken from the WS4 and DRHBc models, denoted by$ \log _{10}T_{1/2}^{\rm{Cal(6)}} $ , and$ \log _{10}T_{1/2}^{\rm{Cal(7)}} $ , respectively.A $ a_0 $ /fm

A $ a_0 $ /fm

102-150 0.6750 152-178 0.6080 180-212 0.5550 214-242 0.6080 244-254 0.5780 256-294 0.5600 Table 1. Diffuseness parameters
$ a_0 $ for different mass regions.To precisely compare model predictions of α-decay half-lives with experimental data, we caclulate the RMSD for the nuclei as follows:
$ \sigma_i=\sqrt{\sum(\log _{10}T_{1/2}^{\rm{Cal(i)}}-\log _{10}T_{1/2}^{{\rm{exp}}})^{2}/n}, $

(17) where
$ \log_{10}T_{1/2}^{\rm{Cal(i)}} $ represents the calculated α-decay half-life using TPA, and$ \log_{10}T_{1/2}^{\rm{exp}} $ denotes the experimental α-decay half-life. The values$ \sigma_1 $ ,$ \sigma_2 $ ,$ \sigma_3 $ , and$ \sigma_4 $ correspond to the deviations (σ) between the experimental and calculated α-decay half-lives:$ \log_{10}T_{1/2}^{\rm{Cal(1)}} $ ,$ \log_{10}T_{1/2}^{\rm{Cal(2)}} $ ,$ \log_{10}T_{1/2}^{\rm{Cal(3)}} $ , and$ \log_{10}T_{1/2}^{\rm{Cal(4)}} $ , with the diffuseness parameter$ a_0=0.5958 $ , respectively. Similarly,$ \sigma_5 $ ,$ \sigma_6 $ , and$ \sigma_7 $ represent the σ deviations between the experimental and calculated α-decay half-lives:$ \log_{10}T_{1/2}^{\rm{Cal(5)}} $ ,$ \log_{10}T_{1/2}^{\rm{Cal(6)}} $ , and$ \log_{10}T_{1/2}^{\rm{Cal(7)}} $ , respectively, where the fitted diffuse parameter$ a_0 $ is obtained from Table 1. The corresponding RMSDs between the experimental and calculated α-decay half-lives within the TPA framework are listed in Table 2.TPA without β TPA with β deformation source − FRDM WS4 DRHBc RMSD $ \sigma_1 $ 

$ \sigma_2 $ 

$ \sigma_5 $ 

$ \sigma_3 $ 

$ \sigma_6 $ 

$ \sigma_4 $ 

$ \sigma_7 $ 

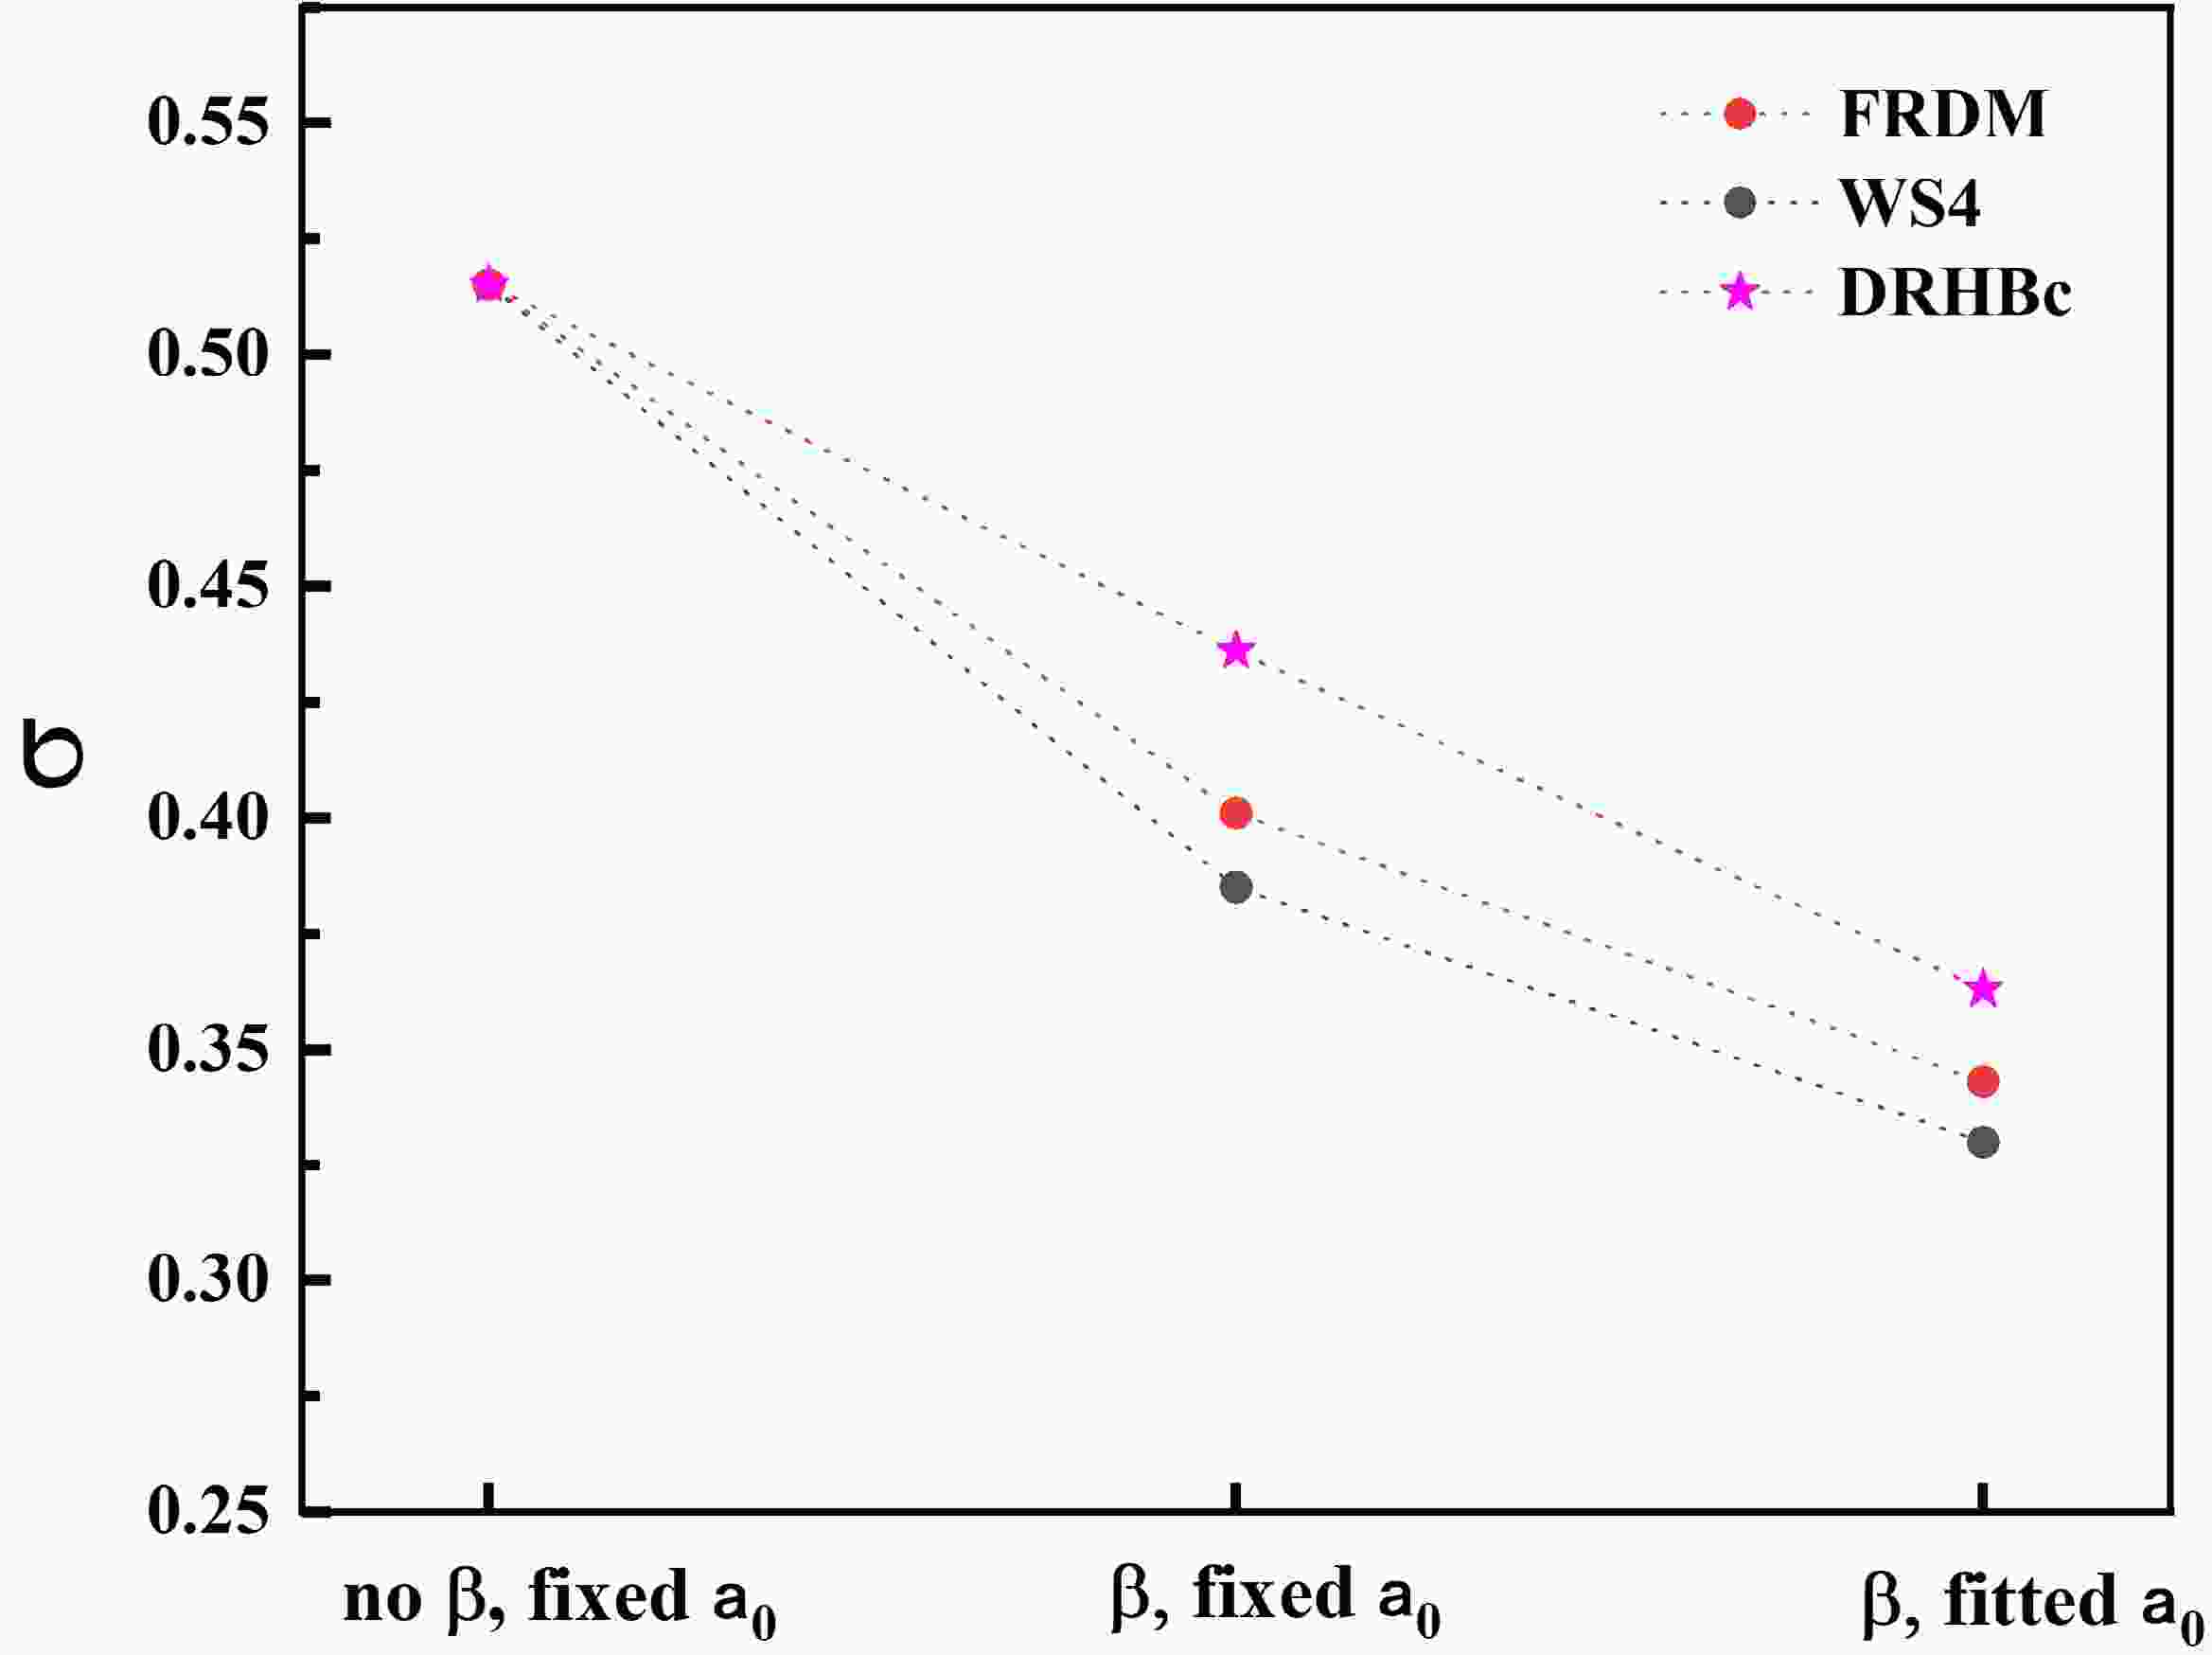
value 0.515 0.385 0.330 0.401 0.343 0.436 0.363 Table 2. Root mean square deviations between experimental α-decay half-lives and the calculated results using TPA.
Table 2 shows that when nuclear deformations from the FRDM model [55] are considered within the deformed TPA, and the diffuseness parameter
$ a_0 = 0.5958 $ is used in the cosh potential, the σ-value decreases from 0.515 to 0.385. This confirms that including nuclear deformations enhances the agreement between calculated results of the deformed TPA and experimental data, which is consistent with the conclusions of Ref. [38]. A similar trend is observed when nuclear deformations from the WS4 [49] and DRHBc [56] models are used, with the σ-value decreasing from 0.515 to 0.401 and 0.436, respectively. As shown in Fig. 1, the RMSDs calculated using the deformed TPA are lower than those without considering nuclear deformations. Additionally, when the nuclear deformation are taken from the DRHBc model, the RMSD is higher than those calculated using nuclear deformations from the WS4 and FRDM models. This is because the DRHBc model does not provide values for$ \beta_4 $ and$ \beta_6 $ , which are assumed to be zero in this study. This assumption reduces the accuracy of the α-decay half-life calculations, leading to a higher RMSD than for the results obtained when using deformation parameters from the WS4 and FRDM models.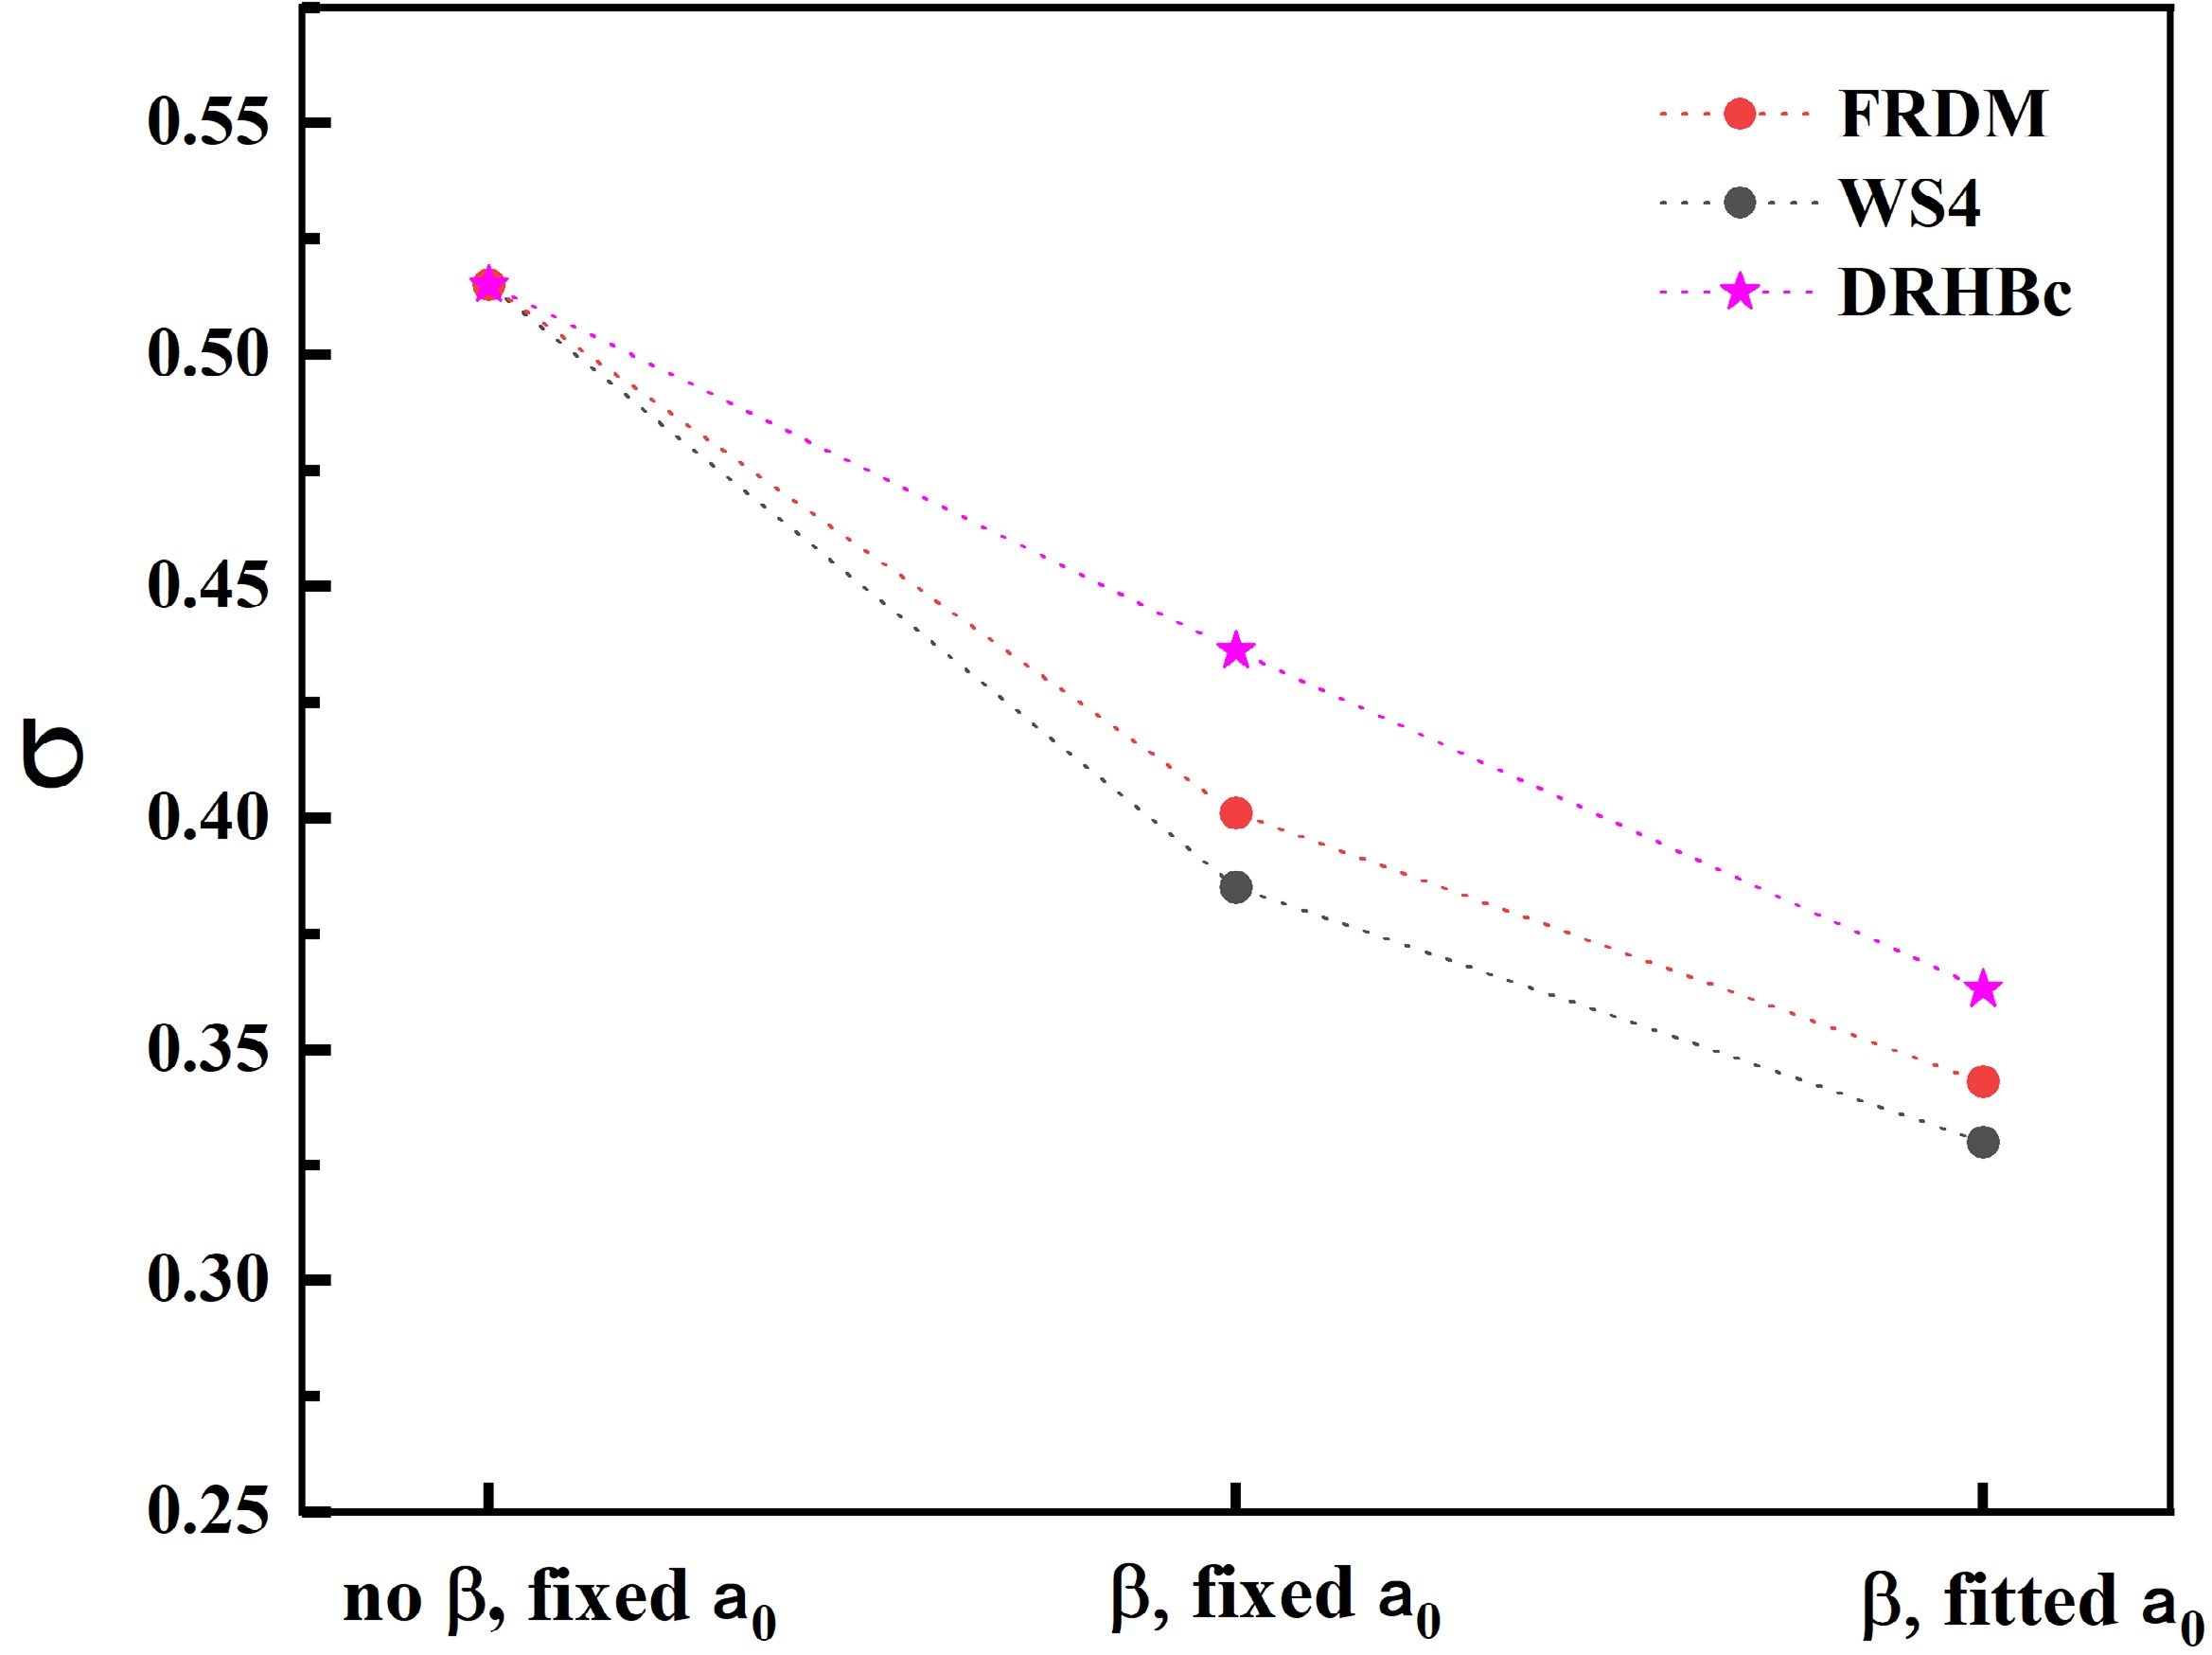
Figure 1. (color online) Root mean square deviations between the experimental data and calculated results by using the deformed TPA with nuclear deformations obtained from FRDM, WS4, and DRHBc models, respectively.
To gain a more detailed insight, Fig. 2 presents the logarithmic deviations between the experimental data and calculated results using the deformed TPA with deformation parameters from the FRDM model. As shown in Fig. 2, the deviations between the theoretical and experimental values significantly reduce when nuclear deformations are considered, particularly for
$ 158 \leq A \leq 180 $ and$ 222 \leq A \leq 254 $ . This improvement is attributed to the fact that, for most nuclei in the mass region$ 158 \leq A \leq 180 $ , the quadrupole deformation of their daughter nuclei exceeds an absolute value of 0.15. Meanwhile, for nuclei in the$ 222 \leq A \leq 254 $ region, the quadrupole deformation of daughter nuclei of these nuclei has an absolute value greater than 0.2. Previous studies have shown that quadrupole deformation has a more significant impact on α-decay half-lives than other deformations, such as hexadecapole deformations [34]. Therefore, considering quadrupole deformation of the daughter nuclei leads to an improvement in the deviation between calculated and experimental values for these nuclei.
Figure 2. (color online) Deviations between experimental and calculated α-decay half-lives. The x-axis represents the mass number of the nuclei and y-axis represents the deviation of the decimal logarithms of
$ T_{1/2}^{\rm cal}/T_{1/2}^{\rm exp} $ . The black circles represent the theoretical values calculated using the TPA without considering deformation. The red and blue circles represent the theoretical values calculated using the deformed TPA with nuclear deformations obtained form FRDM model, when the diffuseness parameter are taken as fixed and fitted$ a_0 $ , respectively.To illustrate the impact of deformation on the α-decay process, we calculated the effective potential
$ V(r) $ of 232Th with and without considering deformation in TPA. As shown in Fig. 3, when deformation is considered, the width and height of the effective potential$ V(r) $ decreases, indicating that the α-particle has a higher probability of tunneling through the potential barrier. Specifically, the logarithmic deviation between the theoretical and experimental α-decay half-life for 232Th without considering deformation is 0.988, with the theoretical value being higher than the experimental value. When deformation is considered, the reduction in the width and height of the effective potential$ V(r) $ leads to a lower α-decay half-life, resulting in a better agreement with experimental data. The logarithmic deviation between the theoretical and experimental α-decay half-life after considering deformation is 0.451 (FRDM model), 0.353 (WS4 model), and 0.521 (DRHBc model), showing improved accuracy. These results demonstrate the importance of incorporating deformation effects in TPA to enhance the precision of α-decay half-lives calculations and reduce the discrepancy between theoretical and experimental values.
Figure 3. (color online) Variation in
$ V(r) $ for the nucleus 232Th in TPA with and without deformation. The black dashed line represents the potential without deformation, whereas the other three curves correspond to the potential changes with deformation from the FRDM (green dashed line), WS4 (brown dashed line), and DRHB (red dashed line) models.Additionally, some studies have shown that the average diffuseness parameter
$ a_0 $ varies across different mass regions, and by adjusting$ a_0 $ , the accuracy of the model in calculating α-decay half-lives can be enhanced [21, 39]. To further improve the accuracy of the deformed TPA approach, we fit the diffuseness parameter$ a_0 $ for different mass regions based on experimental data. With the fitted$ a_0 $ , the deviations between the calculated α-decay half-lives and experimental values are represented by the blue circles in Fig. 2. We observe that, compared with the fixed$ a_0 = 0.5958 $ , these data points lie closer to the zero line, particularly in the regions$ 100 \leq A \leq 152 $ and$ 180 \leq A \leq 214 $ . Additionally, the RMSD decreases from 0.385 to 0.330. This demonstrates that adjusting the diffuseness parameter$ a_0 $ improves the accuracy of the model in calculating α-decay half-lives.To further verify the reliability of the fitted
$ a_0 $ , we calculated the α-decay half-lives using the same approach with deformation parameters from the WS4 and DRHBc models, and the results are compared with experimental values. The deviations are shown in Fig. 4. As observed, with the fitted$ a_0 $ , the deviations between the calculated α-decay half-lives and experimental values are further reduced, with the σ-values decreasing from 0.401 to 0.343 and from 0.436 to 0.363 when the deformation parameters are taken from the WS4 and DRHBc models, respectively. This confirms the effectiveness of adjusting the diffuseness parameter$ a_0 $ to enhance the accuracy of α-decay half-life calculations.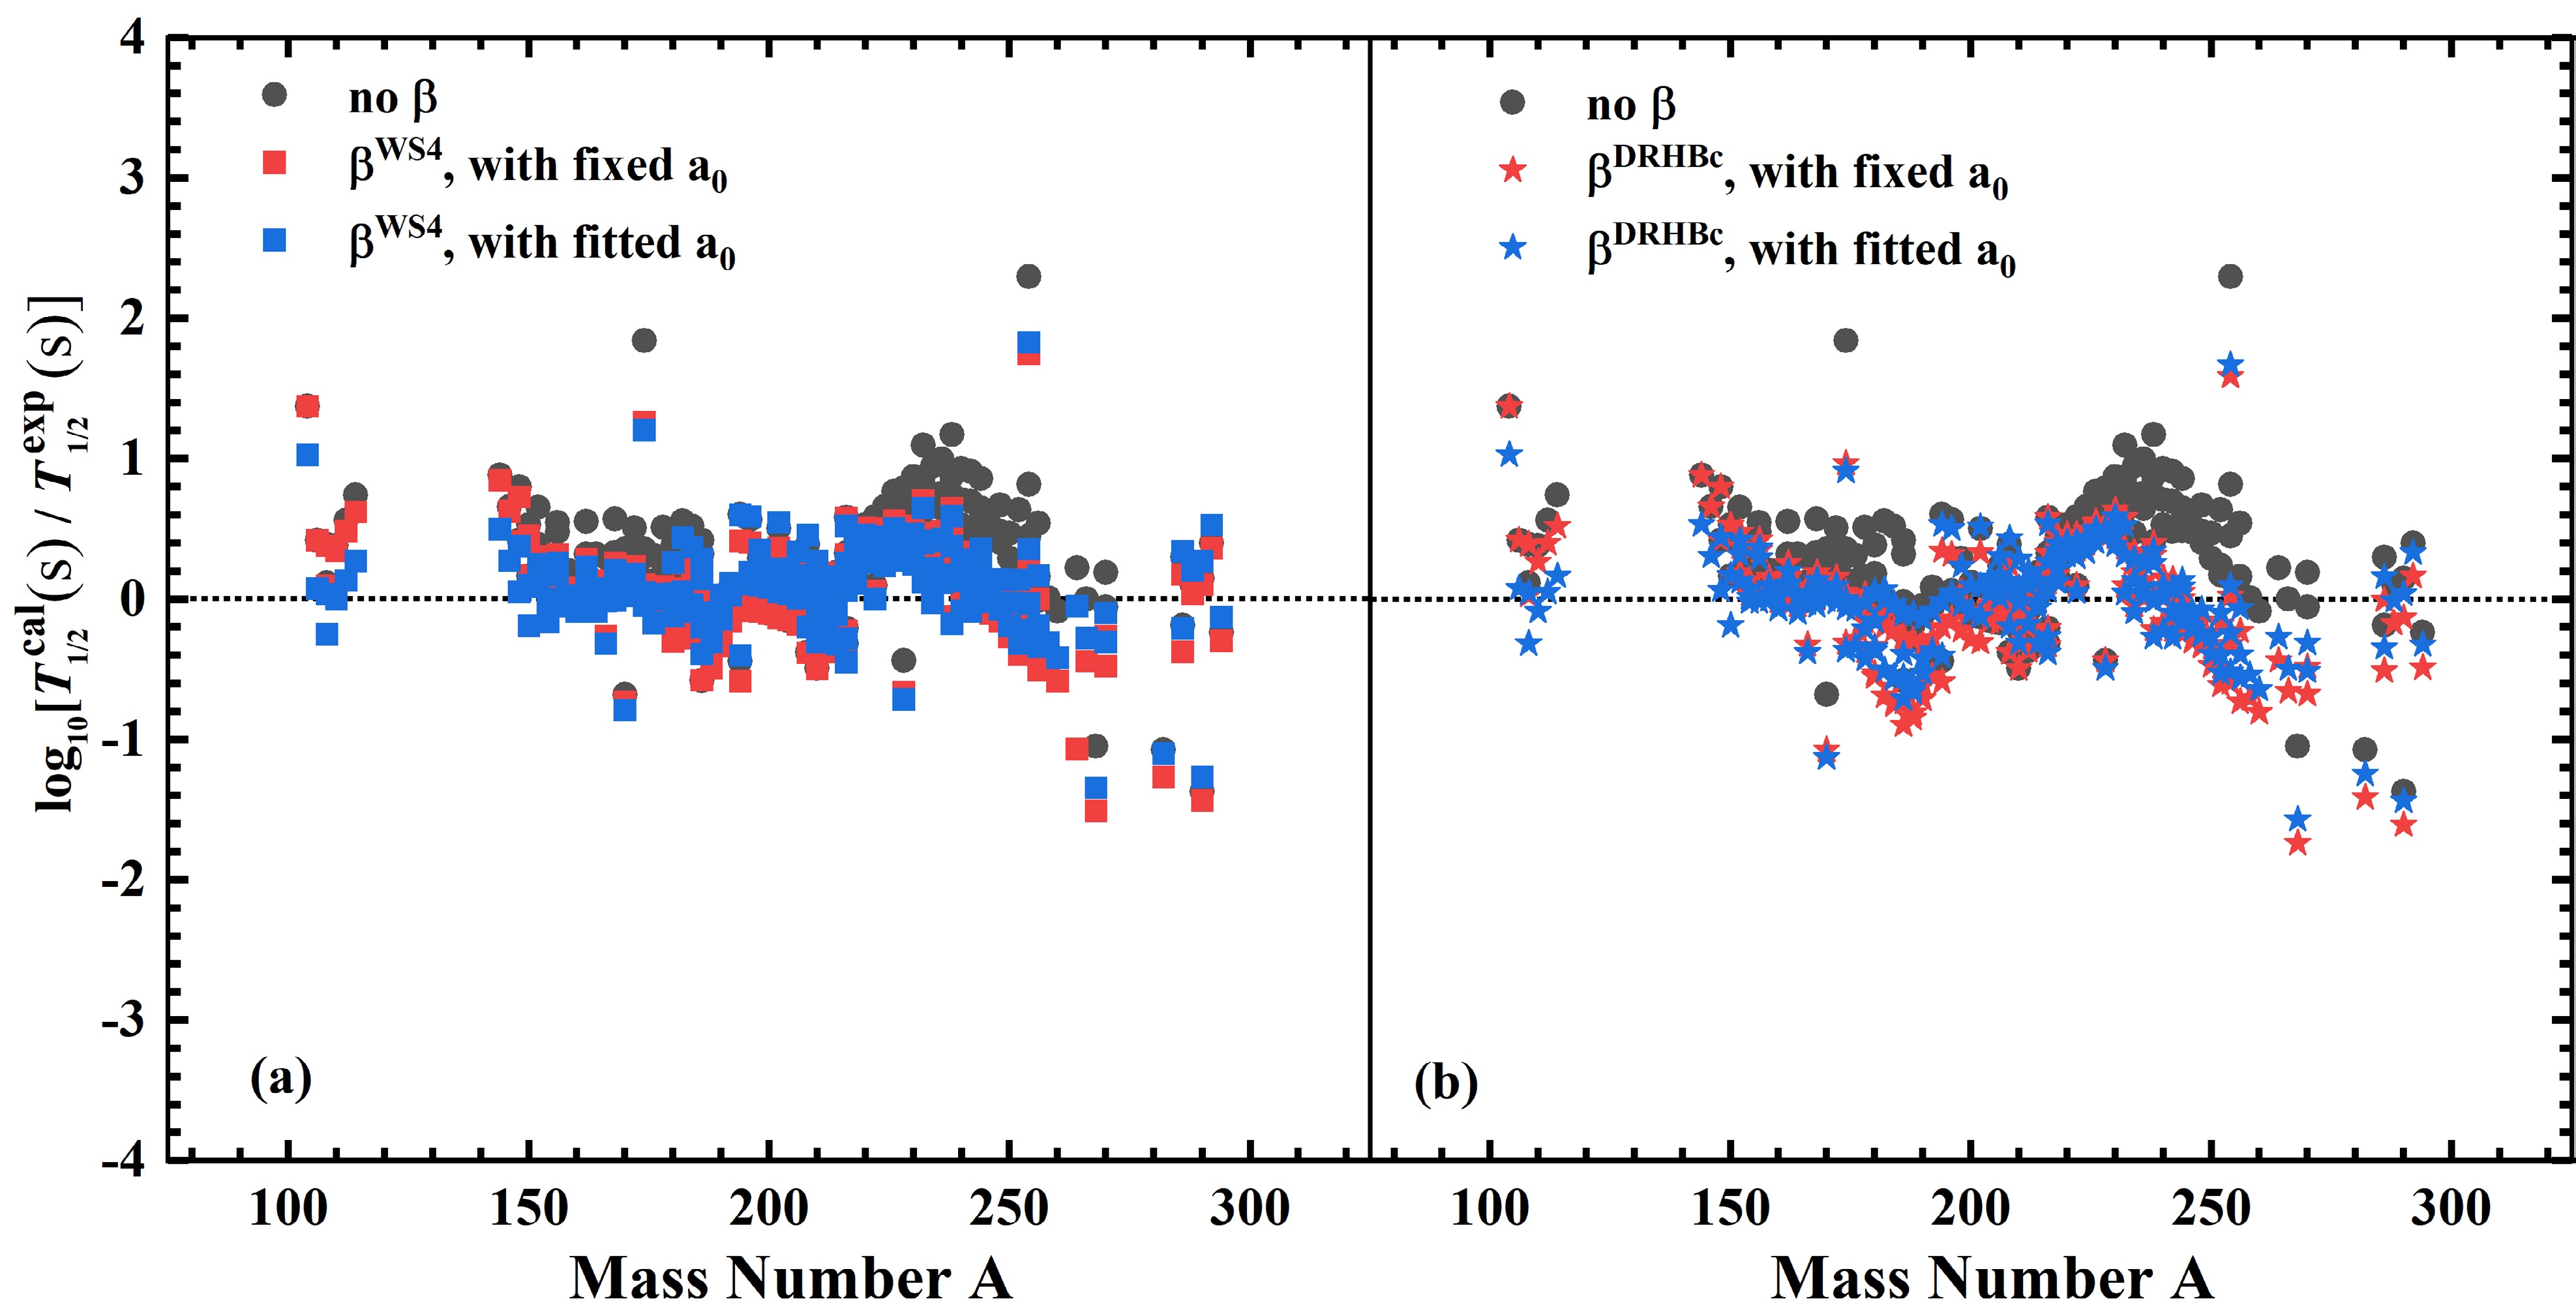
Figure 4. (color online) Same as Fig. 3 but nuclear deformations are obtained from WS4 (a) and DRHBc (b) models, respectively.
-
In this study, the α-decay half-lives of 195 even-even nuclei are systematically investigated using a two-potential approach improved by considering nuclear deformation. The experimental α-decay half-lives, α-decay energies (
$ Q_\alpha $ ), and binding energies are taken from NUBASE2020 [53] and AME2020 [54]. Using a fixed diffuseness parameter of$ a_0 = 0.5958 $ in a cosh potential, α-decay half-lives are calculated for the even-even nuclei without considering nuclear deformation, denoted as$ \log _{10}T_{1/2}^{\rm{Cal(1)}} $ . Within the deformed two-potential approach, when the nuclear deformations of the daughter nuclei ($ \beta_2 $ ,$ \beta_4 $ , and$ \beta_6 $ ) are taken from the FRDM2012 [55], WS4 [49], and DRHBc [56] mass models, the corresponding α-decay half-lives are denoted by$ \log _{10}T_{1/2}^{\rm{Cal(2)}} $ ,$ \log _{10}T_{1/2}^{\rm{Cal(3)}} $ , and$ \log_{10}T_{1/2}^{\rm{Cal(4)}} $ . Note that the DRHBc mass model does not include the hexadecapole and hexacontatetrapole deformations ($ \beta_4 $ and$ \beta_6 $ ); therefore, we fix$ \beta_4 $ =$ \beta_6 $ = 0 in the α-decay half-lives calculations.In Ref. [39], the authors emphasized that the average diffuseness parameter
$ a_0 $ varies with different mass numbers. In this study, in the deformed TPA, the diffuseness parameter$ a_0 $ is determined by fitting the experimental α-decay half-lives of the nuclei within a deformed two-potential approach, when nuclear deformations are taken from the FRDM model. The values of fitted diffuseness parameter$ a_0 $ are listed in Table 1 and the corresponding calculated α-decay half-lives of the nuclei is denoted by$ \log _{10}T_{1/2}^{\rm{Cal(5)}} $ . Using the fitted diffuseness parameter$ a_0 $ , the α-decay half-lives are also calculated with the deformed TPA approach, using nuclear deformations taken from the WS4 and DRHBc models, denoted by$ \log _{10}T_{1/2}^{\rm{Cal(6)}} $ , and$ \log _{10}T_{1/2}^{\rm{Cal(7)}} $ , respectively.A $ a_0 $ /fmA $ a_0 $ /fm102-150 0.6750 152-178 0.6080 180-212 0.5550 214-242 0.6080 244-254 0.5780 256-294 0.5600 Table 1. Diffuseness parameters
$ a_0 $ for different mass regions.To precisely compare model predictions of α-decay half-lives with experimental data, we caclulate the RMSD for the nuclei as follows:
$ \sigma_i=\sqrt{\sum(\log _{10}T_{1/2}^{\rm{Cal(i)}}-\log _{10}T_{1/2}^{{\rm{exp}}})^{2}/n}, $
(17) where
$ \log_{10}T_{1/2}^{\rm{Cal(i)}} $ represents the calculated α-decay half-life using TPA, and$ \log_{10}T_{1/2}^{\rm{exp}} $ denotes the experimental α-decay half-life. The values$ \sigma_1 $ ,$ \sigma_2 $ ,$ \sigma_3 $ , and$ \sigma_4 $ correspond to the deviations (σ) between the experimental and calculated α-decay half-lives:$ \log_{10}T_{1/2}^{\rm{Cal(1)}} $ ,$ \log_{10}T_{1/2}^{\rm{Cal(2)}} $ ,$ \log_{10}T_{1/2}^{\rm{Cal(3)}} $ , and$ \log_{10}T_{1/2}^{\rm{Cal(4)}} $ , with the diffuseness parameter$ a_0=0.5958 $ , respectively. Similarly,$ \sigma_5 $ ,$ \sigma_6 $ , and$ \sigma_7 $ represent the σ deviations between the experimental and calculated α-decay half-lives:$ \log_{10}T_{1/2}^{\rm{Cal(5)}} $ ,$ \log_{10}T_{1/2}^{\rm{Cal(6)}} $ , and$ \log_{10}T_{1/2}^{\rm{Cal(7)}} $ , respectively, where the fitted diffuse parameter$ a_0 $ is obtained from Table 1. The corresponding RMSDs between the experimental and calculated α-decay half-lives within the TPA framework are listed in Table 2.TPA without β TPA with β deformation source − FRDM WS4 DRHBc RMSD $ \sigma_1 $ $ \sigma_2 $ $ \sigma_5 $ $ \sigma_3 $ $ \sigma_6 $ $ \sigma_4 $ $ \sigma_7 $ value 0.515 0.385 0.330 0.401 0.343 0.436 0.363 Table 2. Root mean square deviations between experimental α-decay half-lives and the calculated results using TPA.
Table 2 shows that when nuclear deformations from the FRDM model [55] are considered within the deformed TPA, and the diffuseness parameter
$ a_0 = 0.5958 $ is used in the cosh potential, the σ-value decreases from 0.515 to 0.385. This confirms that including nuclear deformations enhances the agreement between calculated results of the deformed TPA and experimental data, which is consistent with the conclusions of Ref. [38]. A similar trend is observed when nuclear deformations from the WS4 [49] and DRHBc [56] models are used, with the σ-value decreasing from 0.515 to 0.401 and 0.436, respectively. As shown in Fig. 1, the RMSDs calculated using the deformed TPA are lower than those without considering nuclear deformations. Additionally, when the nuclear deformation are taken from the DRHBc model, the RMSD is higher than those calculated using nuclear deformations from the WS4 and FRDM models. This is because the DRHBc model does not provide values for$ \beta_4 $ and$ \beta_6 $ , which are assumed to be zero in this study. This assumption reduces the accuracy of the α-decay half-life calculations, leading to a higher RMSD than for the results obtained when using deformation parameters from the WS4 and FRDM models.
Figure 1. (color online) Root mean square deviations between the experimental data and calculated results by using the deformed TPA with nuclear deformations obtained from FRDM, WS4, and DRHBc models, respectively.
To gain a more detailed insight, Fig. 2 presents the logarithmic deviations between the experimental data and calculated results using the deformed TPA with deformation parameters from the FRDM model. As shown in Fig. 2, the deviations between the theoretical and experimental values significantly reduce when nuclear deformations are considered, particularly for
$ 158 \leq A \leq 180 $ and$ 222 \leq A \leq 254 $ . This improvement is attributed to the fact that, for most nuclei in the mass region$ 158 \leq A \leq 180 $ , the quadrupole deformation of their daughter nuclei exceeds an absolute value of 0.15. Meanwhile, for nuclei in the$ 222 \leq A \leq 254 $ region, the quadrupole deformation of daughter nuclei of these nuclei has an absolute value greater than 0.2. Previous studies have shown that quadrupole deformation has a more significant impact on α-decay half-lives than other deformations, such as hexadecapole deformations [34]. Therefore, considering quadrupole deformation of the daughter nuclei leads to an improvement in the deviation between calculated and experimental values for these nuclei.
Figure 2. (color online) Deviations between experimental and calculated α-decay half-lives. The x-axis represents the mass number of the nuclei and y-axis represents the deviation of the decimal logarithms of
$ T_{1/2}^{\rm cal}/T_{1/2}^{\rm exp} $ . The black circles represent the theoretical values calculated using the TPA without considering deformation. The red and blue circles represent the theoretical values calculated using the deformed TPA with nuclear deformations obtained form FRDM model, when the diffuseness parameter are taken as fixed and fitted$ a_0 $ , respectively.To illustrate the impact of deformation on the α-decay process, we calculated the effective potential
$ V(r) $ of 232Th with and without considering deformation in TPA. As shown in Fig. 3, when deformation is considered, the width and height of the effective potential$ V(r) $ decreases, indicating that the α-particle has a higher probability of tunneling through the potential barrier. Specifically, the logarithmic deviation between the theoretical and experimental α-decay half-life for 232Th without considering deformation is 0.988, with the theoretical value being higher than the experimental value. When deformation is considered, the reduction in the width and height of the effective potential$ V(r) $ leads to a lower α-decay half-life, resulting in a better agreement with experimental data. The logarithmic deviation between the theoretical and experimental α-decay half-life after considering deformation is 0.451 (FRDM model), 0.353 (WS4 model), and 0.521 (DRHBc model), showing improved accuracy. These results demonstrate the importance of incorporating deformation effects in TPA to enhance the precision of α-decay half-lives calculations and reduce the discrepancy between theoretical and experimental values.
Figure 3. (color online) Variation in
$ V(r) $ for the nucleus 232Th in TPA with and without deformation. The black dashed line represents the potential without deformation, whereas the other three curves correspond to the potential changes with deformation from the FRDM (green dashed line), WS4 (brown dashed line), and DRHB (red dashed line) models.Additionally, some studies have shown that the average diffuseness parameter
$ a_0 $ varies across different mass regions, and by adjusting$ a_0 $ , the accuracy of the model in calculating α-decay half-lives can be enhanced [21, 39]. To further improve the accuracy of the deformed TPA approach, we fit the diffuseness parameter$ a_0 $ for different mass regions based on experimental data. With the fitted$ a_0 $ , the deviations between the calculated α-decay half-lives and experimental values are represented by the blue circles in Fig. 2. We observe that, compared with the fixed$ a_0 = 0.5958 $ , these data points lie closer to the zero line, particularly in the regions$ 100 \leq A \leq 152 $ and$ 180 \leq A \leq 214 $ . Additionally, the RMSD decreases from 0.385 to 0.330. This demonstrates that adjusting the diffuseness parameter$ a_0 $ improves the accuracy of the model in calculating α-decay half-lives.To further verify the reliability of the fitted
$ a_0 $ , we calculated the α-decay half-lives using the same approach with deformation parameters from the WS4 and DRHBc models, and the results are compared with experimental values. The deviations are shown in Fig. 4. As observed, with the fitted$ a_0 $ , the deviations between the calculated α-decay half-lives and experimental values are further reduced, with the σ-values decreasing from 0.401 to 0.343 and from 0.436 to 0.363 when the deformation parameters are taken from the WS4 and DRHBc models, respectively. This confirms the effectiveness of adjusting the diffuseness parameter$ a_0 $ to enhance the accuracy of α-decay half-life calculations.
Figure 4. (color online) Same as Fig. 3 but nuclear deformations are obtained from WS4 (a) and DRHBc (b) models, respectively.
-
Using the deformed TPA with diffuseness
$ a_0 =0.5600 $ in cosh potential, we predict the α-decay half-lives of even-even nuclei with Z = 180 and 120 isotopes. In Table 3, the first column represents the parent nucleus. The binding energies required to calculate$ P_{\alpha} $ and$ Q_{\alpha} $ are taken from the WS4 [49] and FRDM [55] models, respectively, which are shown in second to fifth columns.$ \log_{10}T_{1/2}^{\rm{Cal(9)}} $ and$ \log_{10}T_{1/2}^{\rm{Cal(10)}} $ in last two columns represent the logarithms of the calculated α-decay half-lives, when nuclear deformations are taken from the WS4 [49] and FRDM [55] models, respectively.Nucleus $ Q^{\rm{WS4}} $ 

$ Q^{{\rm{FRDM}}} $ 

$ lgP_{\alpha}^{\rm{WS4}} $ 

$ lgP_{\alpha}^{{\rm{FRDM}}} $ 

$ \log_{10}T_{1/2}^{\rm{Cal(9)}} $ 

$ \log_{10}T_{1/2}^{\rm{Cal(10)}} $ 

282118 13.49 13.12 −0.528 −0.663 −6.727 −5.633 284118 13.21 13.56 −0.591 −0.663 −5.914 −6.477 286118 12.89 13.05 −0.593 −0.719 −5.348 −5.547 288118 12.59 12.86 −0.629 −0.723 −4.769 −5.224 290118 12.57 12.68 −0.620 −0.728 −4.792 −4.911 292118 12.21 12.39 −0.629 −0.744 −4.057 −4.328 294118 12.17 12.37 −0.658 −0.926 −3.974 −4.125 296118 11.73 12.28 −0.700 −0.796 −2.955 −4.108 298118 12.16 12.49 −0.658 −0.803 −4.010 −4.548 300118 11.93 12.51 −0.671 −0.795 −3.512 −4.617 302118 12.02 12.62 −0.660 −0.791 −3.746 −4.888 304118 13.10 13.39 −0.637 −0.646 −6.030 −6.564 306118 12.46 13.35 −0.628 −0.622 −4.792 −6.547 308118 11.18 12.10 −0.599 −0.518 −1.977 −4.173 310118 10.41 10.74 −0.710 −0.703 −0.122 −0.772 312118 9.74 10.05 −0.694 −0.678 1.711 1.080 288120 13.71 13.85 −0.593 −0.717 −6.368 −6.508 290120 13.68 13.75 −0.602 −0.681 −6.368 −6.420 292120 13.44 13.78 −0.594 −0.690 −5.972 −6.516 294120 13.22 13.49 −0.613 −0.707 −5.608 −6.005 296120 13.32 13.59 −0.622 −0.771 −5.777 −6.145 298120 12.98 13.24 −0.646 −0.715 −5.151 −5.560 300120 13.29 13.70 −0.615 −0.713 −5.813 −6.460 302120 12.87 13.55 −0.623 −0.731 −4.960 −6.175 304120 12.74 13.55 −0.623 −0.749 −4.738 −6.176 306120 13.77 14.28 −0.610 −0.622 −6.750 −7.641 308120 12.95 12.96 −0.575 −0.481 −5.273 −5.395 310120 11.48 11.29 −0.645 −0.712 −2.030 −1.446 312120 11.20 10.71 −0.702 −0.793 −1.584 −0.810 314120 10.74 10.33 −1.039 −0.801 −0.123 0.182 316120 9.17 9.94 −0.862 −0.783 3.591 1.223 318120 9.91 9.66 −0.756 −0.790 1.214 2.043 Table 3. Predictions of α-decay half-lives of even-even nuclei with Z=180 and 120, with the α-decay energies and nuclear deformations
$ \beta_2 $ ,$ \beta_4 $ , and$ \beta_6 $ obtained from the WS4 [50] and FRDM [56] mass models, respectively. The logarithms of α-decay half-lives were calculated using the deformed TPA with the fitted$ a_0 $ , denoted by$ \log_{10}T_{1/2}^{\rm{Cal(9)}} $ and$ \log_{10}T_{1/2}^{\rm{Cal(10)}} $ , respectively, with the values of the nuclear deformation obtained from the WS4 and FRDM models.The calculated α-decay half-lives of the nuclei with Z = 118 and 120 are plotted in Fig. 5. From Fig. 5, we observed that for the isotopes 306, 308118 and 316120, the values of
$ {\rm{log}}_{10}(T_{1/2}^{\rm{Cal(9)}}/T_{1/2}^{\rm{Cal(10)}}) $ exceed 1.7. This is owing to the α-decay energy of these nuclei differences between the WS4 and FRDM models, which are greater than 0.8 MeV. Despite significant differences in$ \log_{10}T_{1/2}^{\rm{Cal(9)}} $ and$ \log_{10}T_{1/2}^{\rm{Cal(10)}} $ for certain isotopes, the trends in the α-decay half-lives of the even-even isotopic chains for$ Z = 118 $ and$ Z = 120 $ are generally consistent. We observed that when the neutron number exceeds$ N = 184 $ , the α-decay half-lives of the nuclei with$ N = 186 $ decrease significantly, by more than 1.5 orders of magnitude. This change highlights the pronounced shell effects, suggesting that$ N = 184 $ appears to be the next magic number beyond$ N = 126 $ . These results not only confirm the pivotal role of decay energy in α-decay but also provide new insights into the stability and nuclear structure of superheavy nuclei.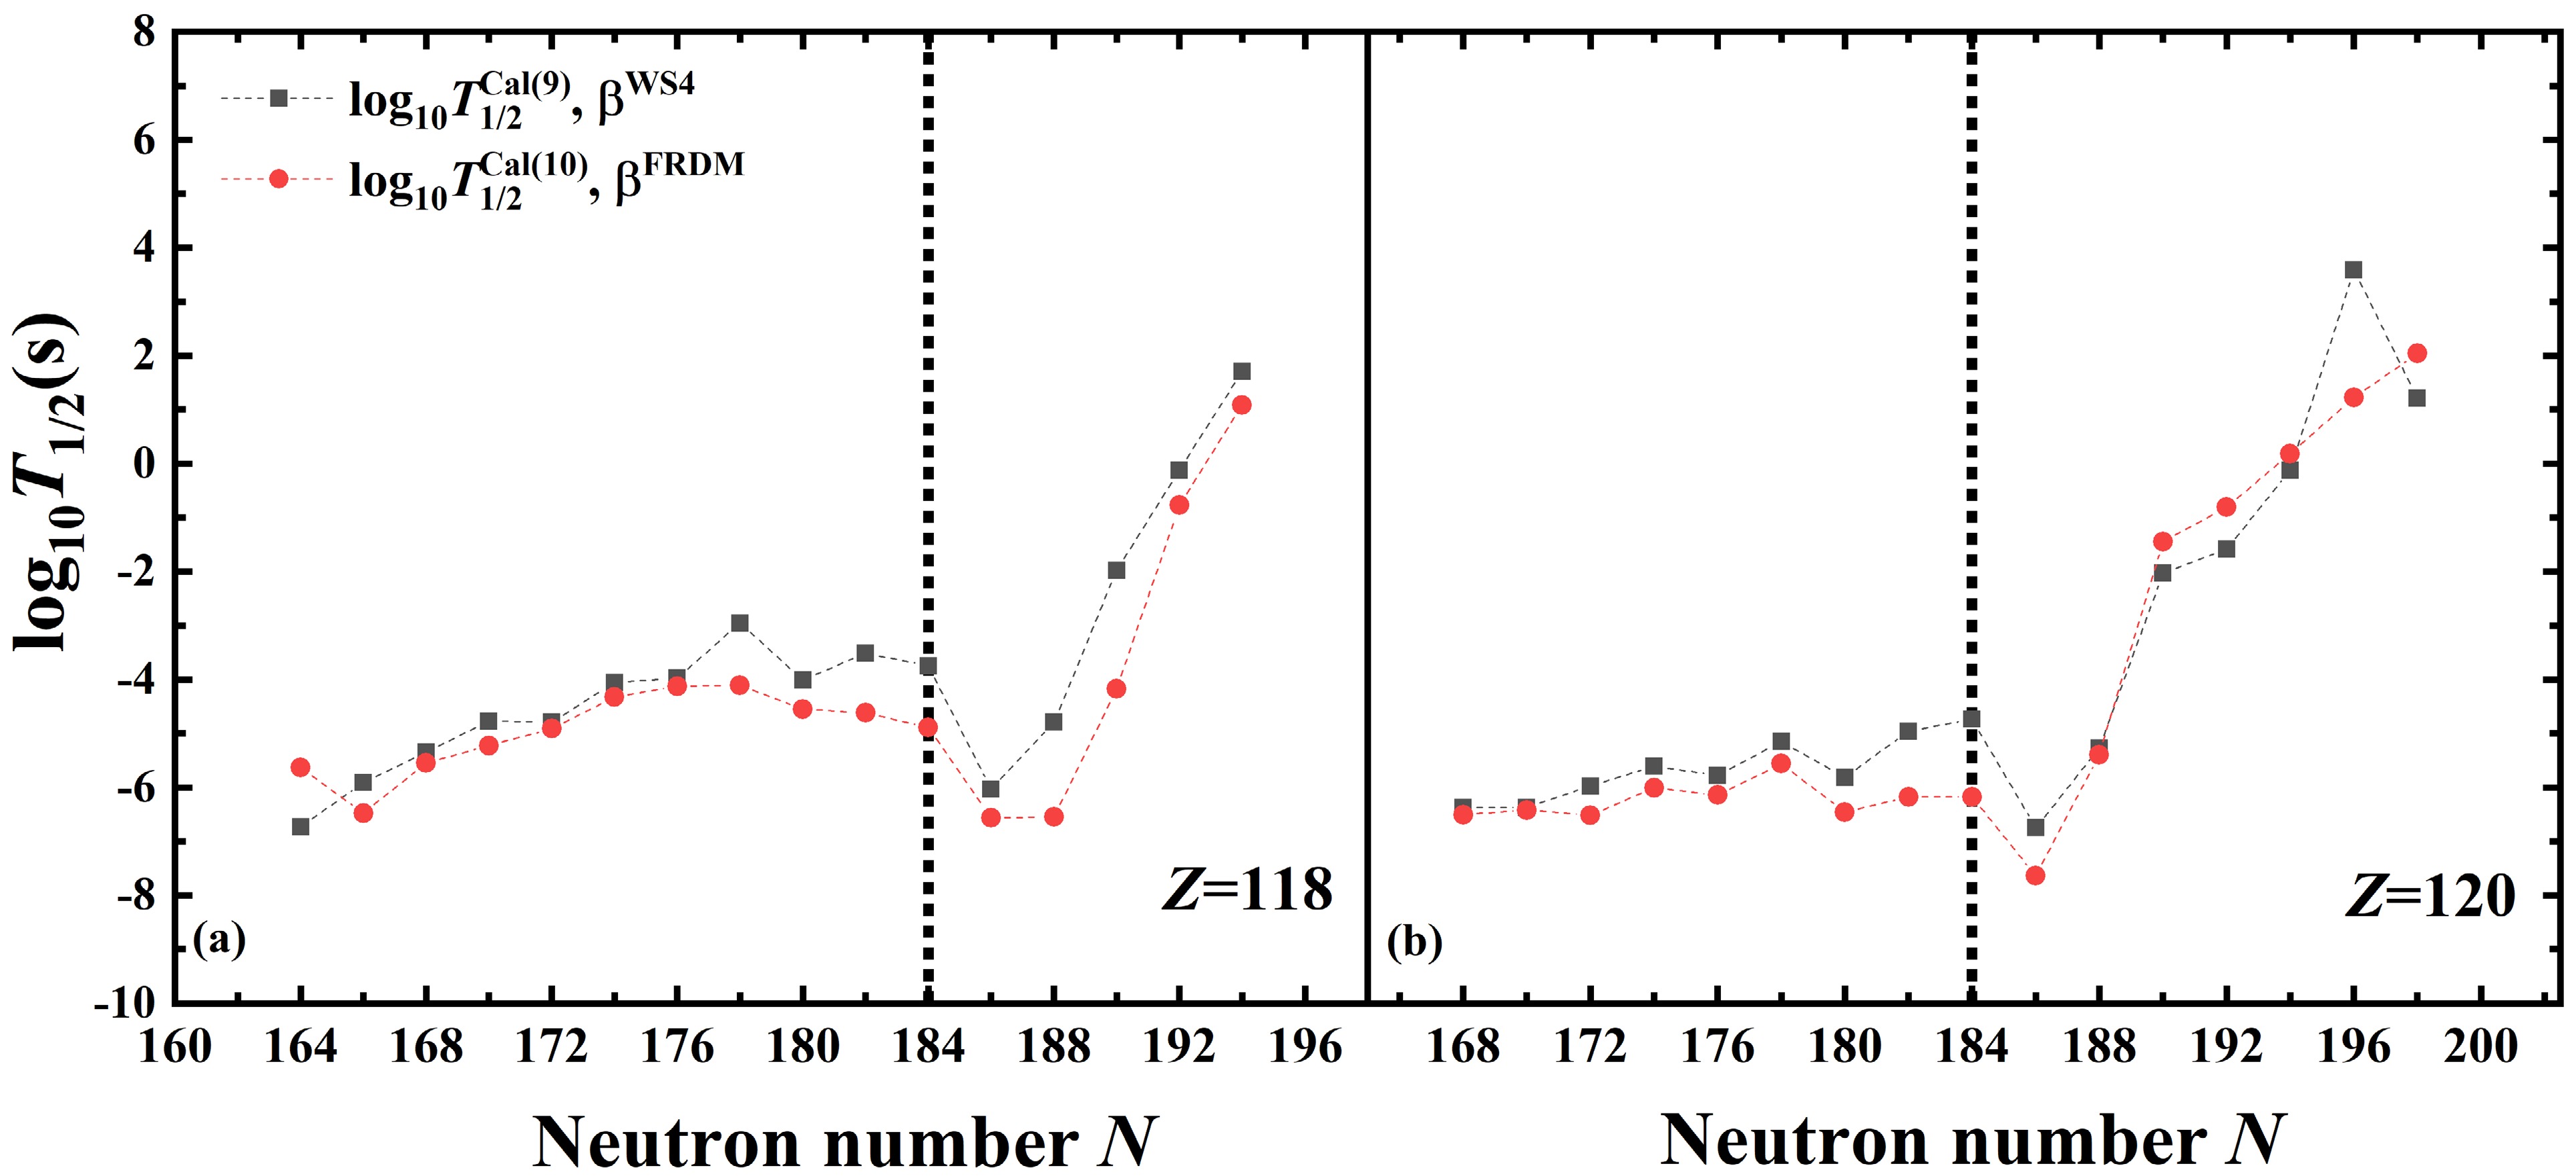
Figure 5. (color online) Predictions of logarithms of α-decay half-lives of even-even nuclei with Z =118 and 120 using the deformed TPA with the fitted
$ a_0 $ . The$ Q_{\alpha} $ and nuclear deformations$ \beta_2 $ ,$ \beta_4 $ , and$ \beta_6 $ are taken from the WS4 [49] and FRDM [55] models, respectively. The corresponding results of logarithms of α-decay half-lives are denoted by$ \log_{10}T_{1/2}^{\rm{Cal(9)}} $ and$ \log_{10}T_{1/2}^{\rm{Cal(10)}} $ , respectively. The black dashed lines denote the neutron number N = 184. -
Using the deformed TPA with diffuseness
$ a_0 =0.5600 $ in cosh potential, we predict the α-decay half-lives of even-even nuclei with Z = 180 and 120 isotopes. In Table 3, the first column represents the parent nucleus. The binding energies required to calculate$ P_{\alpha} $ and$ Q_{\alpha} $ are taken from the WS4 [49] and FRDM [55] models, respectively, which are shown in second to fifth columns.$ \log_{10}T_{1/2}^{\rm{Cal(9)}} $ and$ \log_{10}T_{1/2}^{\rm{Cal(10)}} $ in last two columns represent the logarithms of the calculated α-decay half-lives, when nuclear deformations are taken from the WS4 [49] and FRDM [55] models, respectively.Nucleus $ Q^{\rm{WS4}} $ $ Q^{{\rm{FRDM}}} $ $ lgP_{\alpha}^{\rm{WS4}} $ $ lgP_{\alpha}^{{\rm{FRDM}}} $ $ \log_{10}T_{1/2}^{\rm{Cal(9)}} $ $ \log_{10}T_{1/2}^{\rm{Cal(10)}} $ 282118 13.49 13.12 −0.528 −0.663 −6.727 −5.633 284118 13.21 13.56 −0.591 −0.663 −5.914 −6.477 286118 12.89 13.05 −0.593 −0.719 −5.348 −5.547 288118 12.59 12.86 −0.629 −0.723 −4.769 −5.224 290118 12.57 12.68 −0.620 −0.728 −4.792 −4.911 292118 12.21 12.39 −0.629 −0.744 −4.057 −4.328 294118 12.17 12.37 −0.658 −0.926 −3.974 −4.125 296118 11.73 12.28 −0.700 −0.796 −2.955 −4.108 298118 12.16 12.49 −0.658 −0.803 −4.010 −4.548 300118 11.93 12.51 −0.671 −0.795 −3.512 −4.617 302118 12.02 12.62 −0.660 −0.791 −3.746 −4.888 304118 13.10 13.39 −0.637 −0.646 −6.030 −6.564 306118 12.46 13.35 −0.628 −0.622 −4.792 −6.547 308118 11.18 12.10 −0.599 −0.518 −1.977 −4.173 310118 10.41 10.74 −0.710 −0.703 −0.122 −0.772 312118 9.74 10.05 −0.694 −0.678 1.711 1.080 288120 13.71 13.85 −0.593 −0.717 −6.368 −6.508 290120 13.68 13.75 −0.602 −0.681 −6.368 −6.420 292120 13.44 13.78 −0.594 −0.690 −5.972 −6.516 294120 13.22 13.49 −0.613 −0.707 −5.608 −6.005 296120 13.32 13.59 −0.622 −0.771 −5.777 −6.145 298120 12.98 13.24 −0.646 −0.715 −5.151 −5.560 300120 13.29 13.70 −0.615 −0.713 −5.813 −6.460 302120 12.87 13.55 −0.623 −0.731 −4.960 −6.175 304120 12.74 13.55 −0.623 −0.749 −4.738 −6.176 306120 13.77 14.28 −0.610 −0.622 −6.750 −7.641 308120 12.95 12.96 −0.575 −0.481 −5.273 −5.395 310120 11.48 11.29 −0.645 −0.712 −2.030 −1.446 312120 11.20 10.71 −0.702 −0.793 −1.584 −0.810 314120 10.74 10.33 −1.039 −0.801 −0.123 0.182 316120 9.17 9.94 −0.862 −0.783 3.591 1.223 318120 9.91 9.66 −0.756 −0.790 1.214 2.043 Table 3. Predictions of α-decay half-lives of even-even nuclei with Z=180 and 120, with the α-decay energies and nuclear deformations
$ \beta_2 $ ,$ \beta_4 $ , and$ \beta_6 $ obtained from the WS4 [50] and FRDM [56] mass models, respectively. The logarithms of α-decay half-lives were calculated using the deformed TPA with the fitted$ a_0 $ , denoted by$ \log_{10}T_{1/2}^{\rm{Cal(9)}} $ and$ \log_{10}T_{1/2}^{\rm{Cal(10)}} $ , respectively, with the values of the nuclear deformation obtained from the WS4 and FRDM models.The calculated α-decay half-lives of the nuclei with Z = 118 and 120 are plotted in Fig. 5. From Fig. 5, we observed that for the isotopes 306, 308118 and 316120, the values of
$ {\rm{log}}_{10}(T_{1/2}^{\rm{Cal(9)}}/T_{1/2}^{\rm{Cal(10)}}) $ exceed 1.7. This is owing to the α-decay energy of these nuclei differences between the WS4 and FRDM models, which are greater than 0.8 MeV. Despite significant differences in$ \log_{10}T_{1/2}^{\rm{Cal(9)}} $ and$ \log_{10}T_{1/2}^{\rm{Cal(10)}} $ for certain isotopes, the trends in the α-decay half-lives of the even-even isotopic chains for$ Z = 118 $ and$ Z = 120 $ are generally consistent. We observed that when the neutron number exceeds$ N = 184 $ , the α-decay half-lives of the nuclei with$ N = 186 $ decrease significantly, by more than 1.5 orders of magnitude. This change highlights the pronounced shell effects, suggesting that$ N = 184 $ appears to be the next magic number beyond$ N = 126 $ . These results not only confirm the pivotal role of decay energy in α-decay but also provide new insights into the stability and nuclear structure of superheavy nuclei.
Figure 5. (color online) Predictions of logarithms of α-decay half-lives of even-even nuclei with Z =118 and 120 using the deformed TPA with the fitted
$ a_0 $ . The$ Q_{\alpha} $ and nuclear deformations$ \beta_2 $ ,$ \beta_4 $ , and$ \beta_6 $ are taken from the WS4 [49] and FRDM [55] models, respectively. The corresponding results of logarithms of α-decay half-lives are denoted by$ \log_{10}T_{1/2}^{\rm{Cal(9)}} $ and$ \log_{10}T_{1/2}^{\rm{Cal(10)}} $ , respectively. The black dashed lines denote the neutron number N = 184. -
This study investigates the α-decay half-lives of 195 even-even nuclei within the framework of a deformed TPA. By incorporating nuclear deformations from three models-FRDM, WS4, and DRHBc-along with a fixed diffuseness parameter in the cosh potential, the deformed TPA can reasonably reproduce the experimental α-decay half-lives. The RMSDs between the calculated and experimental α-decay half-lives are reduced from 0.515 to 0.385, 0.401, and 0.436 for the respective models, suggesting that including nuclear deformations improves the accuracy of α-decay calculations. Additionally, fitting the diffuseness parameter across various mass regions further enhances the deformed TPA's performance, lowering the RMSD values to 0.330, 0.343, and 0.363. The deformed TPA, with the fitted diffuseness parameter, is extended to predict the α-decay half-lives of even-even nuclei with Z = 118 and 120. The results suggest that N = 184 could be the next neutron magic number beyond N = 126, providing useful insights into the nuclear structure of superheavy elements.
-
This study investigates the α-decay half-lives of 195 even-even nuclei within the framework of a deformed TPA. By incorporating nuclear deformations from three models-FRDM, WS4, and DRHBc-along with a fixed diffuseness parameter in the cosh potential, the deformed TPA can reasonably reproduce the experimental α-decay half-lives. The RMSDs between the calculated and experimental α-decay half-lives are reduced from 0.515 to 0.385, 0.401, and 0.436 for the respective models, suggesting that including nuclear deformations improves the accuracy of α-decay calculations. Additionally, fitting the diffuseness parameter across various mass regions further enhances the deformed TPA's performance, lowering the RMSD values to 0.330, 0.343, and 0.363. The deformed TPA, with the fitted diffuseness parameter, is extended to predict the α-decay half-lives of even-even nuclei with Z = 118 and 120. The results suggest that N = 184 could be the next neutron magic number beyond N = 126, providing useful insights into the nuclear structure of superheavy elements.
Investigation of the α-decay half-lives for even-even nuclei within a deformed two-potential approach
- Received Date: 2025-06-26
- Available Online: 2025-12-15
Abstract: In this study, we systematically investigate the α-decay half-lives of 195 even-even nuclei using a deformed two-potential approach (TPA). The cosh potential with fixed diffuseness parameter is adopted as the nuclear potential, for which deformation parameters are taken from the FRDM, WS4, and DRHBc models. The root mean square deviation (RMSD) decreases from 0.515 to 0.385, 0.401, and 0.436, respectively, indicating that incorporating nuclear deformations enables the deformed TPA to accurately reproduce experimental α-decay half-lives. Furthermore, by fitting the diffuseness parameter across various mass regions, the RMSD is further reduced, from 0.385 to 0.330, 0.401 to 0.343, and 0.436 to 0.363. Additionally, the deformed TPA, combined with the fitted diffuseness parameter, is extended to predict the α-decay half-lives of even-even nuclei with Z = 118 and 120. The results suggest that N = 184 may be the next neutron magic number, following N = 126.


 DownLoad: