


 Abstract
 HTML
HTML Reference
 Related
 PDF
PDF


-
Since the Whipple Cherenkov telescope experiment detected TeV gamma rays from the Crab Nebula in 1989 [1], the Imaging Atmospheric Cherenkov Telescope (IACT) technology has been successfully applied to ground-based gamma-ray astronomy. Over the past 30 years, the detector technology in this field has developed significantly. The experiments such as VERITAS [2], MAGIC [3] and H.E.S.S. [4], have obtained significant observational results in the TeV energy range, discovering more than 200 cosmic ray sources both within and beyond the Galaxy. These vibrant observational results have also driven the development of theoretical models for the acceleration and propagation of cosmic rays.
At higher energies, the Large High Altitude Air Shower Observatory (LHAASO), located in Daocheng, Sichuan, discovered 12 gamma-ray sources exceeding 100 TeV in 2020 [5] and published its first catalog in 2024, reporting 43 ultra-high-energy gamma-ray sources with energies above 100 TeV [6]. Notably, LHAASO has also detected multiple photons with energies greater than 1 PeV, setting a new record for the highest-energy photons observed by humans and posing a significant challenge to traditional cosmic-ray acceleration models [7]. The sizes of most sources detected by LHAASO are larger than 0.5°. For example, the three brightest sources, LHAASO J1825-1326, LHAASO J1908+0621, and LHAASO J2226+6057, have extensions of more than 1° in the 100 TeV energy range. Within such regions, there are usually multiple TeV candidate sources. For instance, in the vicinity of LHAASO J1908+0621, there are two bright pulsars and a supernova remnant. However, with an angular resolution greater than 0.25°, LHAASO is unable to clearly distinguish the contributions of individual sources to gamma-ray flux, and thus cannot reveal the acceleration mechanism of these sources. Therefore, although ultra-high sensitivity and strong surveying capabilities of LHAASO provide a guarantee for the search of 100 TeV gamma-ray sources, its limited angular resolution means it cannot precisely resolve the spatial structure and morphology of sources, making it difficult to identify PeVatron sources. Furthermore, the detailed morphologies of gamma-rays sources can also provide direct information on the propagation and injection of relativistic particles [8].
Currently, the IACTs that are in operation internationally have higher spatial resolution, but their original design targets were optimized for detecting gamma rays in the TeV energy range. Beyond 100 TeV, due to the significant decrease in gamma-ray flux, their sensitivity has become too low to detect these sources. The proposed Cherenkov Telescope Array Observatory (CTAO) consists of two sites: CTA-South and CTA-North. The CTA-North site, which shares overlapping sky coverage with LHAASO, is planned to be equipped only with Large-Sized Telescopes (LSTs) and Medium-Sized Telescopes (MSTs), with no Small-Sized Telescopes (SSTs) included. Whilst it can detect gamma rays with energies > 100 TeV, it is optimised for the energy range from 20 GeV to 5 TeV. And it lacks synergistic observational capability with LHAASO at energies above 10 TeV [9, 10]. Therefore it is crucial to develop a new large-array imaging atmospheric Cherenkov telescope to improve the detection sensitivity in the 100 TeV energy range. The Large Array of imaging atmospheric Cherenkov Telescopes (LACT), consisting of 32 Cherenkov telescopes with an aperture of 6.4 m, is under construction. It will be built on the site of LHAASO, covering the entire array. The combination of LACT and LHAASO will enable a powerful synergy between high-sensitivity wide-field surveys and high-precision deep observations of gamma-ray sources [11]. With its large effective area, high angular resolution, and a wide field of view (FOV) of up to 8°, the primary scientific objective of LACT is to enable precise observations of source fine structure and to conduct high-precision energy spectrum measurements of ultra-high-energy gamma-ray sources observed by LHAASO and other experiments, thereby advancing our understanding of the physical nature of cosmic-ray acceleration.
Different layouts of the 32 LACT telescopes will significantly affect on the experimental performance, such as effective area and angular resolution. To achieve the optimized performance that fulfills the physics requirements within a fixed experimental cost, detailed optimization of the telescope design and layout is necessary. Based on the optimization, combined with site surveys at the observation location, the final configuration is determined. The experimental performance under different observation modes and conditions is then given based on this configuration.
Compared to the ground-based array LHAASO, which is capable of all-weather observations, LACT can only observe gamma-ray sources during nighttime, resulting in significant limitations on its effective observation time and the number of observable sources. To maximize the scientific return from LACT's limited observing time, a systematic evaluation of candidate sources and a detailed, feasible observation plan are required. We calculated the trajectories of gamma-ray sources within the LACT field of view (FOV) during dark hours and, using measurements from LHAASO and other experiments, estimated the expected signal event rates for each source. This allowed us to select a set of promising targets with relatively strong expected signals. Due to LACT's narrow FOV and its restriction to nighttime observations, when candidate sources concentrated in right ascension–such as those toward the Galactic center or anti-center–exhibit considerable overlap in their visible time windows within the LACT FOV. Therefore, it is essential to comprehensively consider both the expected signal significance and the physical relevance of each source in order to scientifically arrange LACT's observation schedule and target priorities.
In this paper, Section 2 introduces the design of the telescopes and the overall experiment setup, and provides a detailed description of the generation of simulation data as well as the selection of events. Section 3 discusses the simulation-based optimization of the experimental layout, which guides the on-site surveys. Candidate layout schemes derived from the actual site surveys are evaluated through comparative studies, and the final optimized layout is presented. The experimental performance based on this optimized layout is then studied in detail. Section 4 describes the procedure of calculating the observation time and presents the expected of gamma-ray event rates from LACT observations. Based on this, a brief discussion of the observation plan for LACT's gamma-ray sources is presented. The final section provides a summary and discussion.
-
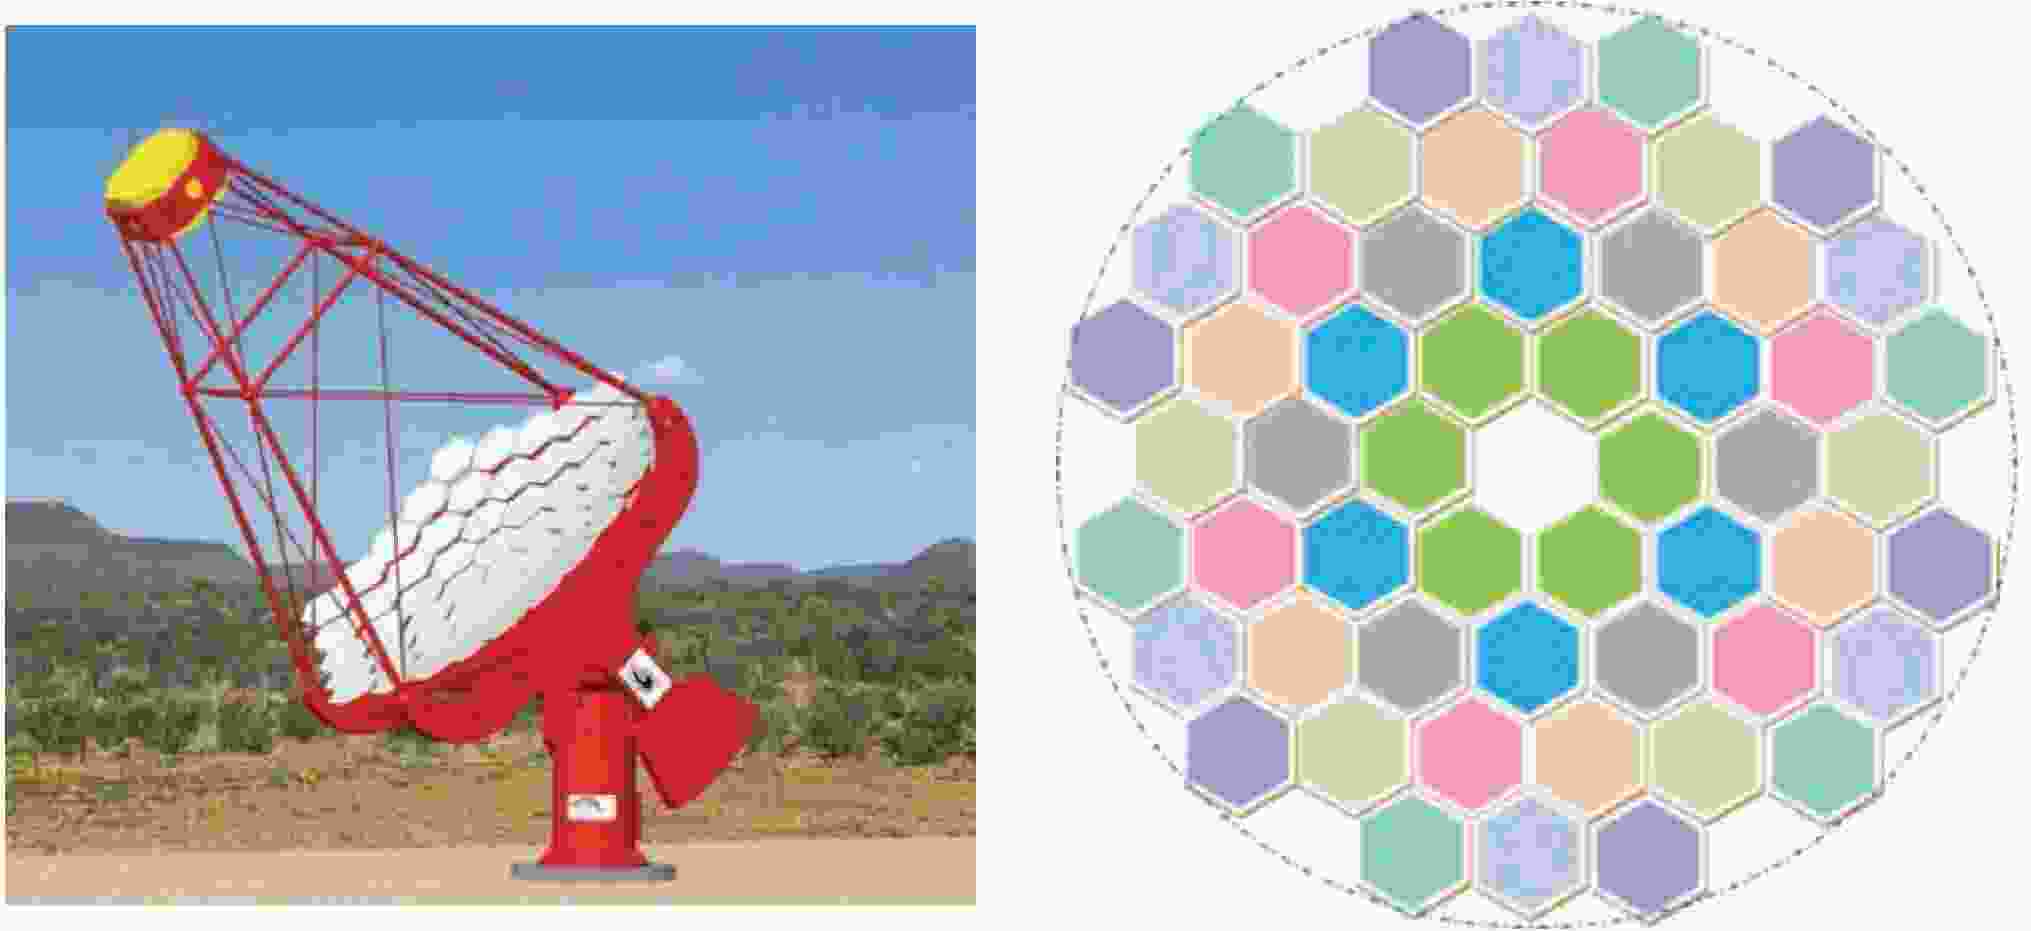
The LACT will be constructed within the LHAASO array (location: 29°21′27.6′′N, 100°8′19.6′′E, altitude 4410 m) to jointly observe ultra-high-energy gamma-ray sources with LHAASO. The design of the telescope is shown in the left panel of Figure 1. The reflector follows a Davies–Cotton design, with an overall diameter of approximately 6 m and a focal length of 8 m. It consists of 54 hexagonal sub-mirrors, each having a curvature radius of 16 m and a side-to-side length of 0.8 m (right panel of Figure 1). The camera consists of 1616 silicon photomultipliers (SiPMs), with each SiPM pixel having a size of approximately 0.19°, forming a total FOV of approximately 8°. For further details on the telescope design, please refer to [12, 13].
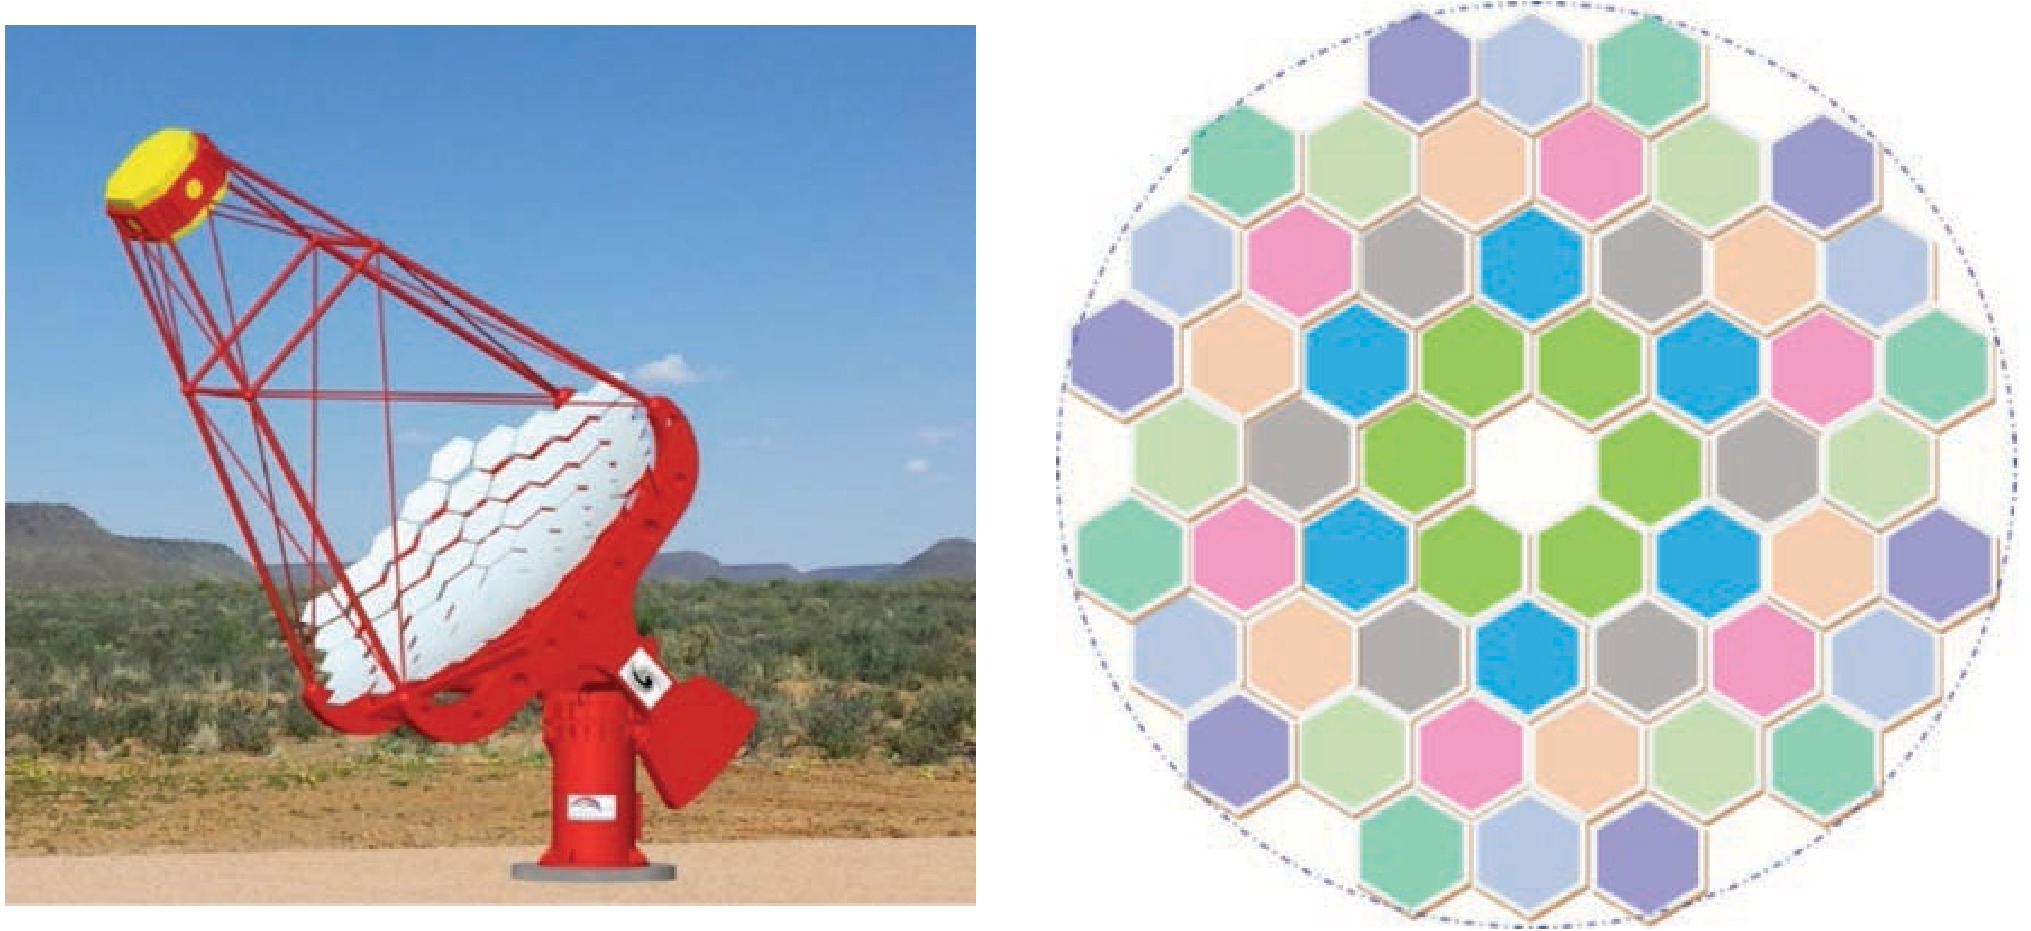
Figure 1. (color online) Design of the LACT telescope (left), layout of the reflective mirror segments (right).
As shown in Figure 2, at the 4410 m observation level, showers with small zenith angles have a steep lateral distribution of Cherenkov photons, which favors the observation configuration with small telescope spacing. However, for showers with large zenith angles, the longer path they travel through the atmosphere provides sufficient atmospheric depth for shower development. As a result, the lateral distribution of Cherenkov light is extended. Additionally, their light "pools" are elongated and cover a wide area, which is best matched by configurations with larger telescope spacing. Moreover, for observations at energies below several TeV, the intensity of Cherenkov photons produced by gamma rays is relatively weak, requiring smaller telescope distances. In the low-energy region, the gamma-ray flux is higher, and sufficient statistics can be accumulated in a shorter observation time. As the energy increases, the intensity of Cherenkov photons produced by gamma rays becomes stronger, and multiple telescopes can be triggered even when the telescope spacing is larger. However, as the energy continues to rise, the gamma-ray flux drops sharply. At this point, a larger effective area and longer observation time are needed to obtain sufficient statistical events. Therefore, LACT observations will be conducted in two modes. The layout of the telescope array differs between the two modes: in Mode 1, all 32 telescopes are operated as a single array, whereas in Mode 2, the array is divided into four separate sub-arrays, each comprising eight telescopes. Importantly,Mode 1 has closer telescope spacings than Mode 2. Mode 1 targets sources with small zenith angles and energies above 400 GeV. In this mode, all 32 telescopes track a single source simultaneously. Mode 2 focuses on sources at large zenith angles and energies above several TeV. In this time, each sub-array tracks an individual source, enabling the simultaneous observation of four different sources, although each source will accumulate exposure over timescales on the order of years. In the optimization of the telescope array layout, both observation modes will be studied separately.
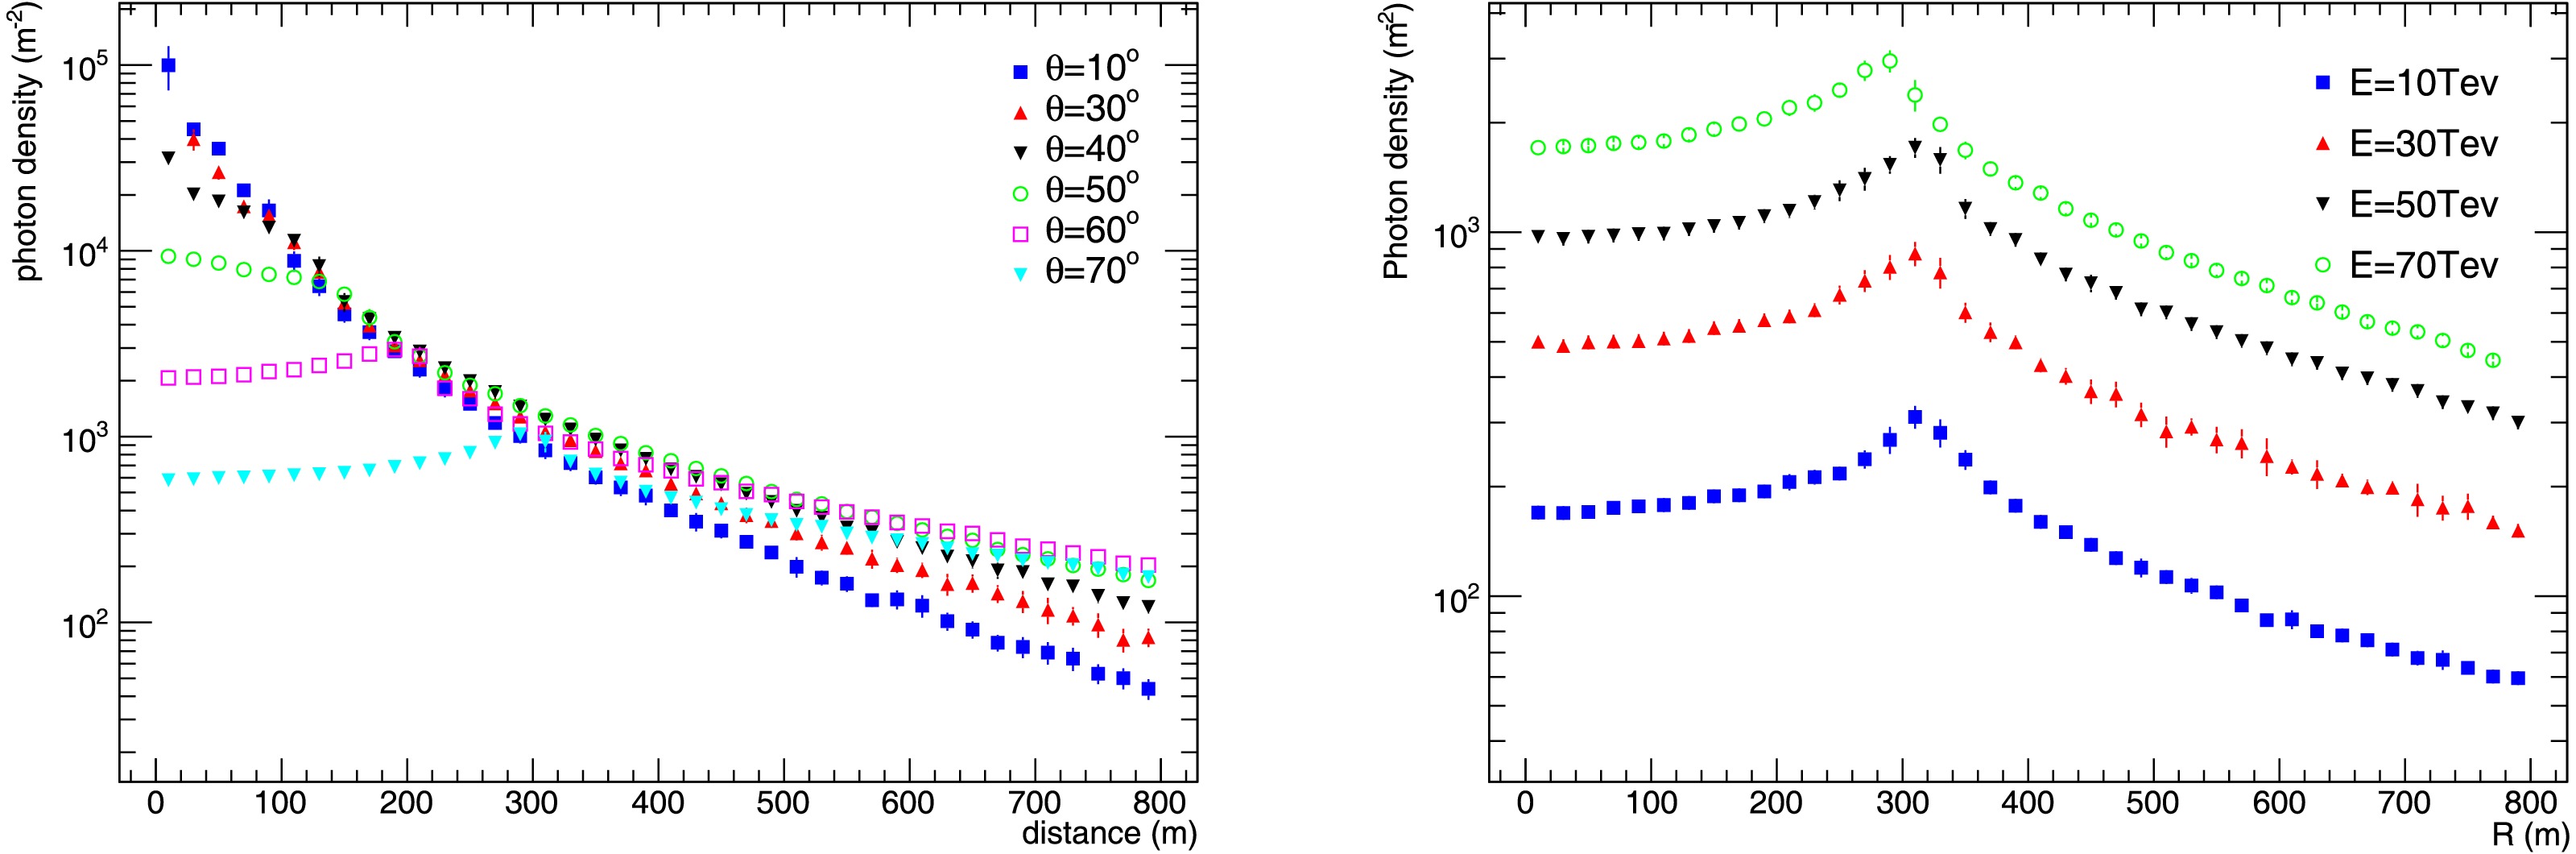
Figure 2. (color online) The lateral distribution of Cherenkov photons produced by gamma-ray showers with different zenith angles at an altitude of 4410 m and an energy of 30 TeV (left), and the lateral distribution of Cherenkov photons produced by gamma-ray showers with different energies at a zenith angle of 70°(right).
-
The Monte Carlo simulation is mainly divided into two stages. First, the atmospheric showers are simulated and Cherenkov photons are generated within these showers. Subsequently, the photon information is input into the detector simulation program, where the propagation of the photons is tracked and the detection response of the detector to the photons is simulated.
-
The simulation of Cherenkov light in air showers is performed using the CORSIKA software (version 7.7410) [14]. The energies of gamma rays range from 400 GeV to 400 TeV. To avoid poor statistics at high energies, events are generated separately in three energy bands: 400 GeV–4 TeV, 4 TeV–40 TeV, and 40 TeV–400 TeV, with a power-law spectral index of −2. To study the performance of the telescope at different observation directions, zenith angles are set at 20°, 40°, and 60°, respectively. In this work, the performance study is based on point sources. The primary particles are randomly and uniformly distributed within a circular area perpendicular to the shower direction, centered on the LHAASO array center, with a radius of 1300 m. The high-energy and low-energy hadronic interaction models used in the simulation are QGSJETII-04 and GHEISHA, respectively.
In the simulation, the positions of the telescopes for collecting Cherenkov photons are arranged according to different array layouts, generating different data samples. To avoid missing photons at the edges, the photon collection radius is set to 4 m, which is larger than the actual reflector aperture of the telescopes. In order to improve the efficiency of event generation, each primary event is resampled ten times. Using CORSIKA simulations, we obtain the direction, position, wavelength, and arrival time of all Cherenkov photons reaching the entrance aperture of each telescope at ground level, as well as the production height and key properties of the primary particles. These data are used as input for the subsequent telescope simulation to perform detector response and photon tracking simulations.
-
The detection response simulation of Cherenkov light by the telescope utilizes the
${\tt{sim\_telarray}} $ software commonly employed in ground-based imaging atmospheric Cherenkov telescope experiments [15]. The telescope is configured according to the actual parameters of LACT. During the mirror simulation process, the survival of each Cherenkov photon is assessed based on its direction, position, and wavelength, taking into account atmospheric absorption and scattering as well as mirror reflectivity. Surviving photons are then tracked to the focal plane which is positioned 8 m away from the center of the mirror. During the ray-tracing process, detailed considerations are given to photon shading by the SiPM array and its support structure, as well as the gaps between mirror segments.In the simulation of the SiPM array, the diameter of each pixel is approximately 25.8 mm. When Cherenkov photons reach the SiPM array, a photon response simulation is performed for the Winston Cone integrated in front of the SiPM [16]. Then detailed considerations are given to the photon collection efficiency, the photoelectric efficiency of the SiPM, night sky background noise (NSB), and trigger mode, among others. At the LHAASO site, the NSB value measured by the operational WFCTA is approximately 0.5 photoelectron (PE)/m2/20ns [17]. Considering the differences in mirror area and pixel acceptance between LACT and WFCTA telescopes, the NSB value used in the LACT telescope simulation is scaled to 0.15 PE/ns/pixel.
-
The event reconstruction for LACT is based on a stereoscopic approach. To ensure the reconstruction accuracy, it is necessary to select the observed images, removing those of poor quality. Only images that pass the selection (referred to as "good images") are used in the reconstruction. The following three criteria are applied:
● Cut-1: Total Number of PEs
First, noisy SiPMs are cleaned using the traditional tail-cut method [18, 19]. For signal SiPMs, their photoelectron count q should satisfy the condition
$ q \gt q_1, $ and at least one of the adjacent SiPMs should satisfy$ q \gt q_2 \quad (q_1 \gt q_2). $ After preliminary optimization, the values of$ (q_1, q_2) $ adopted in the analysis are$ (20, 10) $ . After noise suppression, the total number of photoelectrons ($ {\rm{SIZE}} $ ) in an image must exceed 200.● Cut-2: Hillas Parameters
Hillas parameters [18] play a important role in image selection. The parameters used in this analysis include the image's major axis (L), minor axis (W), SIZE (S), distance between the image center and the camera center (D), and the distance from the source direction (projected on the camera) to the major axis (MISS). The MISS parameter characterizes the reconstruction accuracy of the shower-detector-plane (SDP). Events detected by LACT generally trigger multiple telescopes, so each event corresponds to multiple images. This is especially true for higher-energy events, which can trigger telescopes at larger distances. For images with large distances, small sizes, and low aspect ratios (
$ L/W $ ), the reconstruction accuracy is poor.As an example, Figure 3 shows the two-dimensional distribution of the image parameters
$ L/W $ versus$ S/D $ for events with energies between 40 TeV and 400 TeV and a zenith angle of 40°. The left panel shows images with$ {\rm{MISS}} \ge 0.1^\circ $ , while the right panel shows images with$ {\rm{MISS}} \lt 0.1^\circ$ . Through optimization, the red lines shown in the figure are adopted as selection criteria. Images that fall in the region above and to the right of the red line are considered good-quality images, while those below and to the left are considered poor-quality images. Depending on primary parameters such as energy, zenith angle, and observation offset, the proportion of removed images varies slightly. Approximately 80% of images with$ {\rm{MISS}} \ge 0.1^\circ $ (poor-quality images) are removed, while for images with$ {\rm{MISS}} \lt 0.1^\circ $ (good-quality images), about 10% are removed. After this selection, as shown in the left panel of Figure 3, the reconstruction quality of the SDP for images from high-energy events is significantly improved, and the final direction reconstruction accuracy is also greatly enhanced. It is worth noting that after this Hillas parameter selection, the number of images used in the reconstruction per event decreases. However, the trigger efficiency is only slightly reduced. The comparison of effective areas after these two selections is shown in the right panel of Figure 4.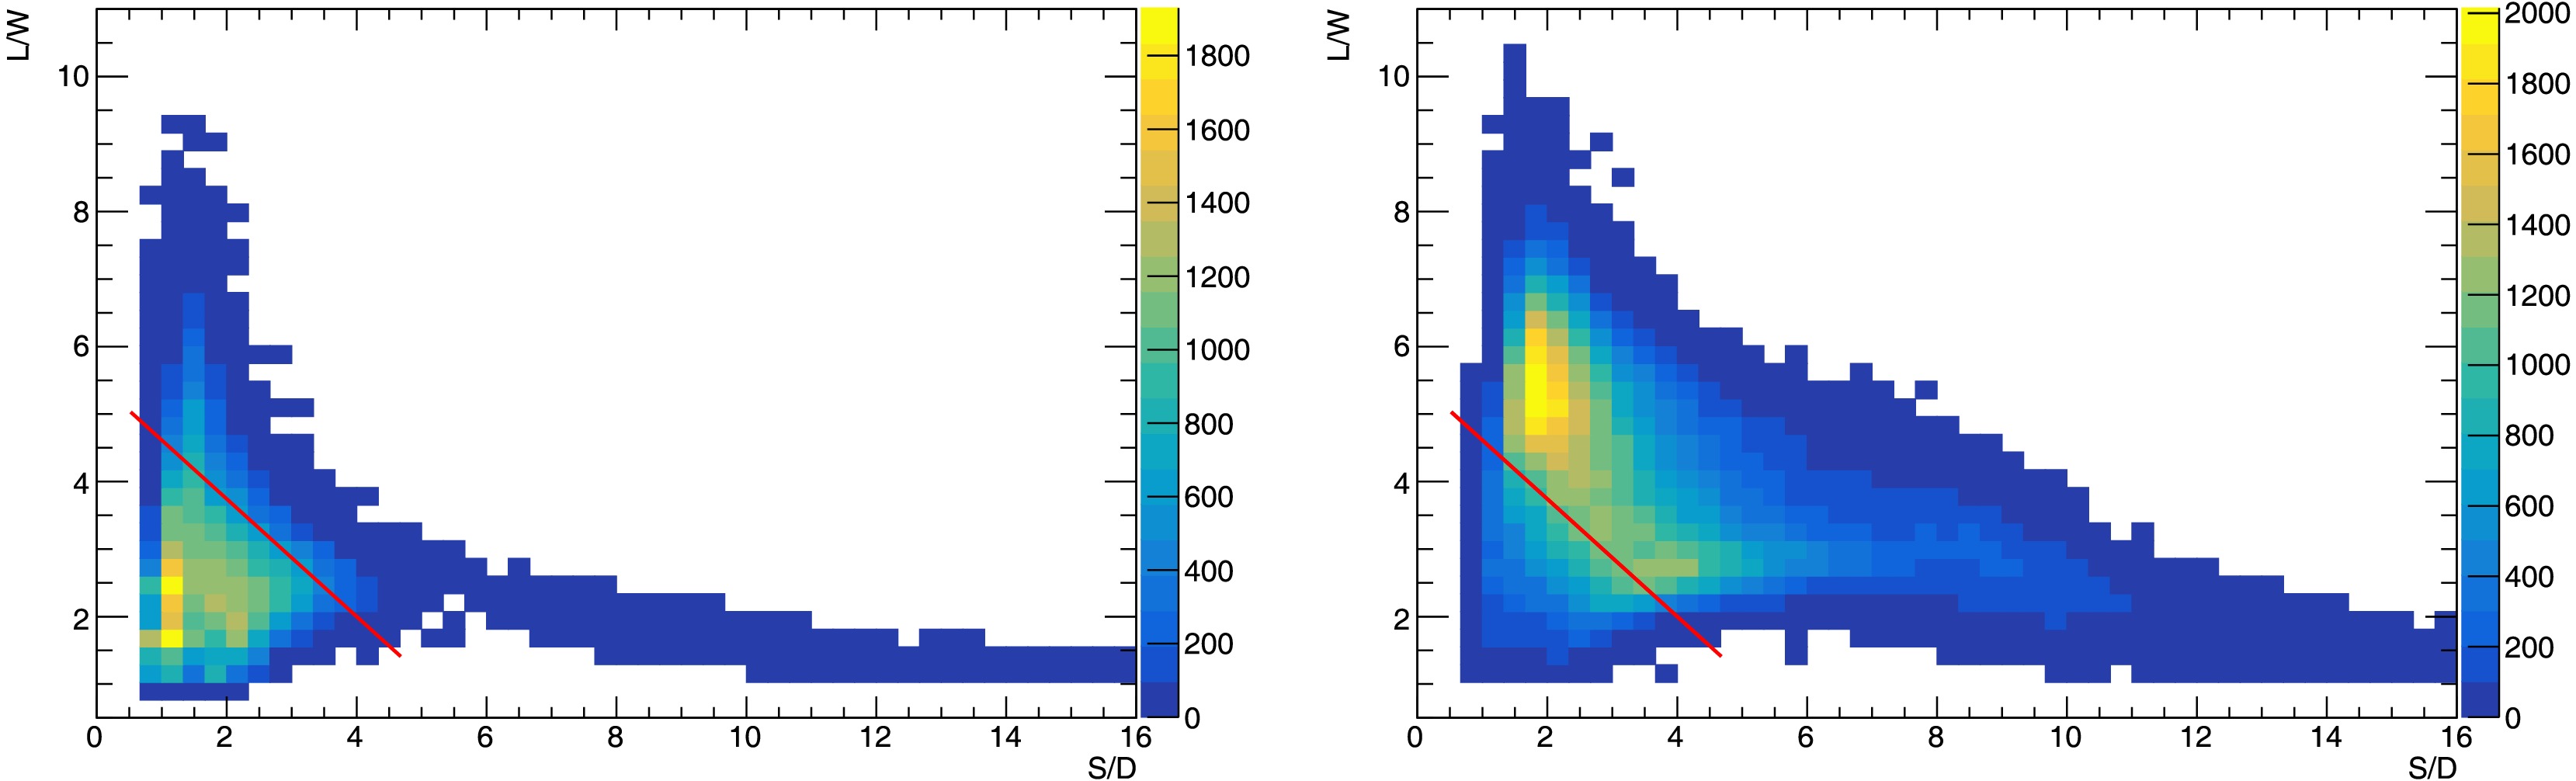
Figure 3. (color online) Distribution of the image parameter
$ L/W $ versus$ S/D $ for gamma-ray events with energies between 40 TeV and 400 TeV and a zenith angle of 40 degrees. The left panel shows images with$ MISS \ge 0.1^\circ $ , while the right panel shows images with$ MISS \lt 0.1^\circ $ .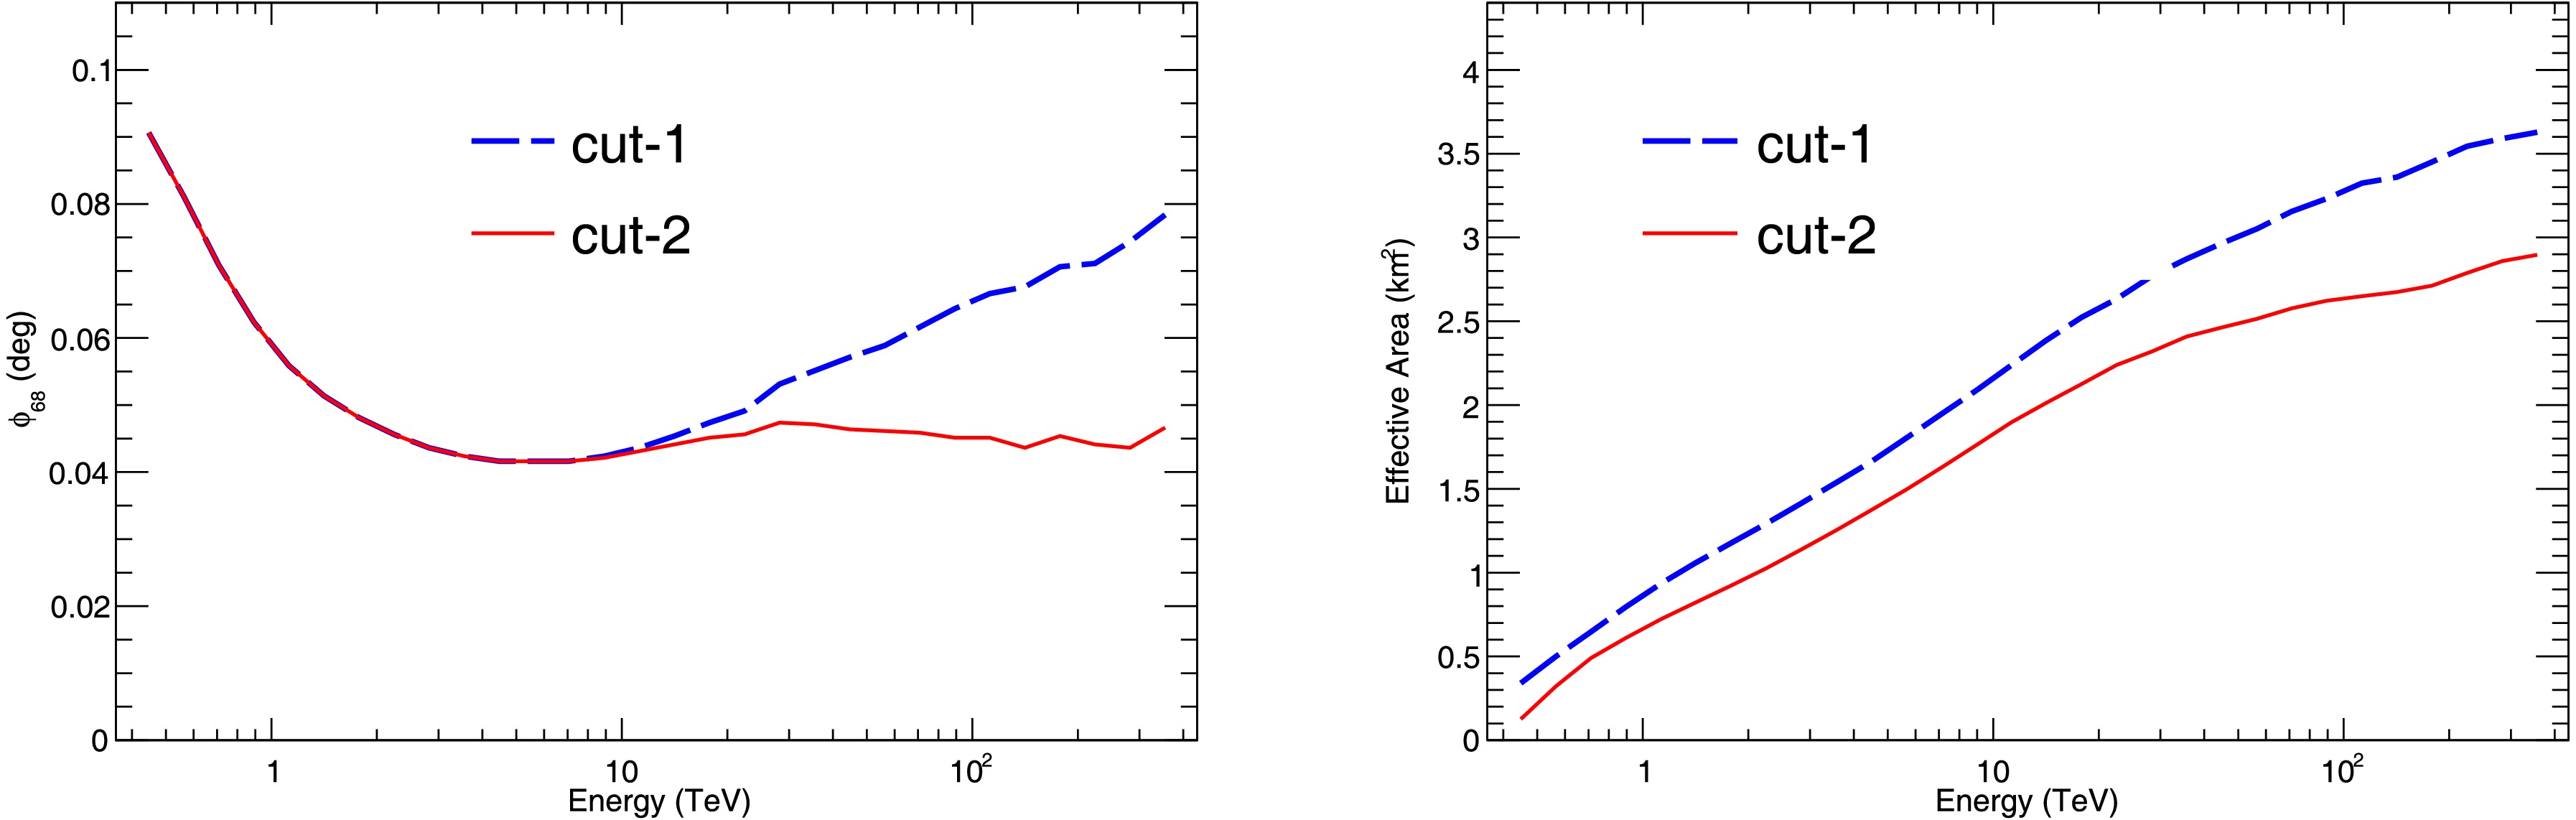
Figure 4. (color online) Angular resolution (left) and effective area (right) of gamma-ray events with a zenith angle of 40 degrees before and after Hillas parameter selection, showing the variation of angular resolution and effective area with energy.
● Cut-3: Image Leakage
For high-energy events, their impact distance to the telescope is relatively large, and many images are located near the edge of the FOV, leading to image truncation. A parameter, LEAKAGE, defined as the ratio of the number of photoelectrons in the outermost two rings of pixels to the total number of photoelectrons, is used for selection. The leakage cut is primarily applied in energy reconstruction.
$ {\rm{LEAKAGE}} \gt 0.15 $ is set as the optimal selection criterion, which removes most of the images with significant leakage.Among the image selection criteria mentioned above, Cut-1 is a primary criterion while Cut-2 and Cut-3 are applied to different parameter reconstructions, respectively. Cut-2 removes images with weak signals and is primarily used for geometric reconstruction, whereas Cut-3 removes images with significant leakage, mainly for energy reconstruction. In the reconstruction, a two-step sequential selection is applied to ensure both geometric and energy accuracy while maintaining a large effective area.
Geometric reconstruction requires multiple good-quality images per event, where “good-quality images” are defined as those passing Cut-2. The number of such images per event (
$ N_g^{{\rm{geom}}} $ ) affects angular resolution: a higher$ N_g^{{\rm{geom}}} $ yields better resolution but reduces effective area. To balance these factors, we set different thresholds depending on the observation mode:$ N_g^{{\rm{geom}}} \geq 3 $ in Mode 1 (prioritizing angular resolution) and$ N_g^{{\rm{geom}}} \geq 2 $ in Mode 2 (balancing resolution with effective area).After geometric information is reconstructed, energy reconstruction follows next. Its main challenge is image leakage—images near the camera edge suffer from incomplete energy deposition, degrading accuracy. Critically, images used for energy reconstruction are a subset of those already selected in the geometric step. To mitigate leakage, we compare two approaches, as demonstrated in Figure 5. The most direct method is to geometrically exclude images whose centers are located near the edge of the camera (e.g., by setting the condition
$ D \gt 3^\circ $ , labeled as Cut-4). Although this condition improves energy resolution, it significantly reduces the effective area at high energies (see right panel of Figure 5). As an alternative to Cut-4, we apply Cut-3 to select higher-quality images from the geometric-quality set (i.e., images that have already passed Cut-2). For energy reconstruction using this approach, we require only$ N_g^{{\rm{ener}}} \geq 1 $ —meaning that at least one of the images already used for geometry must also satisfy Cut-3.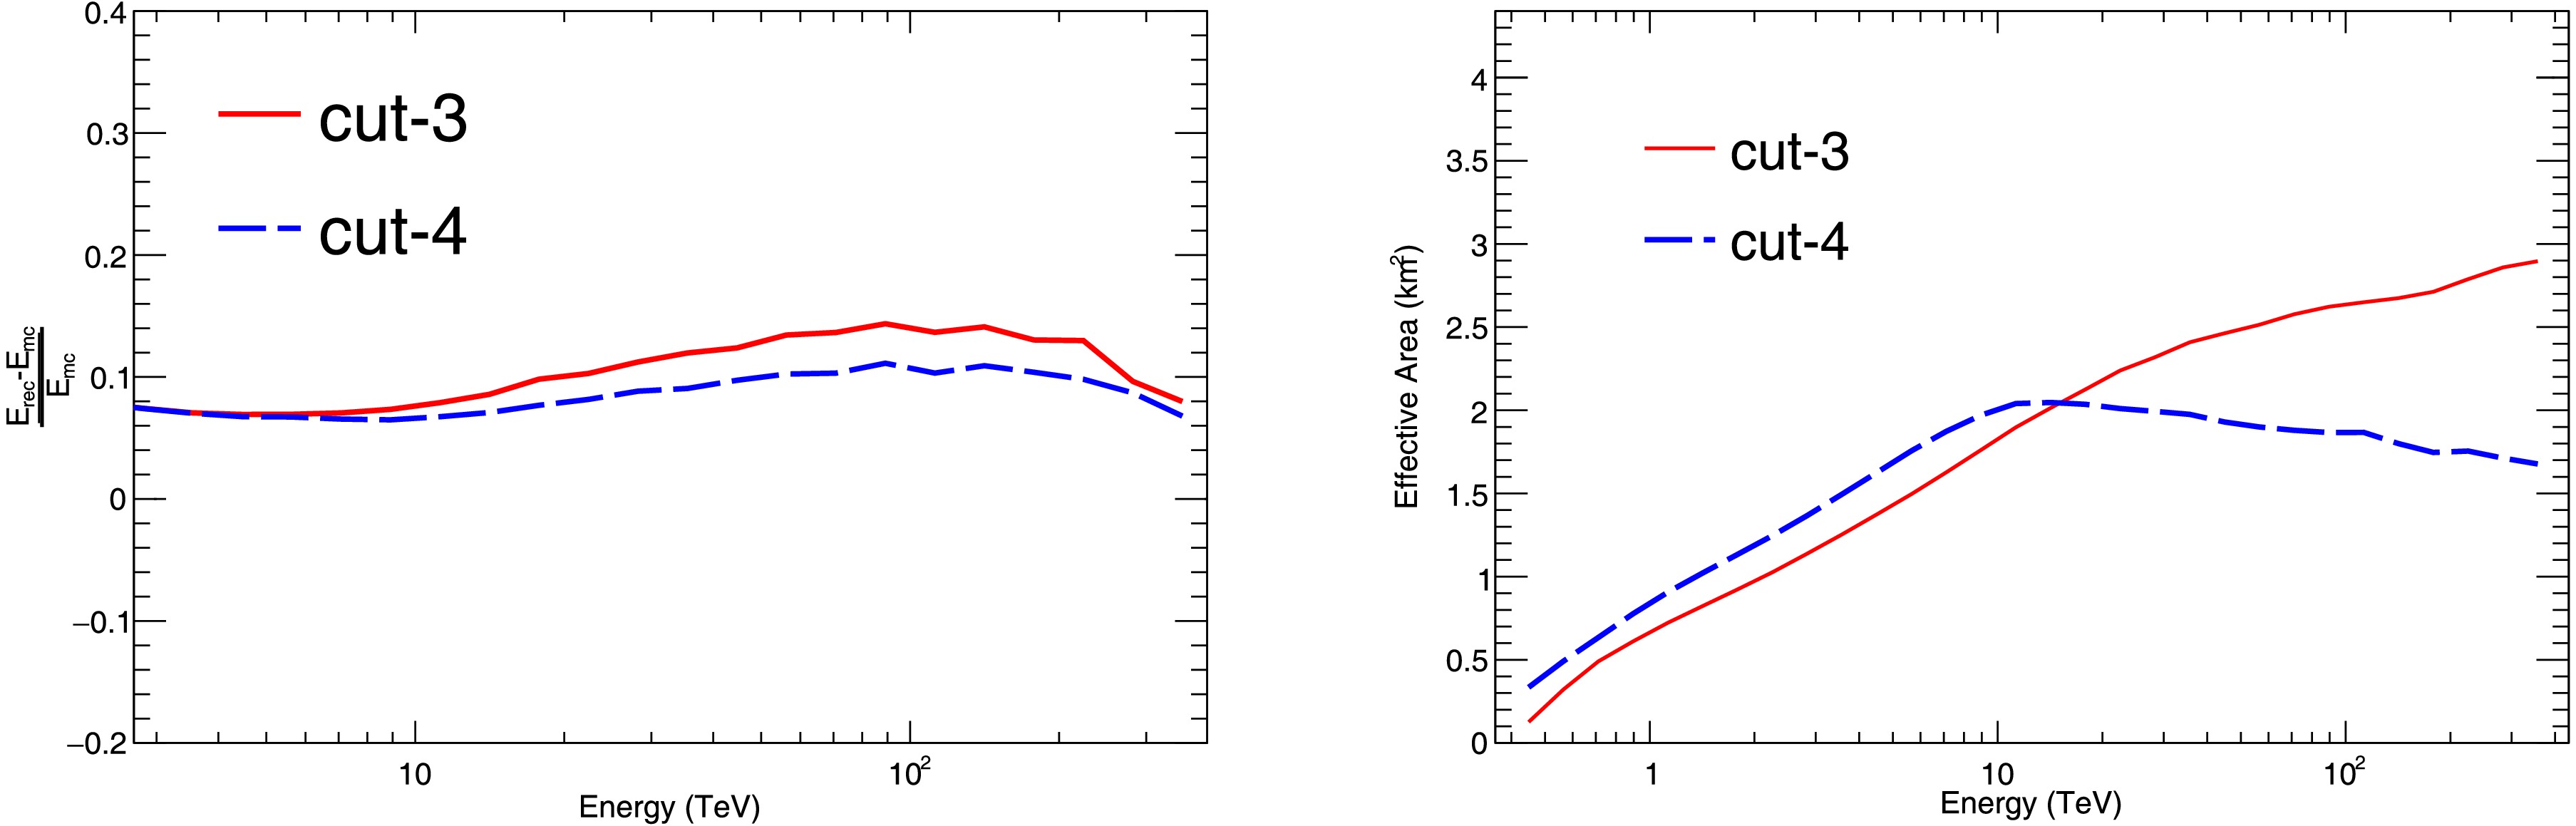
Figure 5. (color online) Energy resolution (left) and effective area (right) of gamma-ray events with a zenith angle of 40° under different image selection criteria.
Thus, the two-stage strategy links the selections: geometry sets the baseline image sample by requiring multiple Cut-2 images (
$ N_g^{{\rm{geom}}} \geq 2 $ or 3), and energy further refines it by applying Cut-3 to at least one image ($ N_g^{{\rm{ener}}} \geq 1 $ ), maintaining effective area without compromising energy resolution. -
The direction reconstruction of air showers employs the traditional Hillas parameter method. After selecting good-quality images, pairs of these images are combined. The intersection point of the major axes of the two images in each pair is taken as the direction of the air shower. Since LACT events typically involve more than two telescopes in the reconstruction, several reconstructed directions are obtained. These directions are then weighted and averaged to obtain the final event direction, using weights based on factors such as the reduced size of the image pair (defined for individual image signal sizes
$ S_i $ and$ S_j $ as$ S_{{\rm{red}}} = S_i S_j / (S_i + S_j) $ ), the ratio of the major axis to the minor axis of the images, and the angle between the major axes of the two images. Once the direction is reconstructed, the core position of the event and the distance$ R_p $ from the event to each detector can be determined based on the geometric positions of the telescopes.The energy reconstruction of events uses a lookup table method. The table includes four-dimensional parameters: energy, total number of photoelectrons in the image, distance between the telescope and the shower axis, and the zenith angle. The table is established using simulated gamma-ray event samples, and both the table construction and the images used in energy reconstruction are based on good-quality images that have passed the selection. If a shower event contains multiple good-quality images, the multiple energy estimates obtained from the reconstruction are weighted-averaged to determine the final energy of the event. The weight for each image is the inverse of the energy distribution width at the corresponding parameter grid point in the lookup table. The study of improved direction and energy reconstruction using alternative methods is ongoing.
-
In the design of the telescope layout, several aspects must be considered, such as the detection energy threshold, effective area, angular and energy resolutions, as well as the balance between experimental physics performance and telescope construction cost. We have studied the performance of the two observation modes under both uniform and grouped arrangements of the 32 telescopes, with particular emphasis on angular resolution and effective area, which are most sensitive to the layout. Through simulation studies, a theoretically optimized layout is obtained. Based on this, an on-site survey is conducted, and the candidate positions provided by the survey are compared in detail to determine the final optimized layout. Finally, using this optimized layout, the experimental performance of LACT under different observation angles in the two observation modes is evaluated.
-
The effective area of the telescope array is directly related to the sensitivity of the experiment. The main scientific goal of LACT is the deep observation of ultra-high-energy gamma-ray sources. The flux of gamma rays in the ultra-high-energy range decreases significantly. To detect sufficient photons required for spe ctral and morphological analysis, a large effective area is needed. The effective area of a single Cherenkov telescope is roughly the projected area of the Cherenkov light cone from an air shower (on the order of 105 m2). The most direct way to significantly increase the effective area is to use multiple telescopes to cover as large an area as possible. On the other hand, angular resolution is also a key parameter that determines the sensitivity of the experiment. The angular resolution of a Cherenkov telescope array is roughly determined by the number of telescopes triggered by an air shower event.
Generally, the more telescopes triggered by an event, the more precise the direction reconstruction using the stereoscopic method. Therefore, the telescope arrangement cannot be too sparse. Considering both aspects, one possible layout is to place a large number of telescopes uniformly covering the entire LHAASO site with appropriate spacing. However, this would require a considerable number of telescopes. In other words, given a fixed number of telescopes, the distance between them needs to be increased to cover the full LHAASO array.
Another option is to form relatively dense sub-arrays, each comprising multiple telescopes. The spacing between telescopes within a sub-array can be relatively small, while the spacing between sub-arrays can be larger. This approach balances the need for good angular resolution provided by the sub-arrays and the large effective area provided by the full array. Thus, we have explored two layout schemes: uniform layout and grouped layout. In the uniform layout (the left panel of Figure 6), different telescope spacings are considered. In the grouped layout, different group configurations are studied while keeping the intra-group telescope spacing fixed (middle and right panels of Figure 6). The distance parameters for both observation modes are listed in Table 1.

Figure 6. (color online) Schematic diagrams of the arrangement of telescopes in the LACT uniform distribution (left) and grouped distributions (Group-1 (middle) and Group-2 (right)) layouts. Note that the layout shown in the left panel corresponds to Uniform-2. Uniform-1 follows the same arrangement but with a reduced spacing between the telescopes.
Uniform-1 Uniform-2 Group-1 Group-2 Mode 1 150 175 140 140 Mode 2 320 372 360 362 Table 1. Average distances between telescopes in different observation modes within the array layout. Note that the spacing listed for Mode 1 of group-1 and group-2 refer to the average spacing between telescopes within each group, while all other values represent the average spacing across the entire array. (Unit: m)
Figure 7 shows the distribution of effective areas as a function of the energy for the four layouts. It can be seen that in Mode 1 (left panel), the effective area of the grouped layout is generally larger than that of the uniform layout. The effective area of Group-1 is the largest, while that of Uniform-1 is the smallest. The difference increases with energy, reaching a maximum of about 20% around 100 TeV. From the right panel, it can be seen that in Mode 2 observation mode, the effective areas of the four layouts are similar. The Uniform-1 layout has the smallest average telescope spacing and thus the smallest effective area.
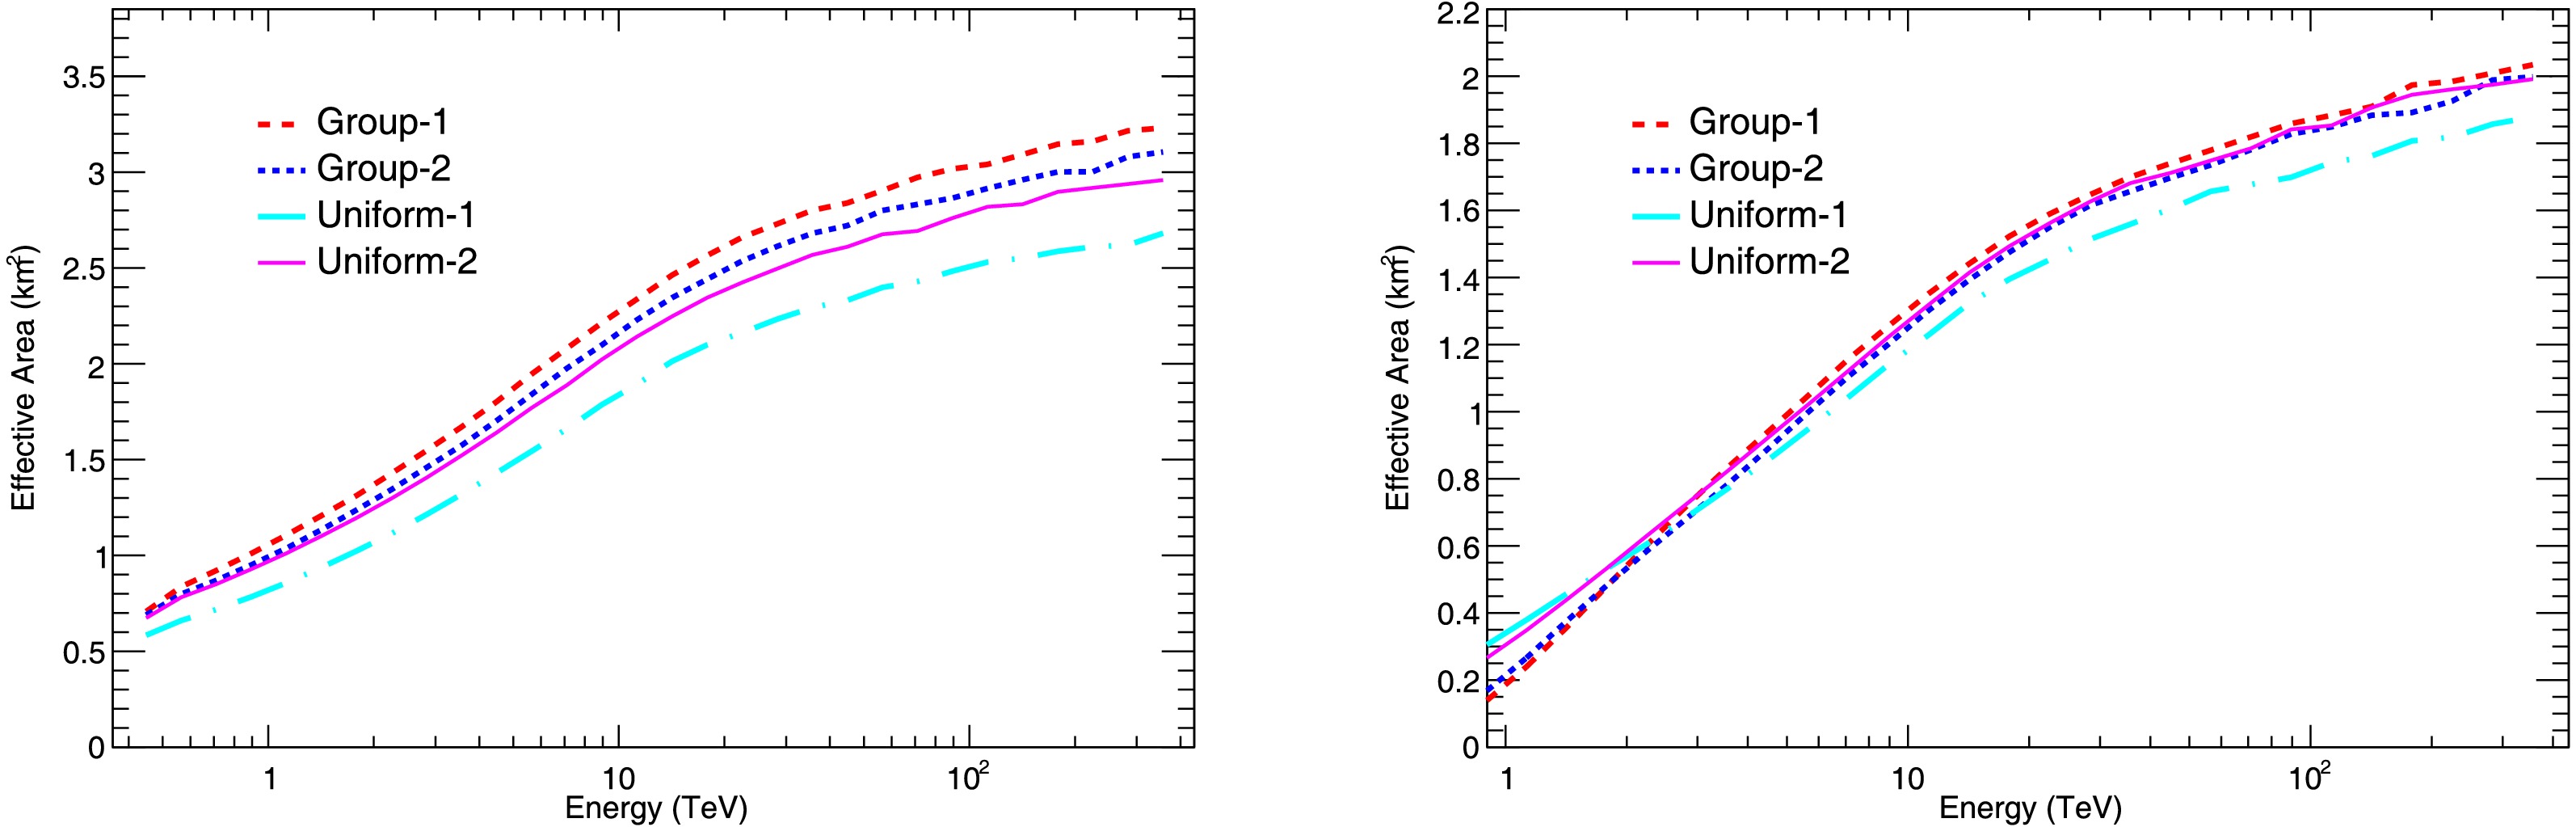
Figure 7. (color online) The effective area of uniform and grouped layouts, for the shower zenith angle of 40°, under Mode 1 (left) and Mode 2 (right) observation modes.
The angular resolutions are shown in Figure 8, which presents the results that for Mode 1 observation mode (left panel), there is almost no difference in angular resolution among the four layouts. For energies above 2 TeV, the resolution of all four layouts is better than 0.04°. From the right panel, which shows the results for Mode 2, it can be seen that in the low-energy region below 3 TeV, the angular resolution of the uniform layout is better than that of the grouped layout. However, above 3 TeV, the situation is reversed, with the grouped layout achieving an angular resolution of about 0.04°, compared to approximately 0.06° for the uniform layout. Since the energy threshold –typically defined as the peak energy in the reconstructed event energy distribution under a given assumed spectral model, for Mode-2 is approximately 3 TeV, the grouped layout has better angular resolution than the uniform layout in the energy range above the detection threshold.
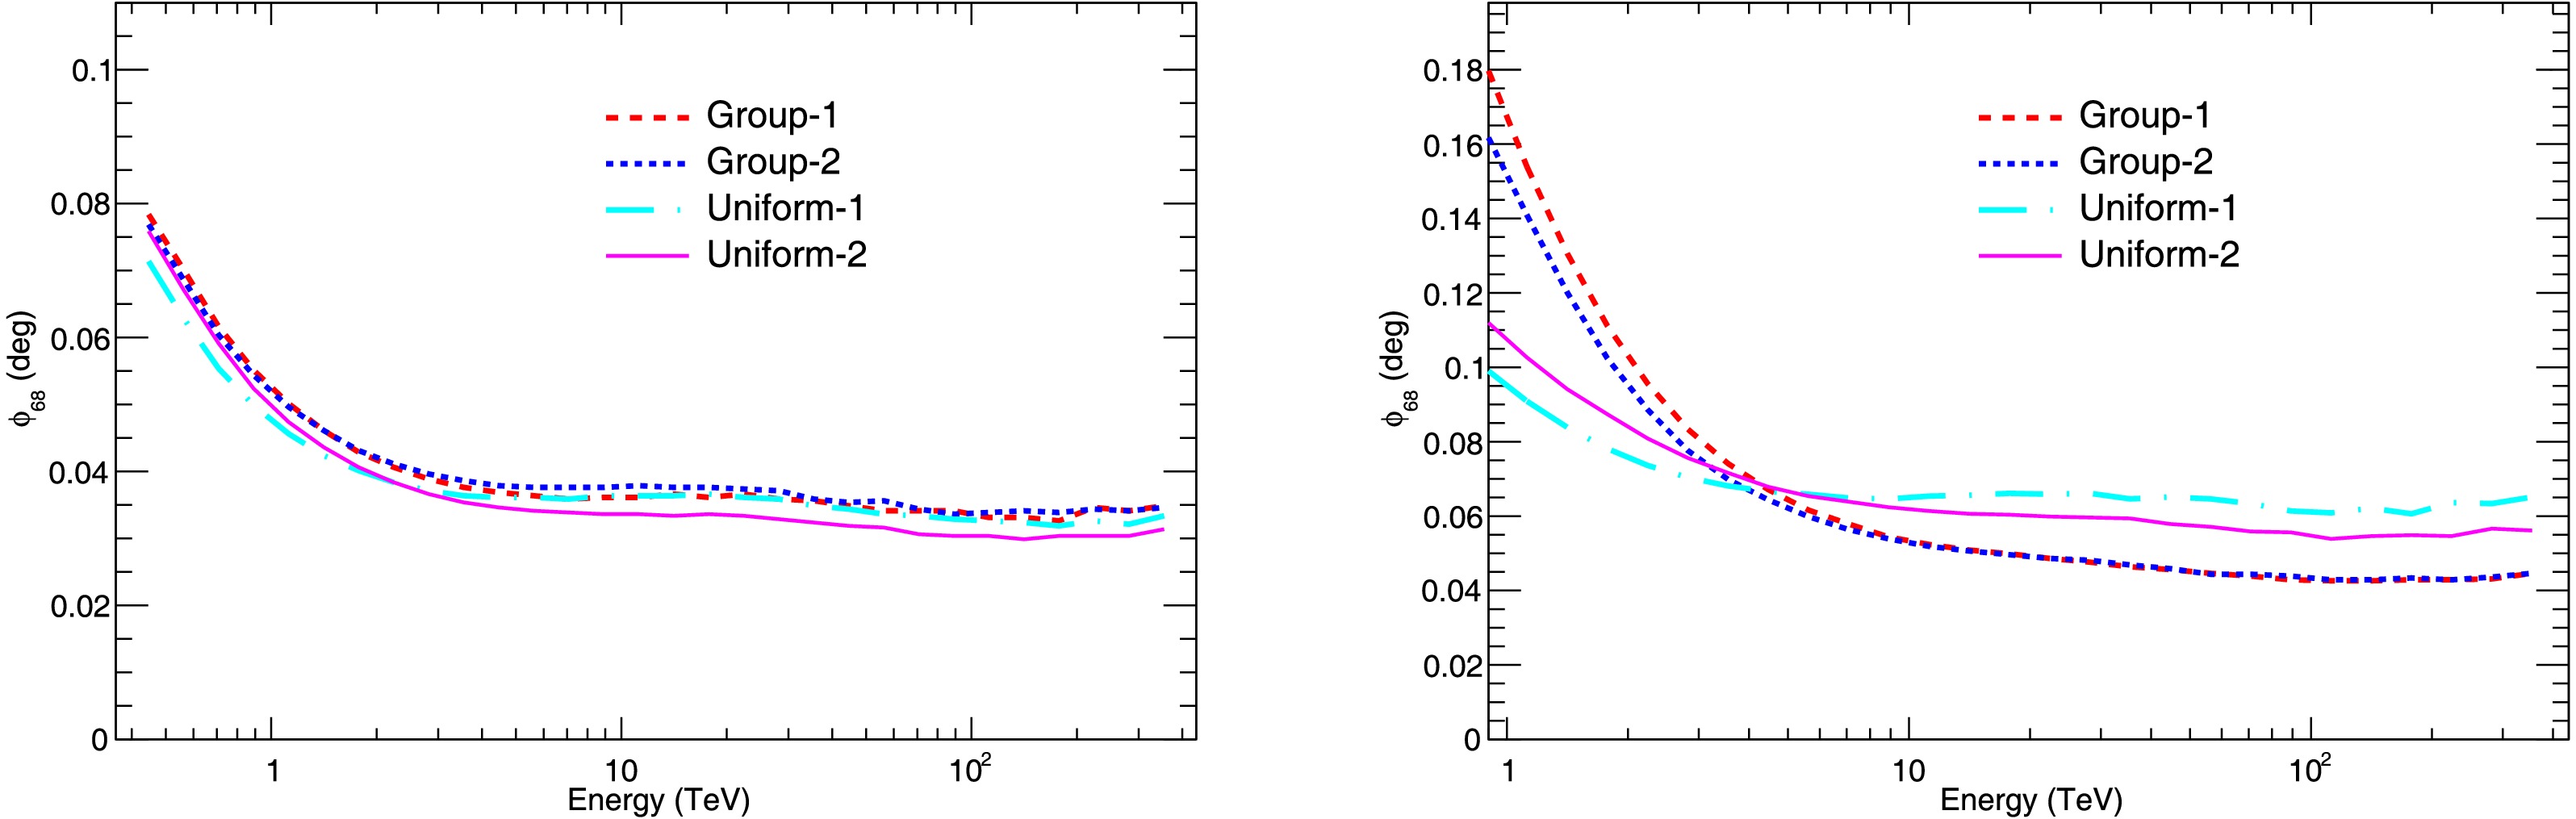
Figure 8. (color online) The angular resolution of uniform and grouped layouts, for the shower zenith angle of 40°, under Mode 1 (left) and Mode 2 (right) observation modes.
In summary, the angular resolution and effective area performance of the grouped layout are superior to those of the uniform distribution in both observation modes. In the grouped layout, each group consists of four telescopes arranged in a square, with an inter-telescope spacing of about 140 m within each group. Combining this with previous research on ideal layout optimization in Mode-1, the telescope spacing has only a very slight influence on performance and can vary between 120 m and 160 m [20].
To investigate the impact of inter-group distance variations on performance, we increased the telescope spacing in the Group-1 layout to 160 m and the group distance to 450 m, generating two data samples with zenith angles of 40° and 60°, respectively. The results show that in terms of angular resolution, the large-distance layout performs worse than the small-distance layout below approximately 10 TeV, while above 10 TeV, the difference is minimal. Regarding effective area, the large-distance layout exhibits a larger effective area across all energy ranges, nearly 40% higher in the low-energy region. This difference decreases as energy increases, with about a 15% advantage remaining at the highest energy levels.
-
LACT will perform hybrid observations of gamma-ray sources together with LHAASO. In data analysis, the combination of Cherenkov images observed by LACT and muon information measured by LHAASO will be used to enhance gamma/hadron discrimination, thereby achieving strong background rejection and precise measurement of gamma-ray sources. Based on the results of the array layout simulation study in Section 3.1, and considering the actual topography of the LHAASO site as well as the layout of existing detectors, an on-site survey was conducted. The site already hosts LHAASO's Electron Detector (ED) and Muon Detector (MD), and there are terrain features such as rivers and hollows that are unsuitable for telescope placement.
Additionally, considering factors such as the transportation and installation of telescopes, the placement locations should be as close as possible to the main roads of the site. Therefore, the candidate positions for each group of telescopes were slightly adjusted based on the square arrangement. Moreover, in the Mode 2 observation mode of LACT, 32 telescopes are divided into four sub-arrays to track different sources. Telescopes at the same vertex position in each quadrilateral are assigned to the same sub-array. To ensure that the performance of each sub-array is comparable, the quadrilaterals are required to be nearly parallel in orientation. Taking all these factors into account, three candidate LACT layouts, named Layout-1, Layout-2, and Layout-3, were proposed after the site survey, as shown in Figure 9. In Layout-1 and Layout-2, the upper-right six groups are identical, with only the lower-left two groups differing. Layout-3 has larger inter-telescope distances within each group and larger spacings between groups compared to the first two layouts. To compare their performance, simulated data samples with a zenith angle of 40° were generated, and the performance under both Mode 1 and Mode 2 was evaluated for each sample.

Figure 9. (color online) The candidate telescope layout schemes used: Layout-1(left), Layout-2 (middle) and Layout-3 (right), at the LHAASO site based on actual survey.
From the comparison of angular resolution in Figure 10, it can be seen that under the Mode 1, the angular resolution performance of the three layouts is comparable. Under the Mode 2, for energy regions below 3 TeV, the angular resolution of Layout-1 and Layout-3 is similar, while Layout-2 is slightly worse than the other two layouts. For energies above 3 TeV, the angular resolution of the three layouts is almost the same. The comparison of effective area distribution in Figure 11 shows that in both observation modes, Layout-3 has the largest effective area, followed by Layout-2, while Layout-1 has the smallest effective area. Compared with the Mode 2, the differences in effective area under the Mode 1 are more significant, with the maximum difference being about 16%, compared to about 9% for Mode 2. In summary, the three actual surveyed layouts have comparable angular resolution performance. In terms of effective area, Layout-3, with its slightly larger telescope spacing and broader coverage, provides a larger effective area than the other two layouts. Therefore, Layout-3 is chosen as the final layout.
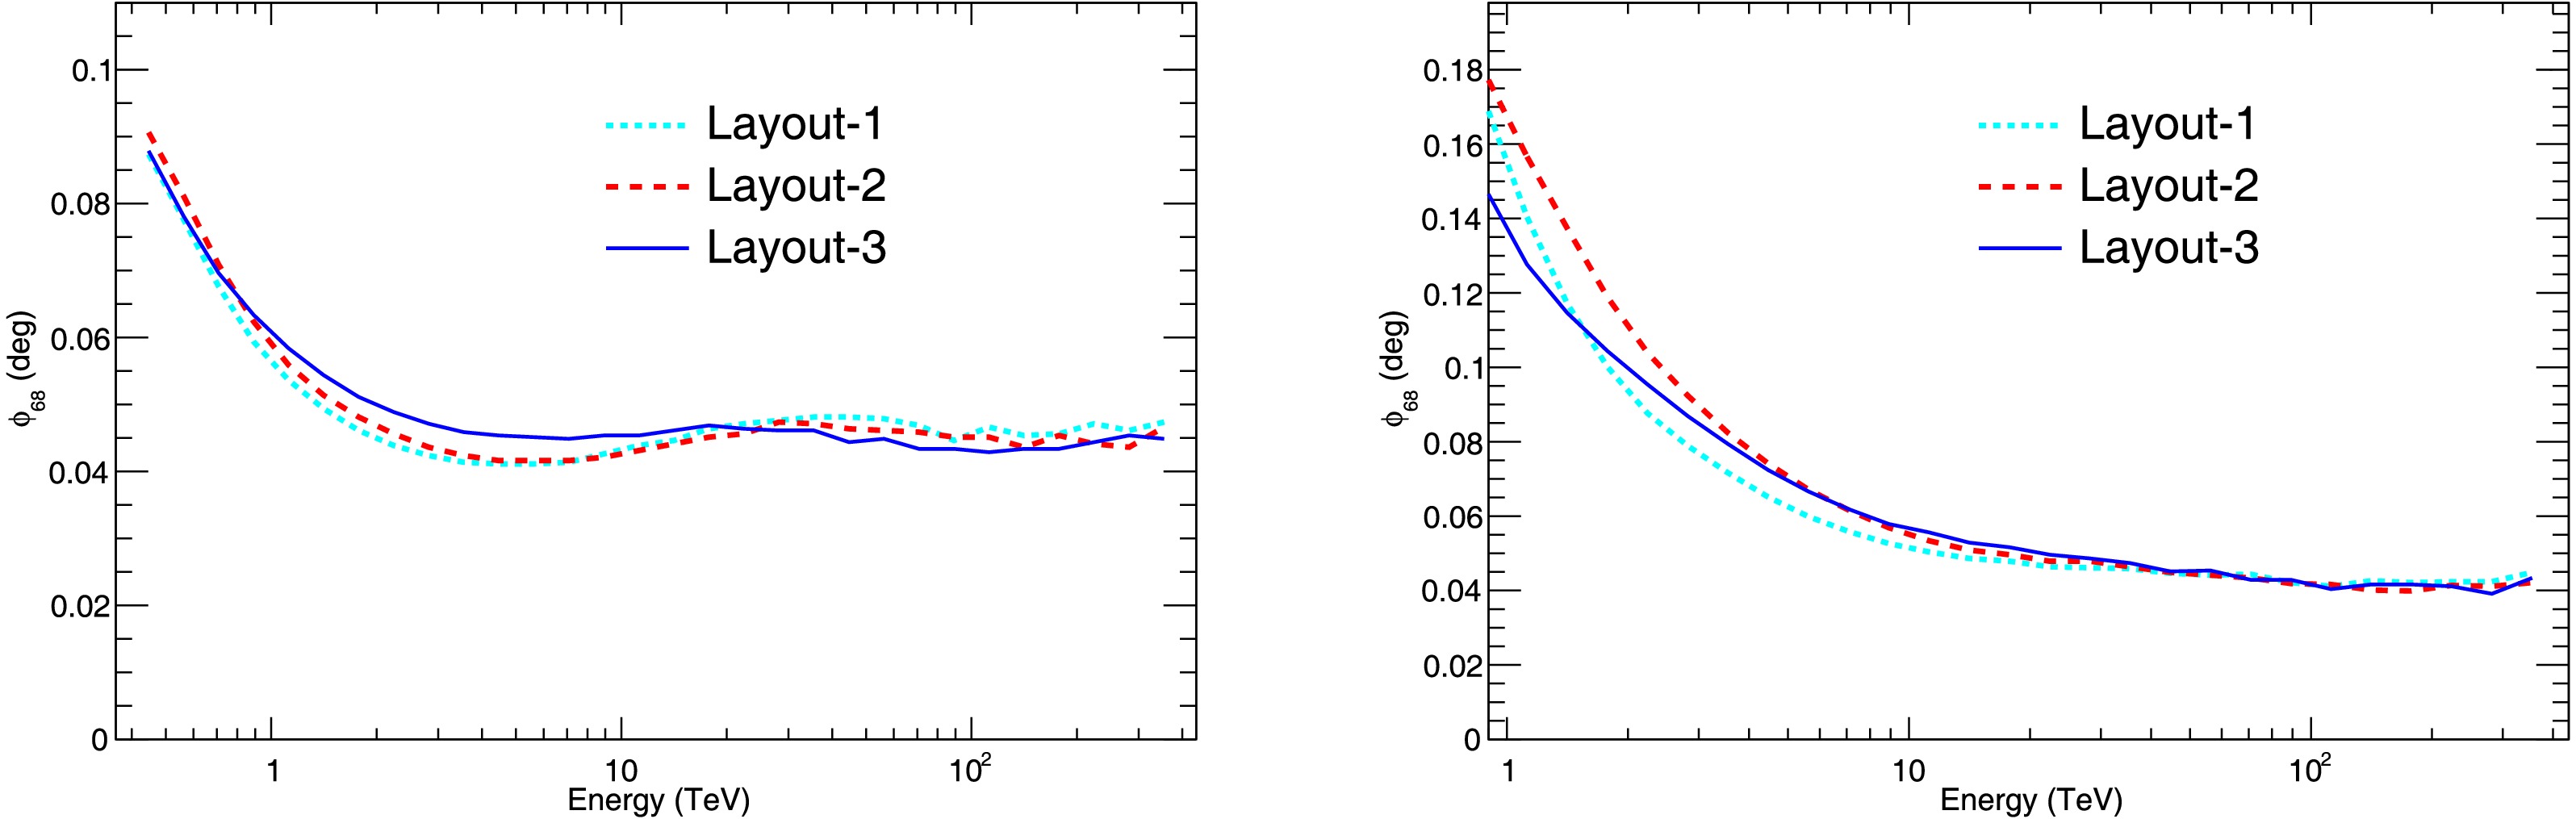
Figure 10. (color online) The angular resolution as a function of energy for the three layouts with 40° zenith angle under Mode 1 (left) and Mode 2 (right) observation modes, respectively.
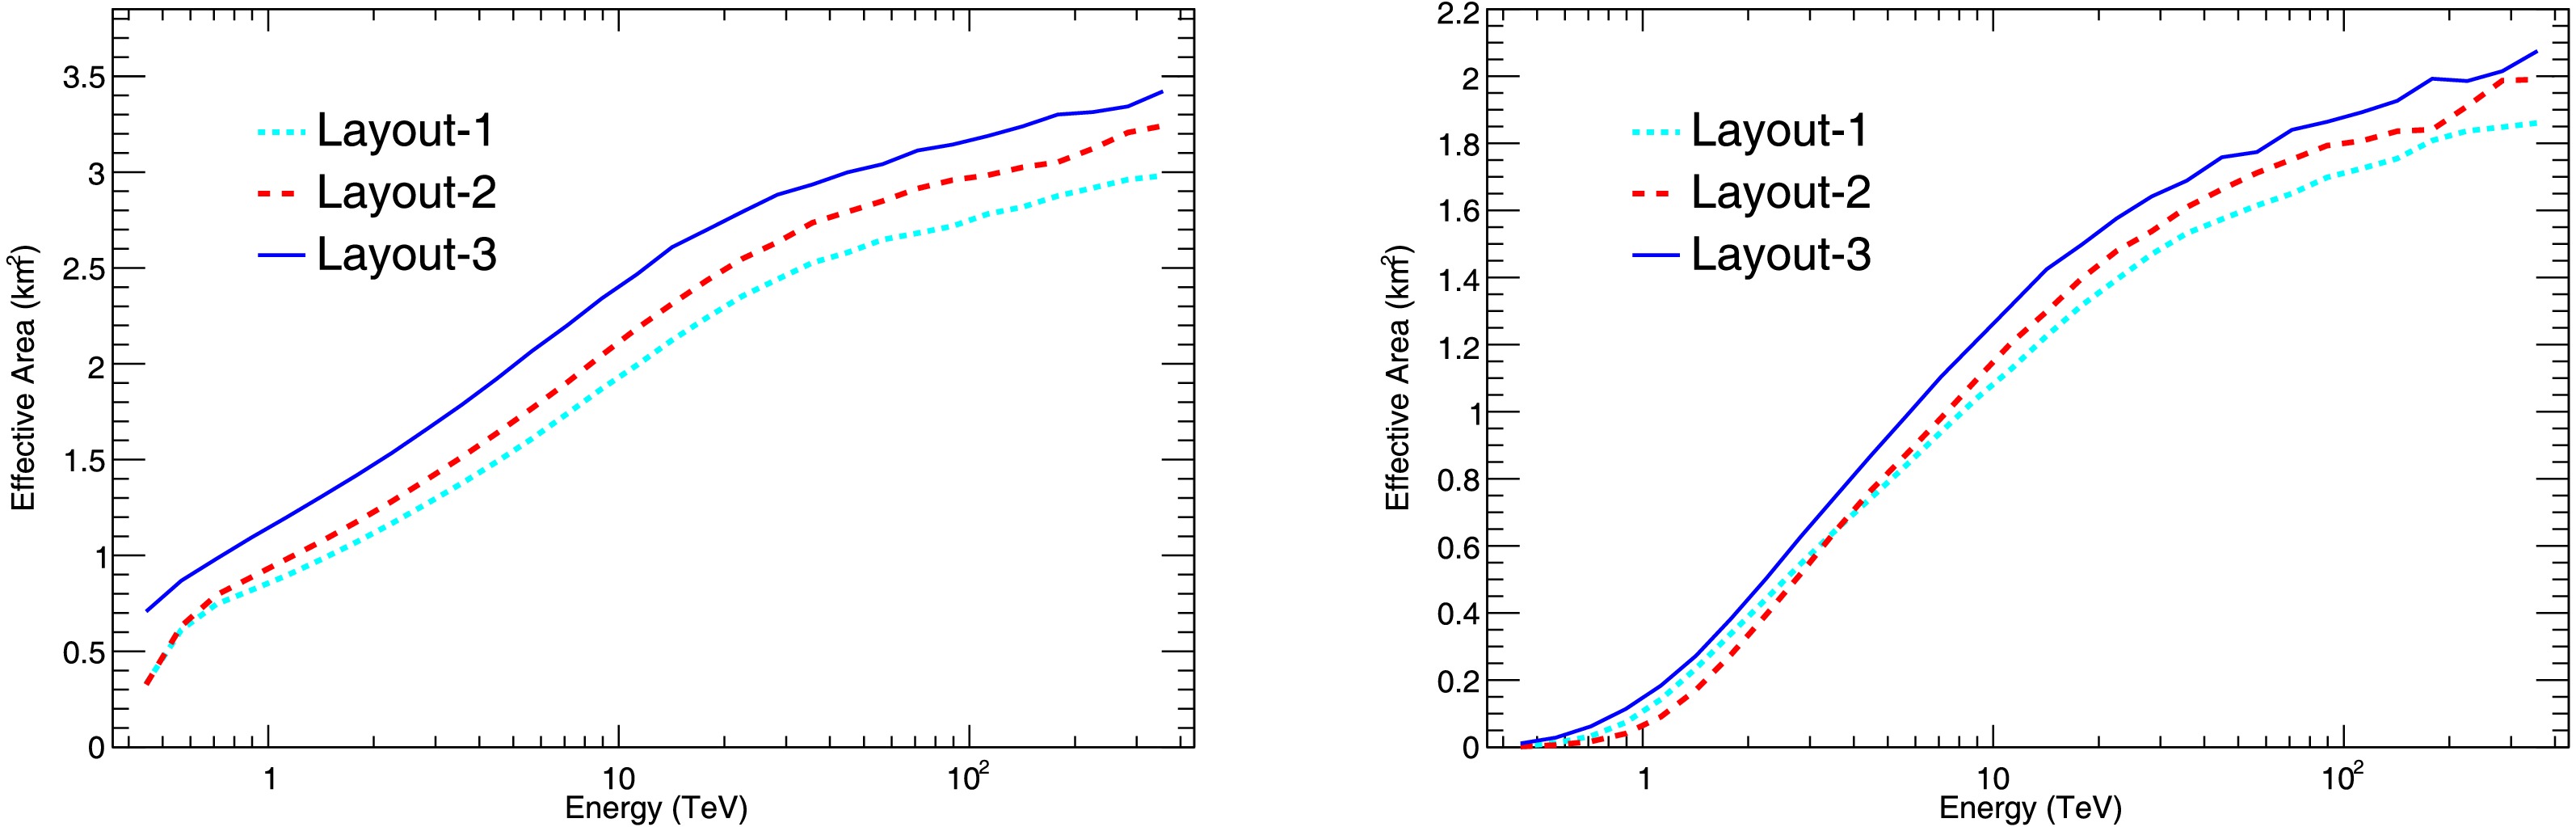
Figure 11. (color online) The effective area as a function of energy for the three layouts with 40° zenith angle under Mode 1 (left) and Mode 2 (right) observation modes, respectively.
-
In this section, we present the experimental performance and provide a preliminary estimation of the experimental sensitivity under different observation conditions for the final optimized layout. Figure 12 shows the effective area of LACT at zenith angles of 20°, 40°, and 60° under Mode 1 (left) and Mode 2 (right). The effective area generally increases with zenith angle, except in Mode 1, where, due to atmospheric absorption of photons, the effective area at 60° zenith angle is lower than that at 20° and 40° below about 3 TeV. Under the Mode 1 observation mode, the effective area reaches 1 km2 for energies above approximately 1 TeV, and reaches 2 km2 when the energy is above 5 TeV. In the 30 TeV energy range, the effective area at 60° zenith angle even reaches 5 km2. Compared with the Mode 1, the energy threshold is higher in Mode 2 due to the larger telescope spacing as shown in Table 2. When observing at zenith angles of 20° and 40°, the effective area reaches 1 km2 when the energy exceeds around 4 TeV. The effective area is the largest at 60° zenith angle, reaching 4 km2 around 30 TeV. Under the optimized layout, LACT achieves a larger effective area, far exceeding that of current ground-based imaging atmospheric Cherenkov telescope experiments, providing the necessary foundation for detecting ultra-high-energy gamma-ray signals with sufficient statistics.
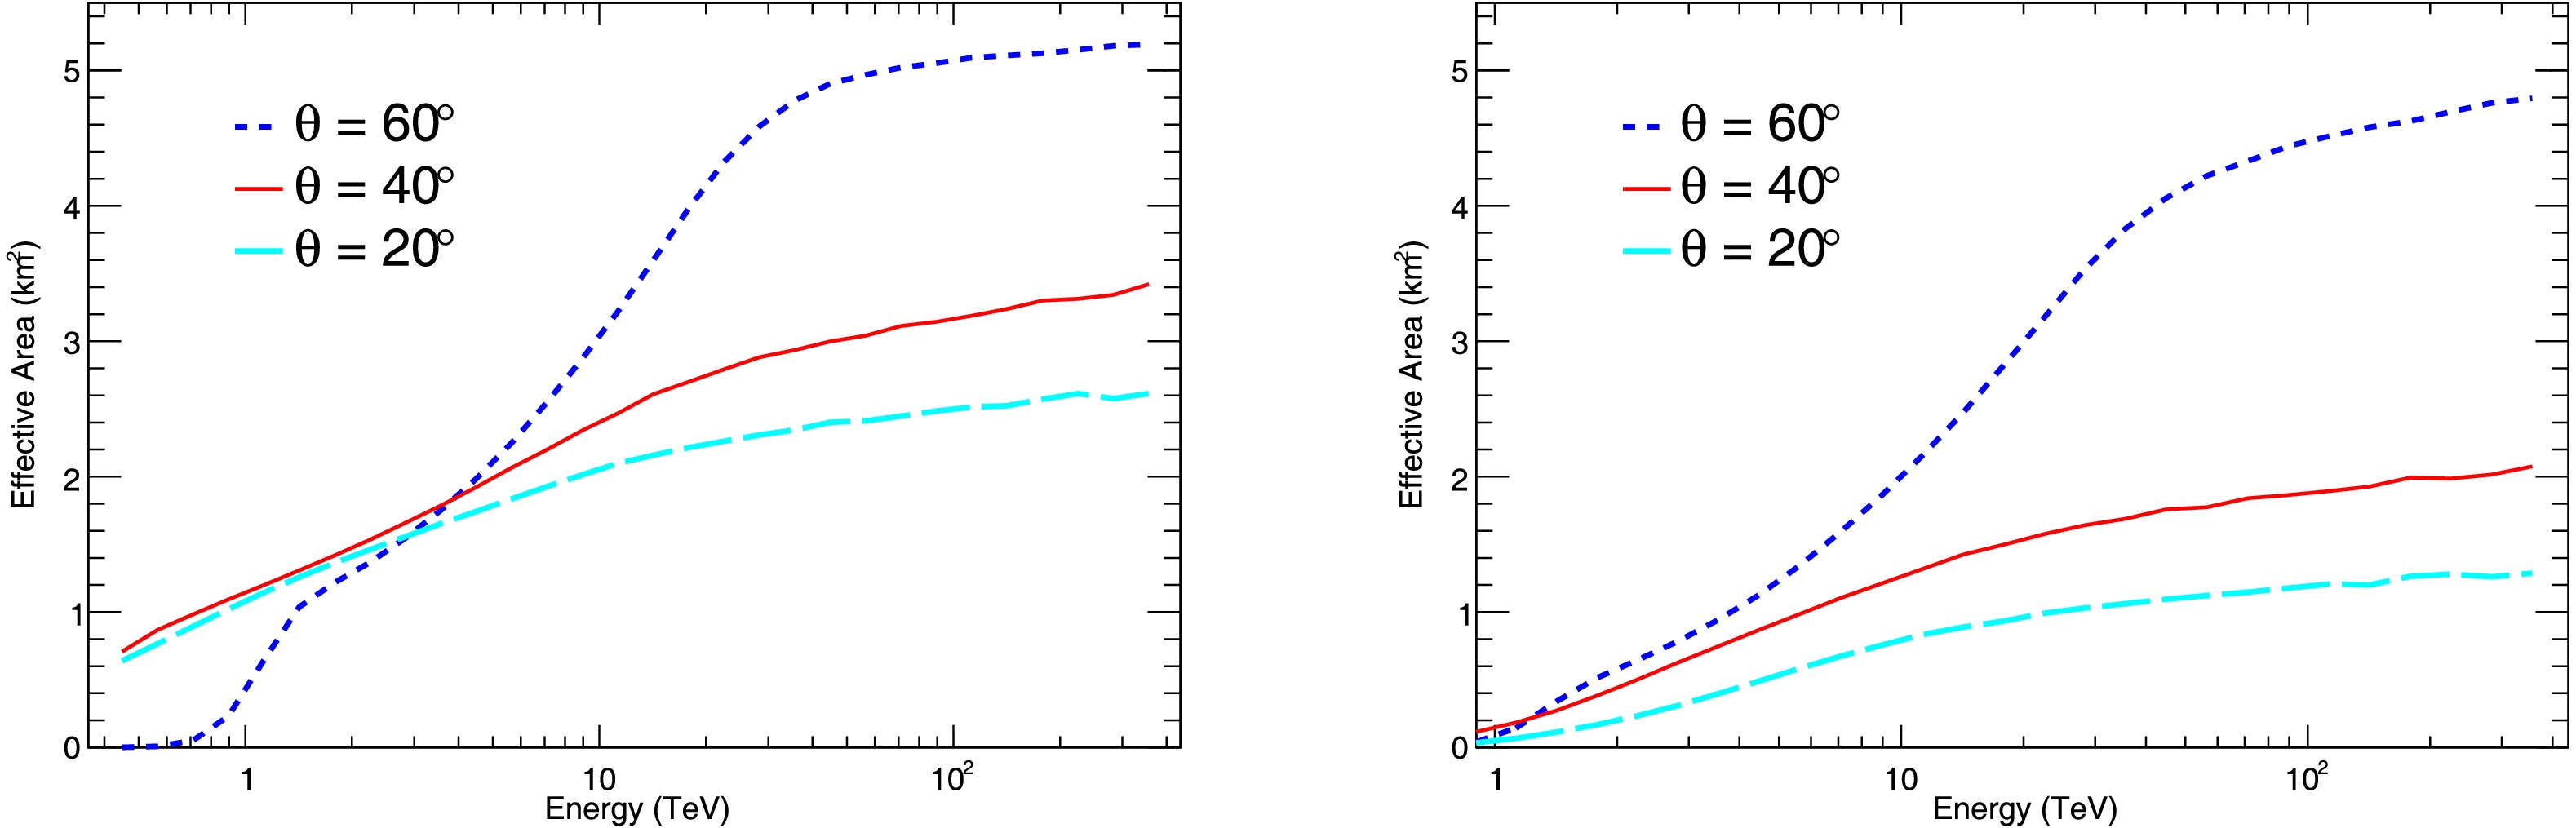
Figure 12. (color online) The effective area of LACT at zenith angles of 20°, 40°, and 60° under Mode 1 (left) and Mode 2 (right).
Mode 20° 40° 60° Mode-1 0.92 0.72 1.48 Mode-2 3.33 2.43 1.78 Table 2. The energy threshold of LACT at different zenith angles under two observation modes. (Unit: TeV)
Under the optimized layout, LACT not only has a large effective area but also excellent angular resolution. Figure 13 shows the angular resolutions at zenith angles of 20°, 40°, and 60° under Mode 1 (left) and Mode 2 (right). In Mode 1, below 10 TeV, the angular resolution at 40° is better than that at 20°. Above 10 TeV, the angular resolution is comparable around 0.045°. In Mode 2, below 10 TeV, the angular resolution at 20° is relatively poor and gradually improves with increasing energy. Above 10 TeV, the angular resolution at 20° and 60° is comparable, while that at 40° is the best, reaching better than 0.07° and 0.05°, respectively. At 100 TeV, the angular resolution for all zenith angles is better than 0.06°.
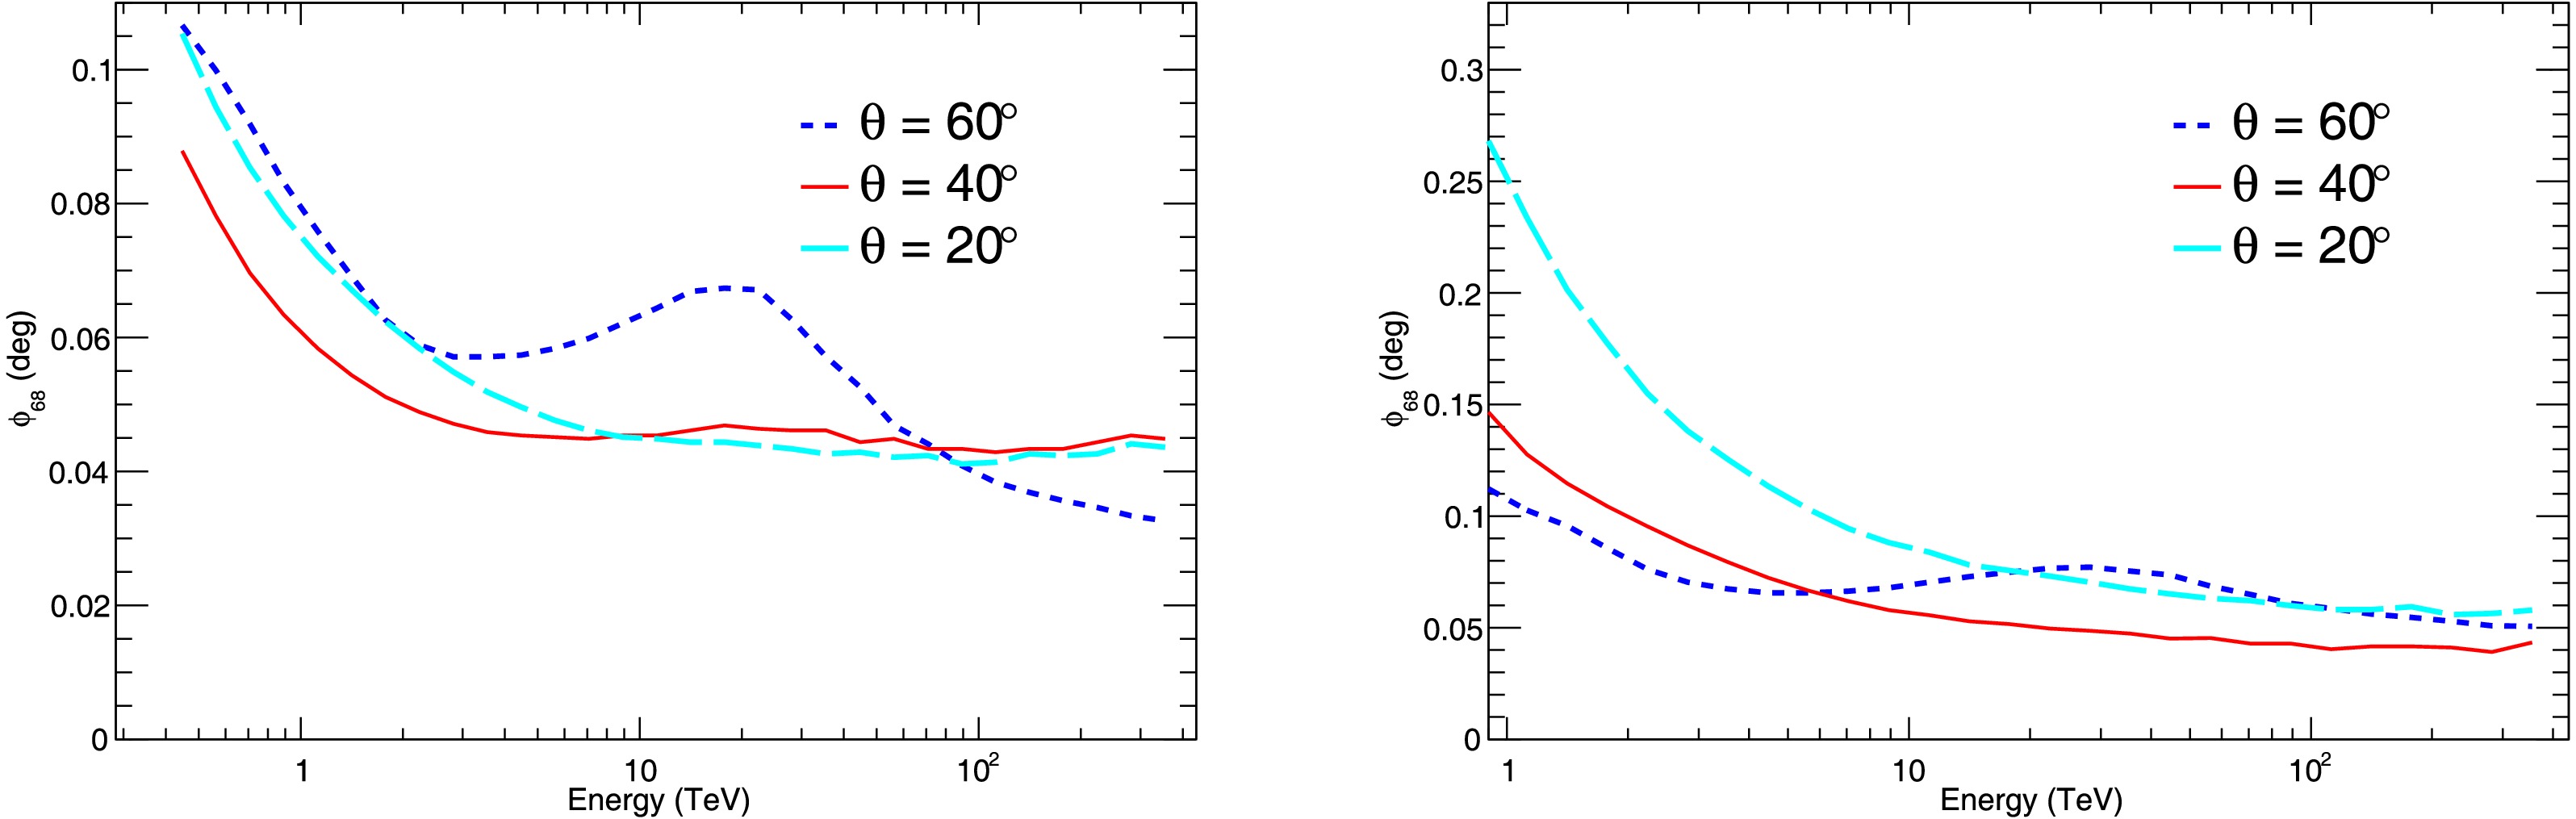
Figure 13. (color online) The variation of angular resolution with energy at zenith angles of 20°, 40°, and 60° under Mode 1 (left) and Mode 2 (right).
Figure 14 shows the sensitivity distribution, which characterizes the overall performance of the LACT experiment. The sensitivity is defined as the minimum flux required to detect a gamma-ray signal that exceeds the background fluctuation by a factor of 5, using the Crab Nebula as a standard, i.e., achieving a signal significance of
$ 5\sigma $ . By utilizing the muon information provided by the KM2A experiment, LACT's background rejection capability has been significantly improved [20]. In the sensitivity estimation, the energy is divided into bins with a width of$ \Delta \log_{10} E = 0.2 $ . The significance is calculated using the Li & Ma formula (1) [21], which is commonly used in gamma-ray astronomy. In our analysis, we adopt$ \alpha = 1 $ , corresponding to equal exposure and acceptance between the on-source and off-source regions. This is appropriate for our simulated data, where observation conditions are identical for both regions. To avoid the influence of background fluctuations, the number of gamma-ray signals in each bin is required to be at least 10. Below 10 TeV, the sensitivity in Mode 1 (20° zenith angle) is better than that in Mode 2 (60° zenith angle). Above 10 TeV, the situation is reversed, the sensitivity at 60° zenith angle is better than that at 20°, reaching approximately twice the level.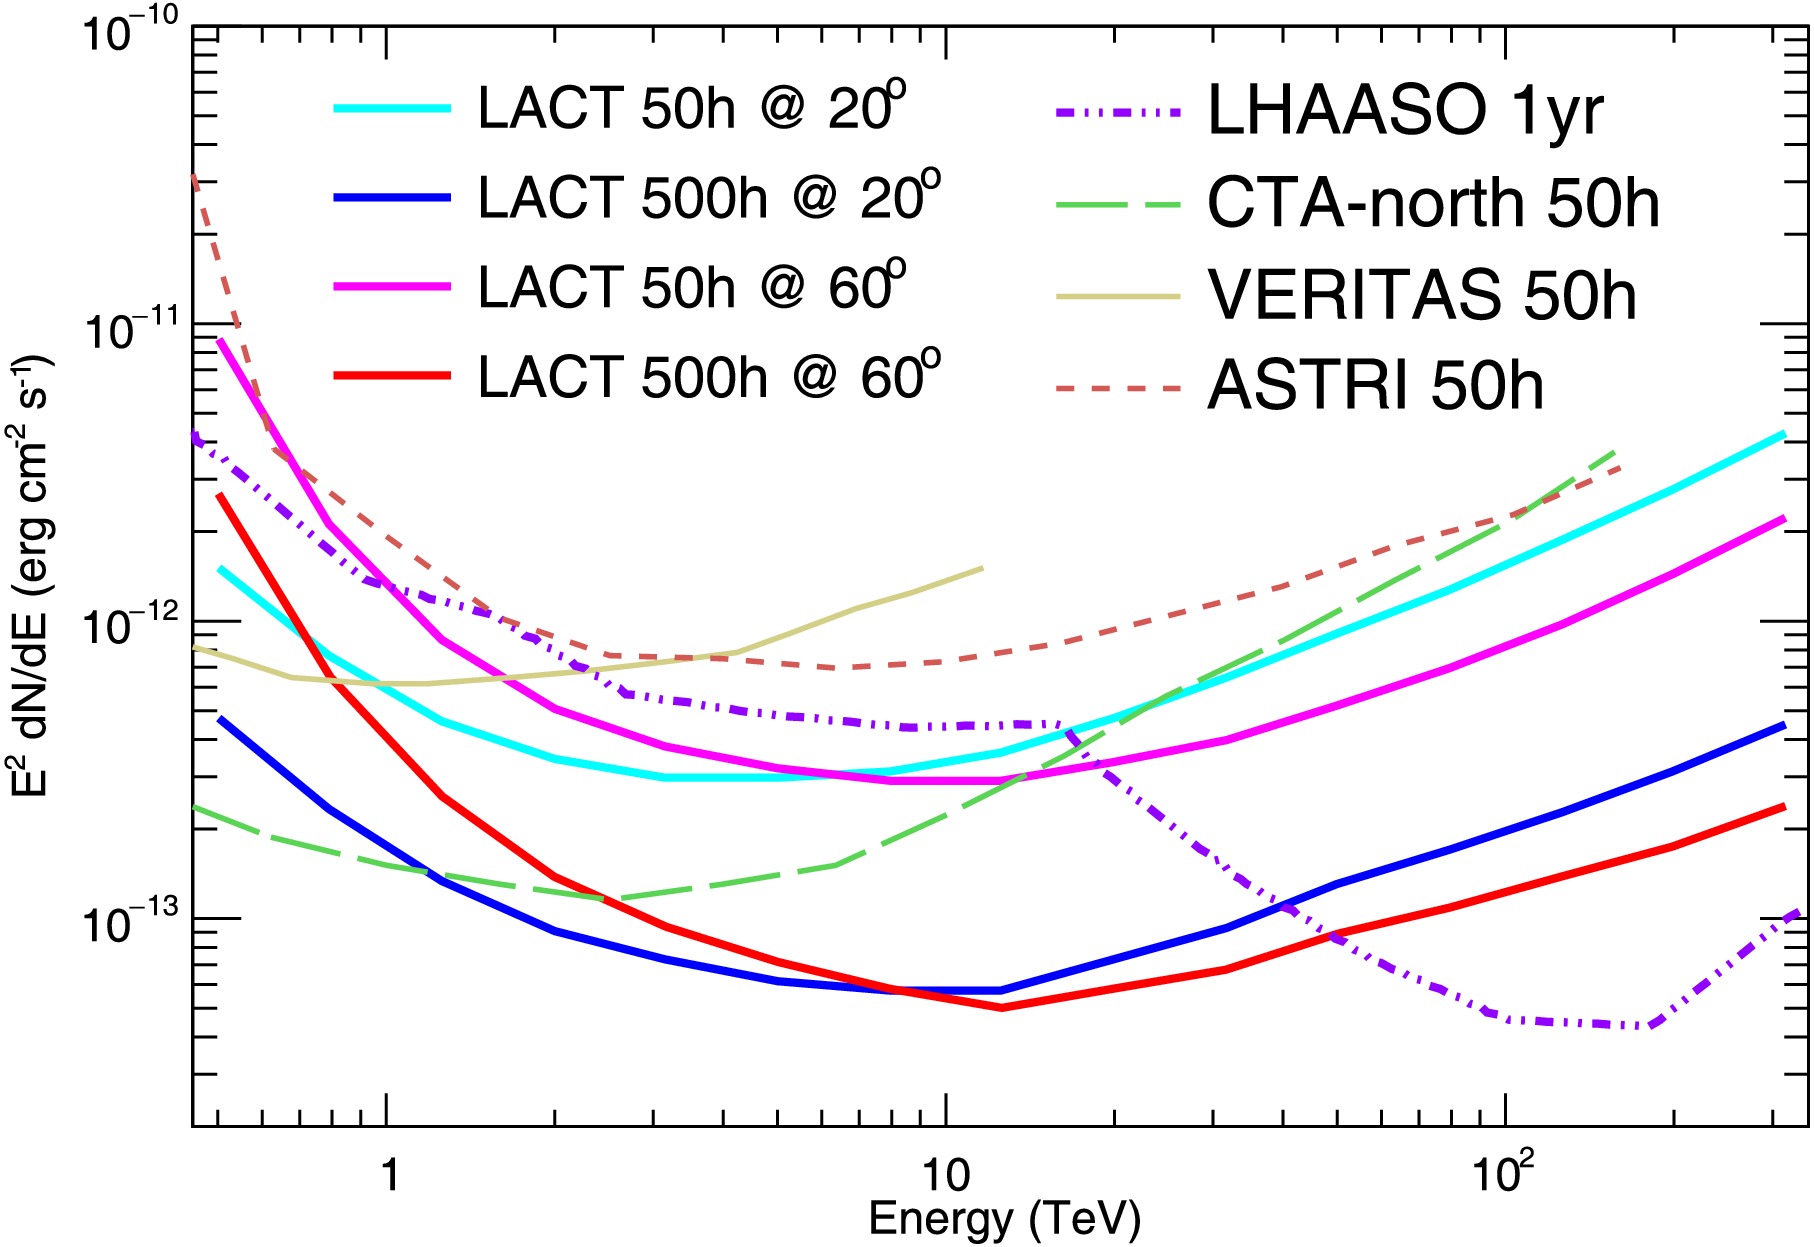
$ \begin{aligned}[b]\\ S = \sqrt{ 2 \left[ N_{{\rm{on}}} \ln \left( \frac{1+\alpha}{\alpha} \cdot \frac{N_{{\rm{on}}}}{N_{{\rm{on}}}+N_{{\rm{off}}}} \right) + N_{{\rm{off}}} \ln \left( (1+\alpha) \cdot \frac{N_{{\rm{off}}}}{N_{{\rm{on}}}+N_{{\rm{off}}}} \right) \right] } \end{aligned} $
(1) -
An important scientific objective of the LACT experiment is the observation of ultra-high-energy gamma-ray sources. However, the gamma-ray flux decreases dramatically in this energy range. To ensure measurement accuracy, sufficient signals must be obtained. Therefore, the observation time for each source should be at least on the order of years. The detectors in the LACT experiment are new-generation Cherenkov telescopes equipped with SiPMs as photosensors, which allows them to operate even on moonlit nights. To avoid direct moonlight contamination, observation periods are selected such that the angular separation between the gamma-ray source and the Moon is greater than 30°. By doing so, the observation time of LACT increases by approximately 50% compared to the operation limited to moonless, dark nights only.
When calculating the exposure time, the first step is to determine the duration of nighttime each day. The moment when the Sun sets below the horizon and twilight ends is recorded as the start of nighttime. The end of nighttime is marked by the beginning of dawn, i.e., before the Sun rises. Next, based on the trajectory of the gamma-ray source in the telescope's FOV, the times when the source transits within the telescope's FOV during the nighttime are calculated. This time depends on the zenith angle range of the observation. Here, we set the maximum observation zenith angle at 70°. Based on this algorithm, we calculated the total exposure time for the 90 sources in the LHAASO catalog over a calendar year, with the results shown in Figure 15. The left panel shows the distribution of total exposure time for sources under all-weather observation conditions (covering both day and night), as with LHAASO. It can be seen that the higher the declination of the source, the longer the exposure time. Considering the nighttime conditions, the exposure time is reduced to about one-third compared to all-weather observation, and the exposure time also depends on declination, increasing with higher declination.
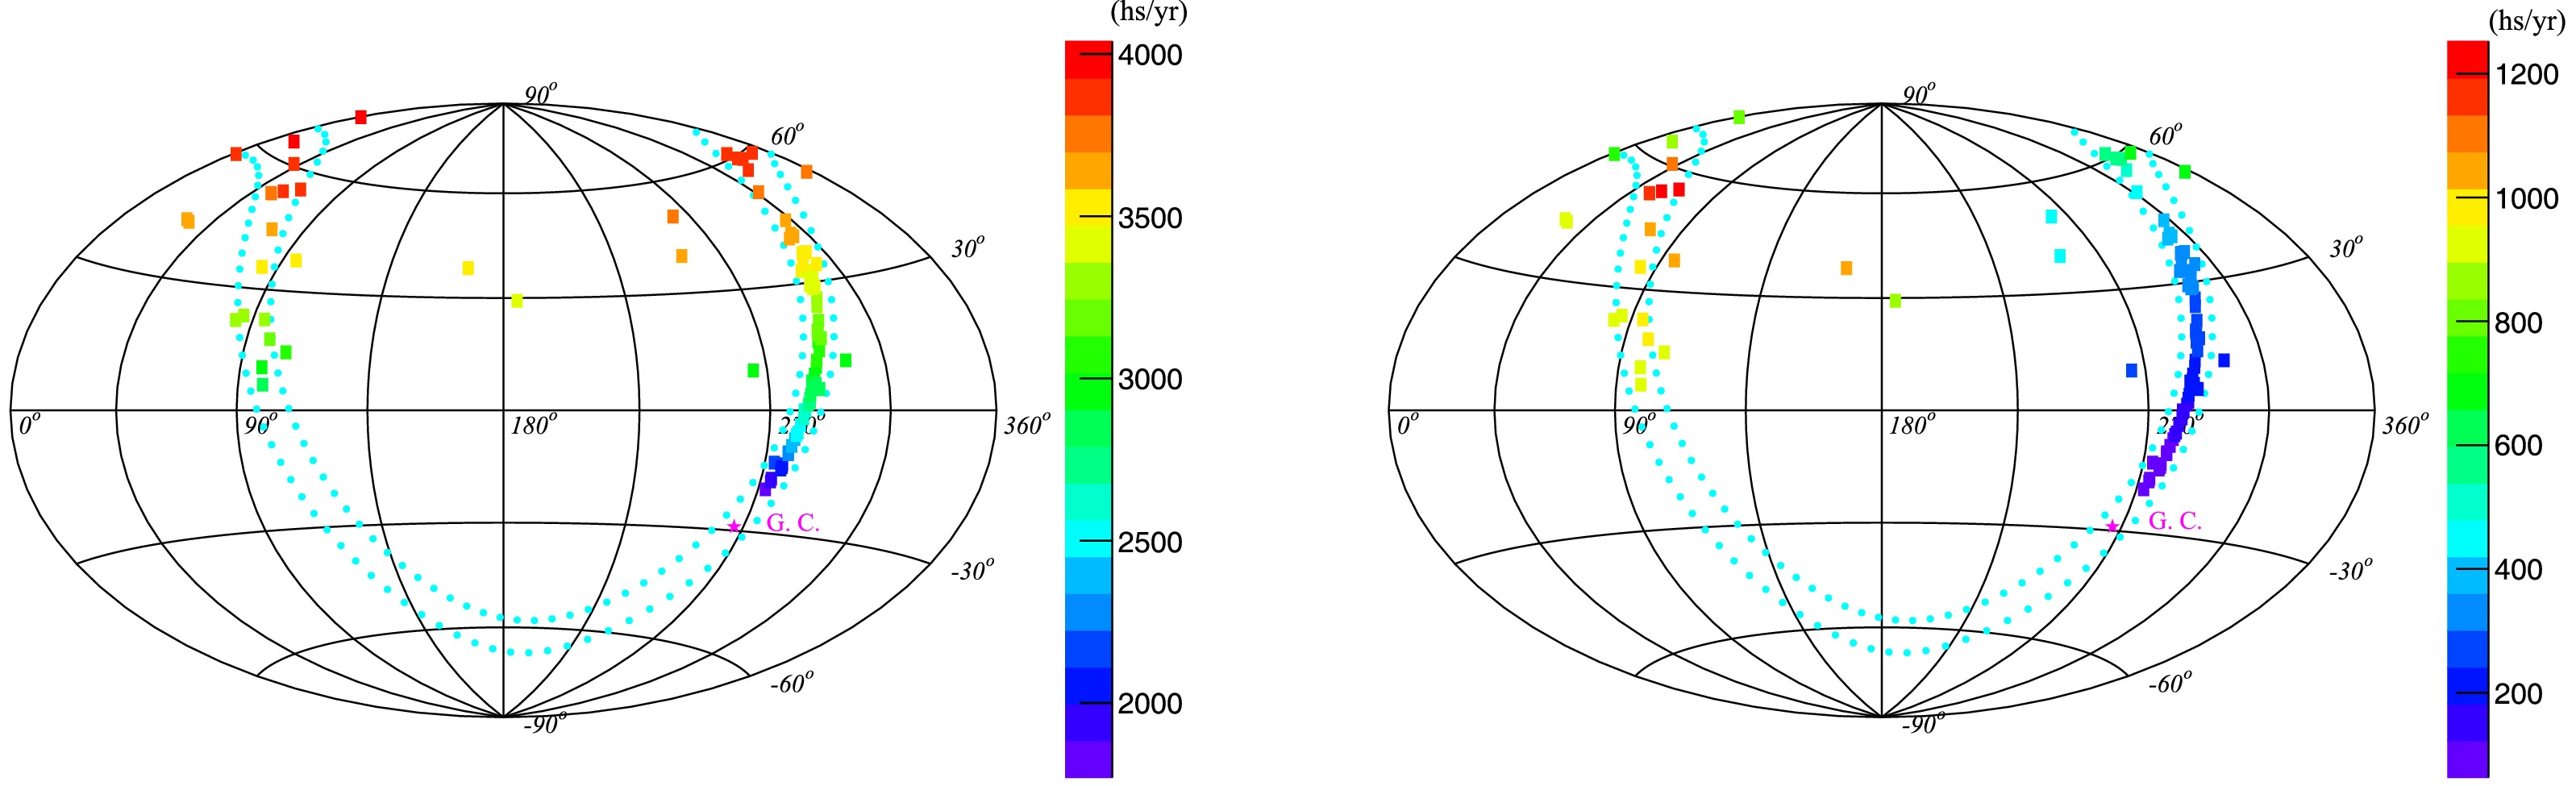
Figure 15. (color online) The distribution of total exposure time for sources under all-sky observation (left) and in the night after removing the period from May to September (right).
At the LHAASO site, the period from May to September is the rainy season. Due to precipitation, cloud cover, and thunderstorms et. al, the LACT telescope cannot be operated. Therefore, the observation time for these months is removed, with the results shown in the right panel of Figure 15. Since the observation in the direction of the Galactic Center is in summer nights, the exposure time for the Galactic Center direction is significantly reduced after removing the summer period, while the exposure time for the anti-Galactic Center direction is less affected.
-
Based on the effective area of LACT and the exposure time calculated along the trajectories of the gamma-ray sources, we used the spectral information of gamma-ray sources provided by the LHAASO catalog to calculate the expected number of signal events for each source. To ensure the accuracy of source measurements, we selected sources with relatively strong signal events in the high-energy region for study. There are 45 sources with more than 120 expected gamma-ray signals per year above 30 TeV. An observation plan for LACT candidate sources can be developed from among these sources.
As described in Section 2.1, the different observation modes of LACT are suitable for different zenith angle ranges. Therefore, we conducted a detailed analysis of the trajectory zenith angles of the target sources within the FOV and found that they can be roughly divided into three cases: 1) For sources with a right ascension (RA) less than 180°, most are located in the northern celestial hemisphere (i.e., with declination
$ \gt 0^\circ $ ) and primarily appear during winter nights. The exposure times for these sources are concentrated at small zenith angles below 30°, often exhibiting a sharp peak at a specific angle (e.g., sources J0542+2311, J0703+1405, etc.). 2) For sources with RA greater than 180°, they mainly appear in the FOV during summer. However, as noted in Section 2.1, LACT cannot operate from May to September due to meteorological constraints such as frequent rainfall, cloud cover, and thunderstorms during the rainy season. Consequently, these sources are observable only for very limited periods during spring nights before May and autumn nights after September. Their exposure times are predominantly distributed at large zenith angles above 40°, showing an approximately uniform distribution across this range (e.g., sources J1908+0615, J2018+3643, etc.). 3) For high-latitude sources (with declination > 60°), regardless of the season in which they appear, their exposure times are mainly distributed at zenith angles above 30°. A sharp peak is observed at a specific angle between 30° and 50° (e.g., sources J0008+7303, J2229+5927, etc.), followed by a rapid decline. At zenith angles above 50°, the distribution is nearly uniform. As an example, Table 3 summarizes the proportions of exposure times across different zenith angle ranges for the three source types described above, along with information such as total exposure time and expected signal counts.Name RA (deg) Dec (deg) $ N_{\gamma} $ T (hour) F (ze < 30°) F (30° < ze < 50°) F (ze > 50°) J0542+2311u 85.71 23.11 1015 947.2 46 26 28 J0703+1405 105.83 14.05 2240 953.0 41 29 30 J2228+6100u 337.01 61.0 999 551.7 5 44 51 J0056+6346u 14.1 63.46 488 889.5 0 56 44 J2018+3643u 304.65 36.43 484 350.1 17 29 54 J1843-0335u 280.91 3.36 352 142.6 0 30 70 Table 3. The total exposure time in a calendar year (T), the expected gamma-ray signals above 30 TeV (
$ N_{\gamma} $ ), and the exposure time ratios (F (%)) at different zenith angle ranges for several typical sources observed by LACT. -
The LACT experiment involves 32 telescopes. A layout design has been investigated based on the full simulation optimization and an on-site survey. First, the selection criteria for Cherenkov images have been studied. Different criteria and requirements for the number of images are adopted for geometric and energy reconstruction, ensuring both good angular and energy resolution, as well as a large effective area. Second, two types of layouts– grouped and uniform layouts–have been explored. The grouped layout was found to be superior in performance. Finally, based on the theoretical optimization, an on-site survey of the experimental station was conducted and three candidate layouts were proposed. Based on the comparison, the optimal layout for practical implementation was selected, and the experimental performance of the final layout under various observing conditions was evaluated.
Furthermore, by tracking the trajectories of 90 gamma-ray sources from the LHAASO Phase-I catalog within the LACT FOV, the exposure time of these sources over a calendar year was estimated. Based on the calculated exposure times of the gamma-ray sources and the effective area at different zenith angles under the optimized layout, we estimated the expected gamma-ray event counts for these sources, selected those with strong signals, and grouped them according to their visibility durations in the LACT FOV. In actual observations, each sub-array will track one group of sources. This research provides a solid foundation for coming observations after the completion of LACT construction.
Design of LACT Detector Layout and Expectation for Gamma-ray Sources Observation
- Received Date: 2025-10-10
- Accepted Date: 2018-02-17
- Available Online: 2026-06-01
Abstract: The Large Array of imaging atmospheric Cherenkov Telescopes (LACT) is a next-generation Cherenkov telescope array designed to study the morphology and energy spectra of ultra-high-energy gamma-ray sources in hybrid operation with the Large High Altitude Air Shower Observatory (LHAASO). With its excellent angular resolution, large effective area, and powerful gamma/hadron discrimination capabilities, LACT achieves outstanding sensitivity for observations of gamma-ray sources In this paper, we present an optimized configuration for the LACT array, developed through comprehensive Monte Carlo simulations. Based on these simulations, we conducted on-site surveys at the LHAASO site and selected the most effective array layout. Detailed performance studies show that this optimized configuration delivers excellent sensitivity across various observational modes. Furthermore, we present a detailed outlook on LACT's potential observations of gamma-ray sources in the LHAASO catalog. By incorporating the measured energy spectra from LHAASO and accounting for LACT's detector response function at different zenith angles, we estimate the number of detectable events over a one-year observation period. This analysis provides a foundation for developing a preliminary observation strategy for LACT in the coming years.


 DownLoad: