


 Abstract
 HTML
HTML Reference
 Related
 PDF
PDF


-
The study of characteristic
$ \gamma $ -ray emission in nuclear reactions induced by fast neutrons is of significant interest for a range of fundamental and applied problems. In particular, it provides additional information about nuclear structure and the probability of exciting specific nuclear states. Spectroscopy of characteristic$ \gamma $ -rays emitted in reactions induced by fast neutrons (most commonly with energies around 14 MeV) is frequently used to investigate the elemental composition of various materials [1]. However, it is noted that the accuracy of existing experimental and evaluated data on$ \gamma $ -ray emission under fast neutron irradiation requires substantial improvement to meet modern demands and support emerging fields such as planetary nuclear spectroscopy.The TANGRA (TAgged Neutrons and Gamma-RAys) project at the Frank Laboratory of Neutron Physics, Joint Institute for Nuclear Research (JINR) [2, 3], employs the tagged neutron method (TNM) [4] to address current fundamental and applied challenges [5]. The tagged neutron method offers a simple and cost-effective alternative to pulsed neutron generators while retaining many of their advantages (e.g., time-of-flight background suppression, compactness, etc.). Due to these benefits, TNM has been applied to various practical problems, including geology [6], metallurgy [7], and hazardous material detection [8]. To enhance the accuracy of analysis and expand its applications, the TANGRA project is conducting a large-scale study of angular distributions and cross-sections for characteristic
$ \gamma $ -ray emission induced by 14.1 MeV neutrons across a wide range of elements [9−14]. It is worth noting that the papers [9, 10, 12, 13] presented only relative measurement results, while the paper [14] presented preliminary results that did not take into account corrections for multiple scattering and attenuation of neutrons in the neutron generator. Among the elements of particular interest are carbon, aluminum, silicon, calcium, titanium, chromium, and iron, which are major constituents of many geological materials and some hazardous substances.Currently, a considerable amount of experimental data exists for these elements at neutron energies near 14 MeV, particularly for carbon [15−27, 27−38], aluminum [15, 24, 28, 31, 39−46], silicon [19, 26, 28, 30, 42, 47−58],calcium [19], titanium [19, 31, 49, 51, 53, 59−64], chromium [39, 49, 50, 59, 60, 65−69], and iron [26, 30, 46, 47, 49, 52, 53, 59, 65, 67, 70−84]. Despite the impressive number of studies, one of the major issues is the fragmented and insufficient data on angular distributions of
$ \gamma $ -rays emitted in neutron-induced reactions. According to Simakov's compilation [85], which provides a detailed review of experimental data available up to 1998 (see Table 3 in [85]), most measurements were performed for only$ 1-2 $ angular points, making it impossible to accurately assess$ \gamma $ -ray emission anisotropy or reliably estimate total cross-sections. Additionally, many studies lack detailed descriptions of experimental setups and data correction methodologies, complicating efforts to resolve discrepancies in reported cross-sections. Some recent studies, such as those conducted at the GAINS setup in GELINA [57, 64, 79], provide thorough descriptions of experimental procedures and data analysis. However, their limitations include a narrow selection of studied elements and the absence of angular distribution measurements.$E_{\gamma}$ (MeV)

Reaction Transition, $E_{i}$ 

$(J_{i}^{\pi}) \rightarrow E_{f} (J_{f}^{\pi})$ 

$\sigma$ (mb)

$a_2$ 

$a_4$ 

4.439 12C $(n,n')^{12}$ C

$4.439(2^+) \rightarrow $ g.s.

$(0^+)$ 

$186\pm24$ 

$0.28\pm0.01$ 

$-0.33\pm0.02$ 

Table 3. Total emission cross-section
$\sigma$ and angular distribution decomposition coefficients into Legendre polynomials$a_2$ and$a_4$ for the 4.439 MeV$\gamma$ -ray line emitted in the interaction of 14.1 MeV neutrons with carbon nuclei. The energies of the initial (i) and final (f) states are given in MeV.The objective of this research was to perform more precise and detailed measurements of differential
$ \gamma $ -ray emission cross-sections for the most intense transitions in carbon, aluminum, silicon, calcium, titanium, chromium, and iron nuclei under irradiation by 14.1 MeV neutrons, followed by the determination of total cross-sections. The detector and sample geometry, as well as sample dimensions, were optimized to minimize some systematic uncertainties, such as incomplete sample coverage by tagged neutron beams. -
The tagged neutron method is based on the detection of secondary
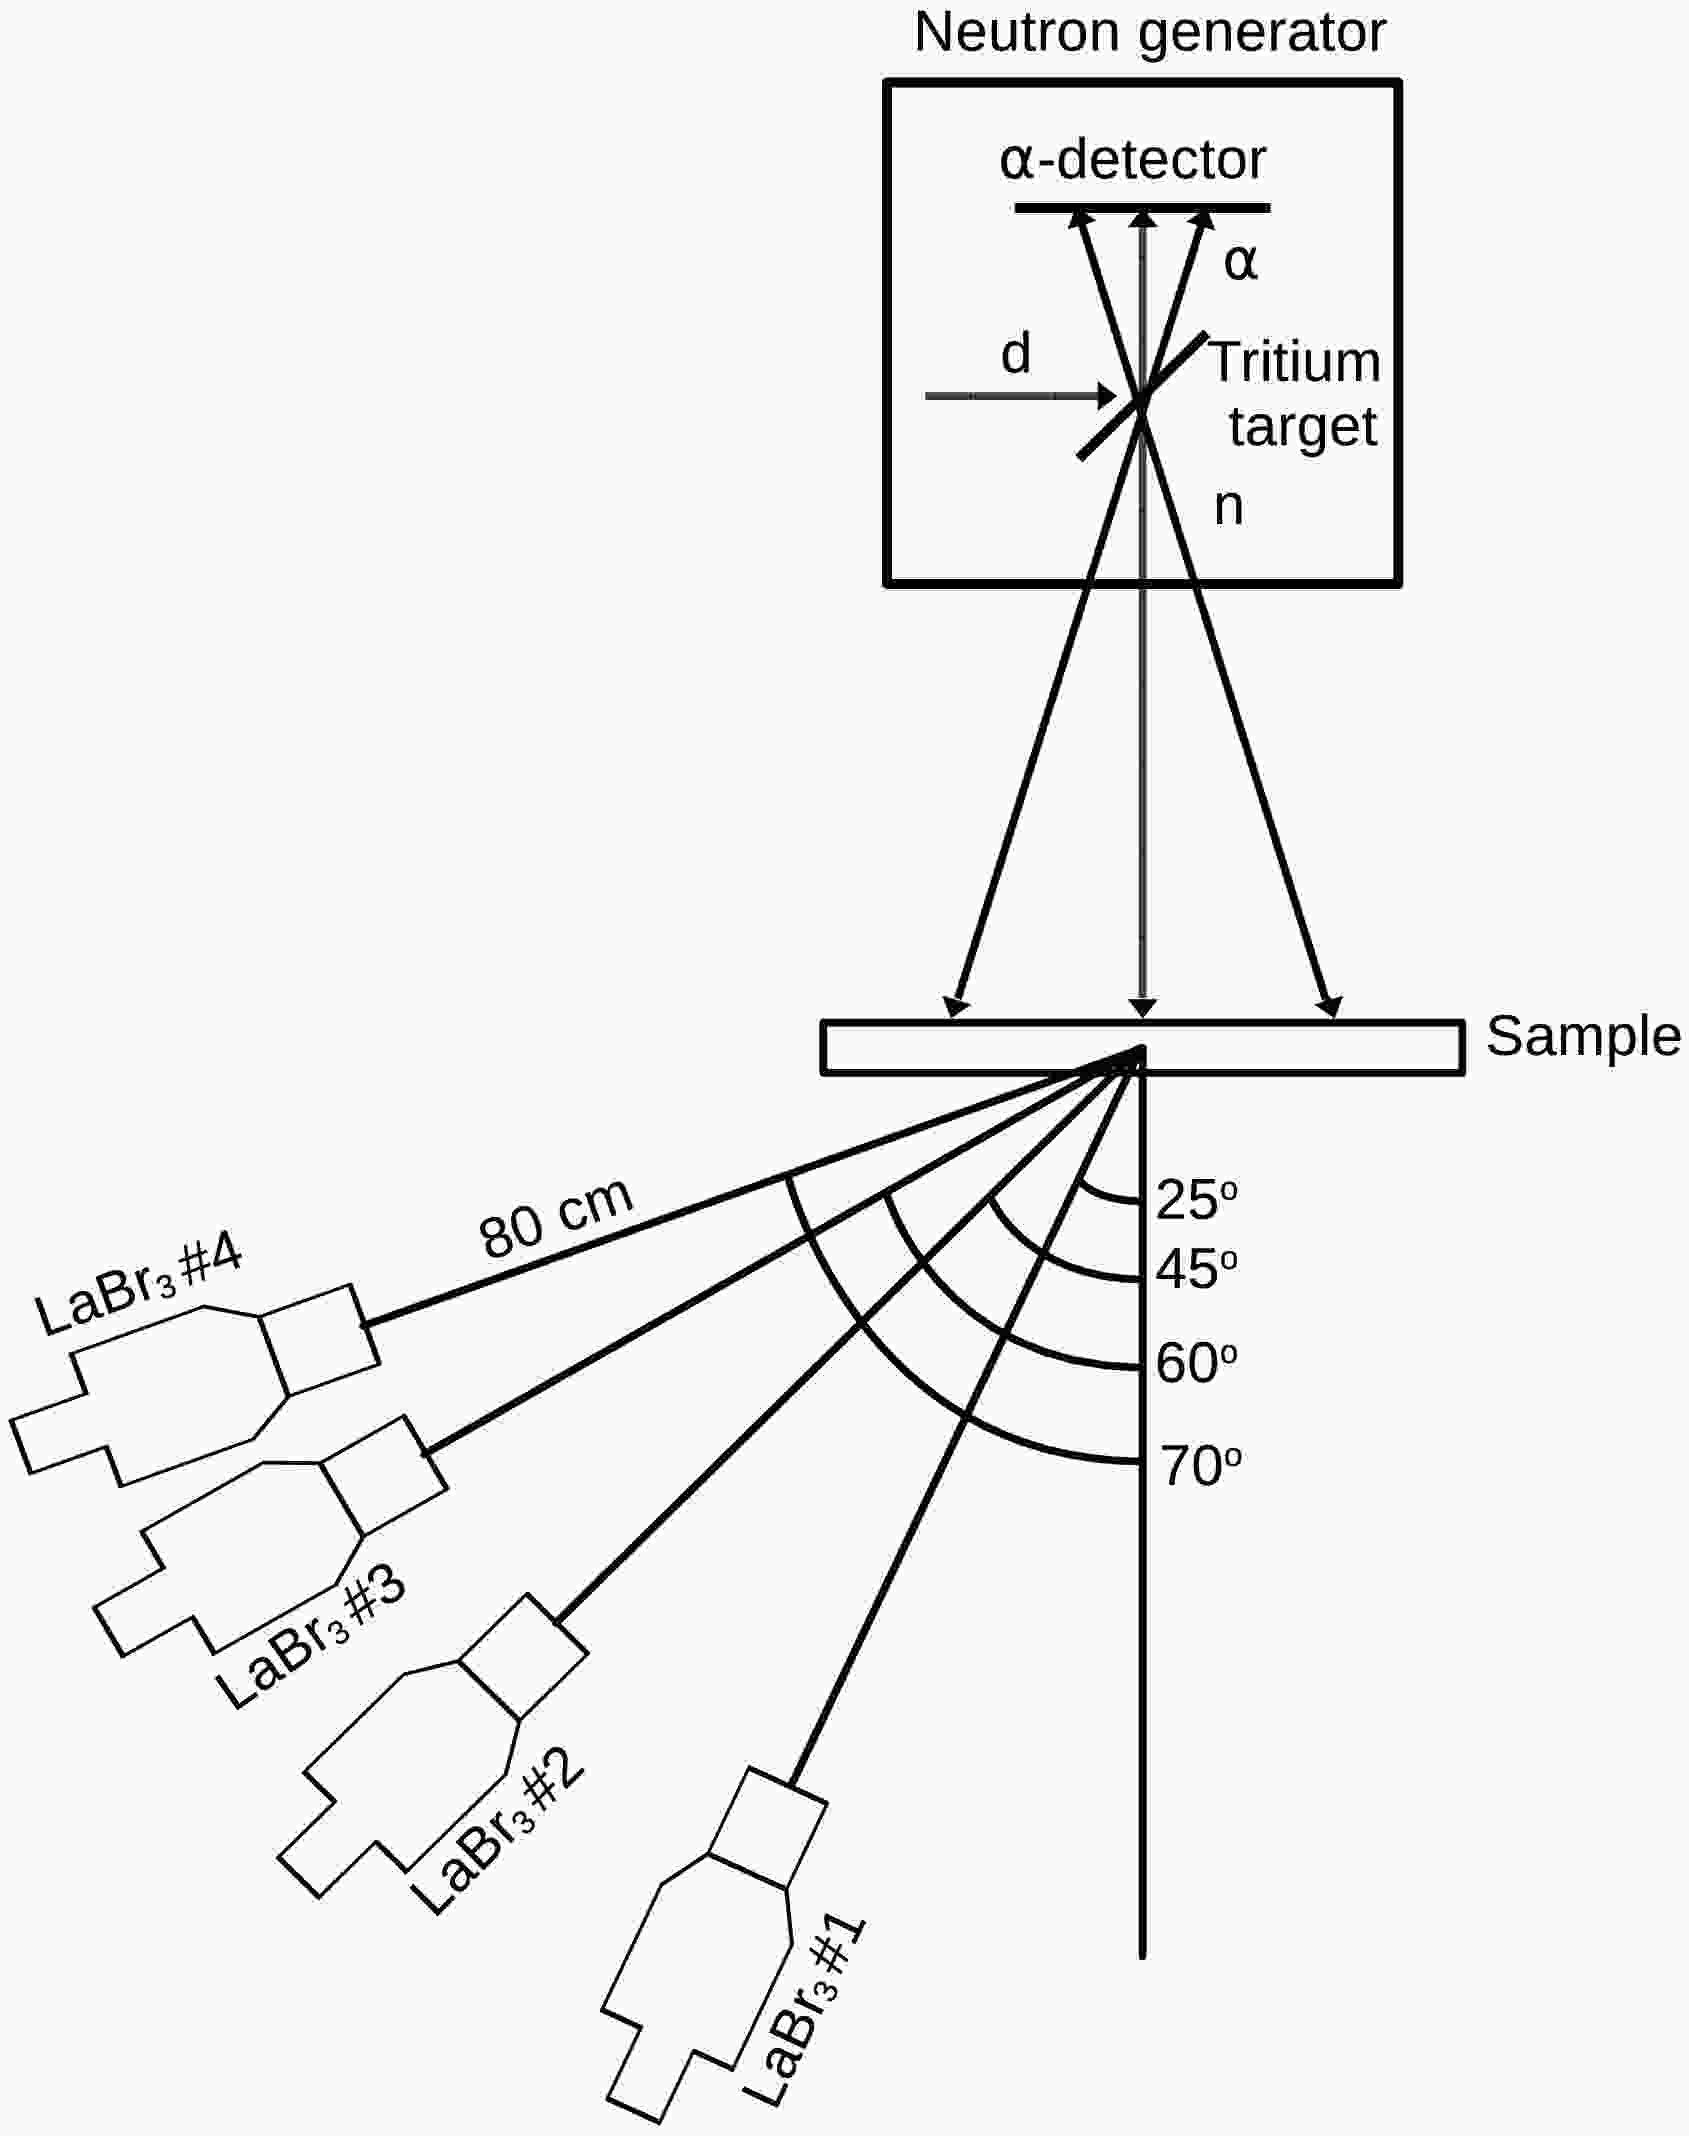
$ \alpha $ -particles accompanying neutron emission in the 3H$ (d,n)^4 $ He fusion reaction using a position-sensitive charged particle detector integrated into the neutron generator vacuum chamber. This provides information about the neutron emission time, direction, and its flux. A characteristic feature of this method is the relatively large size of the tagged neutron beam field, which necessitates either using large samples or accepting that not all neutrons in the beam will hit the sample surface. This can introduce significant systematic effects that distort measurement results, including uncertainty in determining the number of neutrons incident on the sample, as well as absorption and multiple scattering of both$ \gamma $ -rays and neutrons in the sample. In this work, the geometric parameters of the setup were optimized to minimize some of these effects. In particular, the sample size was selected to ensure complete interception of all tagged neutron beams, while the thickness was reduced compared to previous experiments in the TANGRA project. A series of additional experiments were conducted to evaluate the accuracy of correction factors and measurement uncertainty limits.The general layout of the experimental setup is shown in Fig. 1. The neutron source was an ING-27 generator [86] with accelerated deuteron energies of 30 – 90 keV. The
$ \alpha $ -particles accompanying neutron emission were detected using a built-in position-sensitive charged particle detector. This detector consists of 16 vertical and 16 horizontal strips forming 256 pixels. Each pixel size was$ 4\times 4 $ mm2, and the distance between the tritium target and$ \alpha $ -particle detector was 44 mm. In this work, to increase counting statistics, data from only 16 vertical strips were used without pixel subdivision. According to the neutron generator documentation, the distance between individual strips (the dead zone) was 0.1 mm. A separate examination of crosstalk between adjacent strips of the neutron generator was performed. For this purpose, an additional analysis of the measurement results with a TiO2 sample was conducted. In this analysis, in addition to the "$ \alpha $ -$ \gamma $ " coincidences for a specific strip, events corresponding to the coincidence of signals from two adjacent strips and$ \gamma $ -rays corresponding to an energy of 983 keV (the most intense line emitted during the interaction of 14.1 MeV neutrons with titanium nuclei) were also selected. The selection criterion for such events was a time difference between signals from adjacent strips of less than 10 ns. The fraction of events satisfying this criterion was 4±1%. It should be noted that this figure includes not only "true" crosstalk events, but also, to a significant extent, the "electronic" events associated with signal interference in the cable connecting the$ \alpha $ -detector preamplifier and the digitizer. A correction for crosstalk was made during data analysis, and the uncertainty in this value was taken into account when analyzing the total measurement uncertainty.
Figure 1. Layout of the experimental setup (not to scale). d, n,
$ \alpha $ – designations of deuteron beams, tagged neutrons and$ \alpha $ -particles, respectively.The detection efficiency for the
$ \alpha $ -particle detector is about 90%. However, the loss of$ \alpha $ -particles does not distort the measurement results. The absolute flux of the tagged neutron beam was determined directly from the measured$ \alpha $ -particle count rate. Neutrons whose associated$ \alpha $ -particles are not detected are excluded from the defined beam and their interactions form part of the untagged background, which is determined from the random coincidence region of the time-of-flight spectra and subtracted. Therefore, the$ \alpha $ -detection efficiency is inherent to the flux definition and does not require a separate correction for normalization. A more detailed description of the neutron generator used is provided in [86].The experiment utilized samples of graphite, silicon and chromium oxides, as well as metallic aluminum, titanium and iron with natural isotopic abundance. Each sample measured
$ 44\times44 $ cm2, a size selected to ensure complete interception of all tagged neutron beams at the chosen target-to-sample distance of 24.8 cm. The mass of each sample was precisely measured using precision electronic scales. Sample thickness ranged from 0.7 to 2 cm. Powdered materials (SiO2, CaO and Cr2O3) were contained in specially fabricated thin polyethylene boxes (3 mm wall thickness). Detailed specifications for each sample used in the study are provided in Table 1. Thickness uniformity was achieved using 10 special steel spacers evenly spaced across the sample area, preventing deformation of the sample box walls. The possible influence of these spacers was taken into account using background measurements with an empty sample box. Thickness variations were estimated to be no more than 1 mm within a single strip while maintaining the average thickness indicated in Table 1. Uniformity filling was additionally ensured by preliminary preparation of the powder in order to remove lumps, as well as periodic compaction during the filling process.Sample Dimensions (cm3) Purity (%) Mass (g) Density (g/cm3) Graphite (C) $44\times44\times2$ 

99 6670 1.64 Al $44\times44\times0.76$ 

99 3978 2.70 SiO2 $44\times44\times2$ 

99 2418 0.62 Ti $44\times44\times0.9$ 

> 99.5 7601 4.36 Cr2O3 $44\times44\times2$ 

> 99 5161 1.33 Fe $44\times44\times0.9$ 

97 13614 7.81 CaO $44\times44\times2$ 

99 2335 0.60 Table 1. Specifications of the samples used in the current work.
The detector system consisted of 4 LaBr3(Ce) scintillation detectors with crystal dimensions of
$ 3\,'' \times 3\,'' $ . The detectors were positioned at equal distances (80 cm) from the sample center in the horizontal plane at angles of 25°, 45°, 60°, and 70° relative to the axis connecting the generator target and the sample center. The combination of 16 vertical$ \alpha $ -detector strips and 4$ \gamma $ -detectors allowed obtaining 64$ \gamma $ -ray emission angles in the range from 17° to 89°. The weighted average$ \gamma $ -ray emission angle and neutron incidence angle were determined by Monte Carlo simulations for each detector-strip combination.The experimental procedure included separate measurements with each sample, as well as measurements without a sample and with an empty container (for SiO2, CaO and Cr2O3 samples) to account for time-of-flight dependent background. The core of the data acquisition system was a 128-channel waveform digitizer with a sampling rate of 100 MSamples/sec and 16-bit analog-to-digital converter (ADC) resolution. Signals from each
$ \alpha $ -detector strip and each scintillation detector were digitized. At the digital signal processing stage, the main characteristics of each signal were determined, including its time-stamp, amplitude, and pulse area, which is proportional to the light output in the case of scintillation detectors. Then, from the entire event array, coincidences between signals from the$ \alpha $ -detector and$ \gamma $ -ray detectors were selected, and subsequently time and amplitude distributions were constructed for each detector-strip combination. The time-of-flight was estimated as the time difference between signals from the$ \gamma $ -detector and$ \alpha $ -detector. The obtained spectra served as the basis for subsequent processing.Measurements with each sample under investigation lasted approximately 24 hours. An additional experiment was conducted to estimate potential loss of events due to pulse pileups and dead time at count rates close to the experimental ones (4000-7000 events per second). A 60Co
$ \gamma $ -ray source was placed near each LaBr3:Ce detector such that the count rate did not exceed the background by more than a factor of 1.5. Two sequential measurements were then performed for each detector. In the first, the 60Co spectrum was measured alone, and then with an additional PuBe source placed close to the detector to raise the total count rate to at least 10000 events per second - exceeding the maximum rate encountered during the actual measurements. Then, from the measured spectra, the area of the full-energy absorption peaks for the 1173 and 1332 keV (60Co) lines were obtained. The fraction of lost events was estimated as the relative difference between the peak areas obtained in measurements with and without the PuBe source, over the same time period. The contribution of such events was less than 1%, which was comparable to the statistical uncertainty of the peak area determination.The contribution of pileups for the
$ \alpha $ -detector under the experimental conditions was no more than 2%, and their influence was additionally suppressed using an upper amplitude threshold. At the same time, dead time in the$ \alpha $ -channels did not significantly distort the results, as a reduction in registered$ \alpha $ -particles led to a corresponding decrease in both the tagged neutron flux and the coincident$ \gamma $ -rays. -
Examples of one-dimensional time-of-flight (TOF) distributions for measurements with a titanium sample and without a sample are shown in Fig. 2.
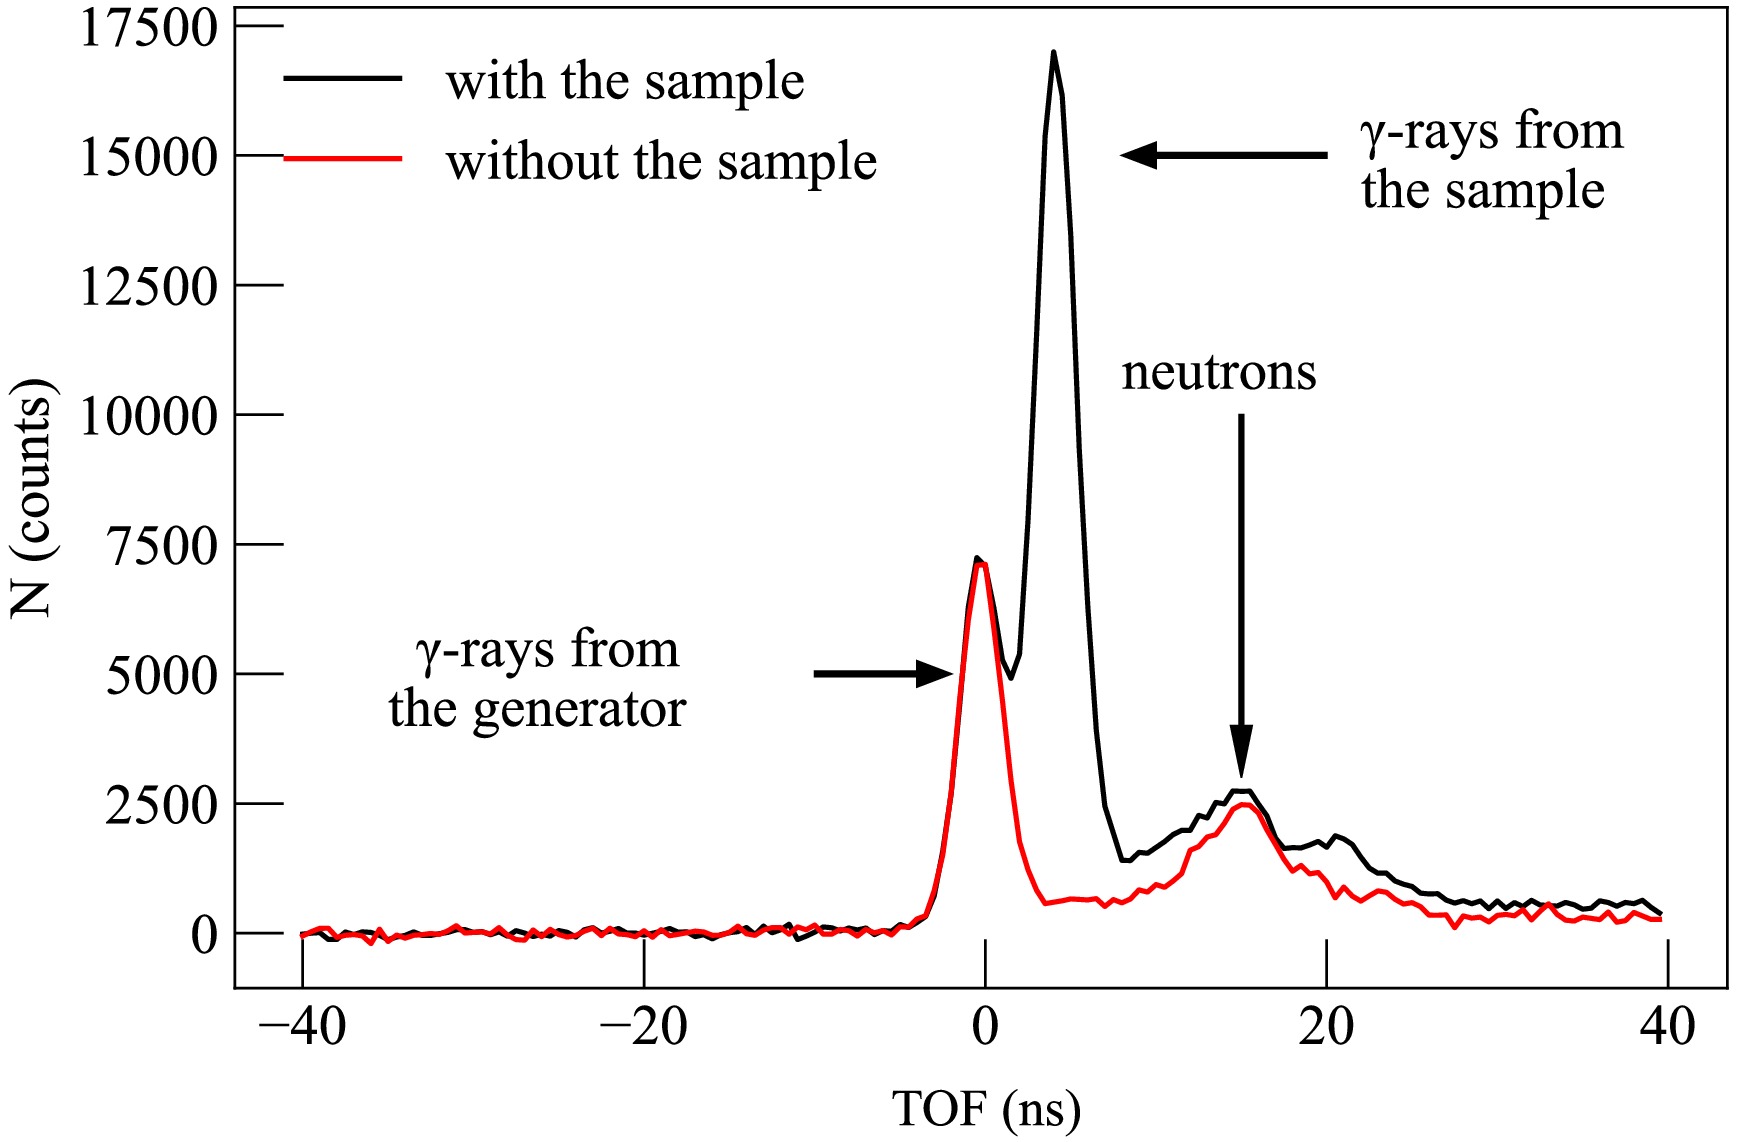
Figure 2. (color online) An example of one-dimensional TOF distributions for measurements with and without a titanium sample, corresponding to the combination "first strip – first detector" (scattering angle 54°). The TOF distributions are shown after a channel-by-channel substruction of random coincidences.
As can be seen from the figure, the spectrum corresponding to the measurement with the sample shows three groups of events, which can be separated by TOF. The first group corresponds to the emission of prompt
$ \gamma $ -rays from reactions induced by fast neutrons in the tritium target surroundings (substrate and generator housing), the second group corresponds to the detection of$ \gamma $ -rays resulting from reactions in the sample, and the third group corresponds to neutrons scattered in the sample and generator that hit the gamma detector. In the case of measurements without a sample, only two groups of events are observed, corresponding to prompt$ \gamma $ -rays from the generator and scattered neutrons. At the first stage of spectrum analysis, the random coincidence background was subtracted for all detector-strip combinations. For this purpose, an amplitude spectrum was built in the TOF window corresponding to$ \pm3\sigma $ from the sample peak position, from which the random coincidence amplitude spectrum constructed in the window from -250 ns to -50 ns was subtracted, taking into account the time window width. This procedure was performed both for spectra obtained from measurements with and without the sample. At the next stage, one-dimensional amplitude spectra were constructed for the same time windows for measurements with the sample and corresponding measurements without the sample. Examples of such spectra are shown in Fig. 3. The background amplitude spectra were subtracted from the spectra measured with the sample, taking into account the difference in the number of registered$ \alpha $ -particles and the effect of shielding the$ \gamma $ -background from the generator by the sample. The latter was estimated by GEANT4 simulations. Thus, spectra corresponding to the registration of only$ \gamma $ -rays from the sample were obtained.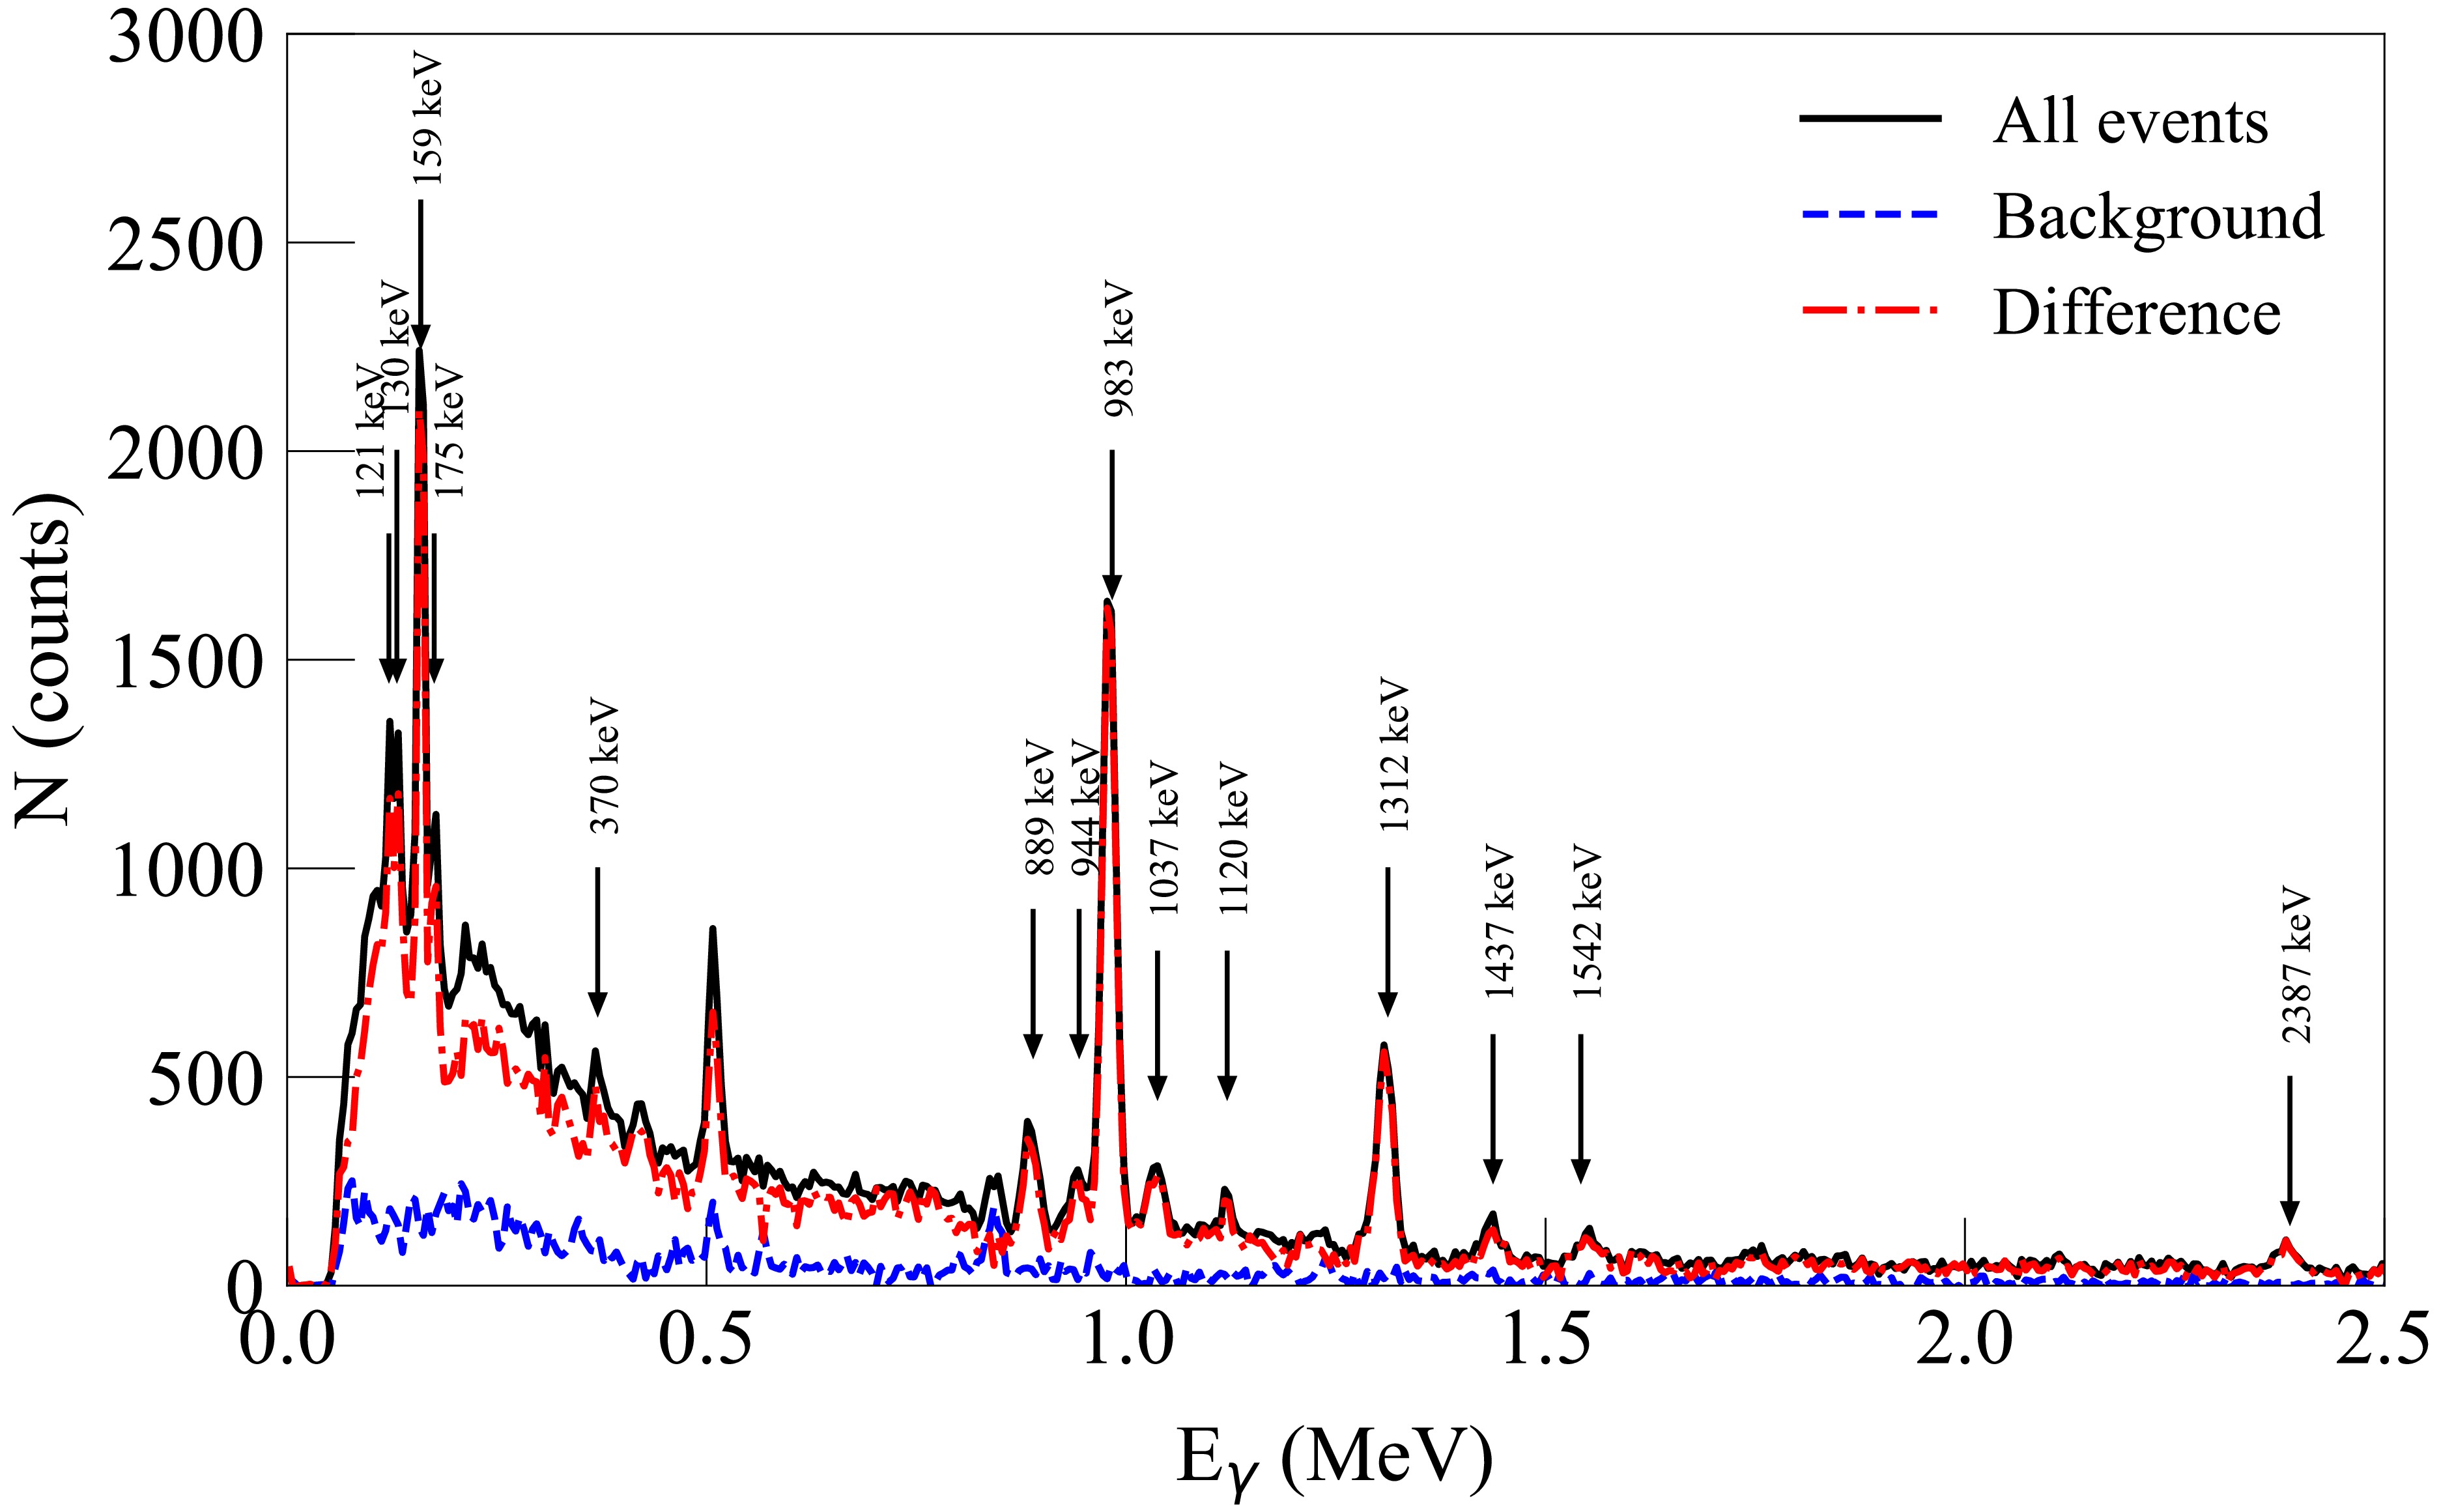
Figure 3. (color online) An example of amplitude spectra before and after background subtraction, corresponding to the combination "first strip – first detector" (scattering angle 54°). The presented spectra correspond to measurements with the titanium sample, without the sample, and their difference, constructed for the time window of
$ \pm3\sigma $ from the sample peak position on the TOF scale. The amplitude scale is calibrated in units of$ \gamma $ -ray energy. The$ \gamma $ -ray energies shown in the figure correspond to the experimentally observed$ \gamma $ -transitions in titanium nuclei.After that, the spectra were decoded, full-energy absorption peaks corresponding to the expected transitions in the studied nuclei were identified according to information from the RIPL-3 database [87] and ENSDF [88]. The areas of these peaks were determined from a Gaussian function fit with a linear substrate.
-
The differential cross-section of
$ \gamma $ -ray emission was calculated according to the following expressions:$ \frac{d\sigma}{d\Omega}(\theta) = \frac{N_p(\theta)\cos\xi}{4 \pi N_{\alpha} n_{nucl} k} \cdot 10^{27} \left[\frac{\rm{mb}}{\rm{sr}}\right], $

(1) $ k = k_{na} \int\limits_{0}^{x_0} \epsilon(x) k_{ms}(x) k_{\gamma\alpha}(x) dx, $

(2) where
$ N_p $ is the full-energy peak area corresponding to the current detector-strip combination;$ N_{\alpha} $ is a number of registered$ \alpha $ -particles from the 3H$ (d,n)^4 $ He reaction for the current strip, corresponding to the number of emitted tagged neutrons;$ n_{nucl} $ is a surface density of nuclei that induced reactions, which lead to formation of the$ \gamma $ -peak;$ \xi $ is an average angle of neutron incidence on the sample for the current strip; k is an integral correction accounting for attenuation of the tagged neutron beam in the neutron generator$ k_{na} $ , total detection efficiency$ \epsilon $ , contribution of$ \gamma $ -rays resulting from multiple neutron scattering in the sample$ k_{ms} $ , and absorption or energy change of$ \gamma $ -rays due to interactions in the sample$ k_{\gamma\alpha} $ ;$ x_0 $ is the sample thickness. The average incidence angle of the primary neutrons varied from 14° for the strip closest to the sample center to 28° for the outermost strips. This resulted in a 10% variation in the effective sample thickness for the central and outer strips. Expression (2) allows proper consideration of changes in total detection efficiency and other corrections depending on the depth x at which the interaction occurred in the sample. It should be noted that the cross sections obtained in our work are given for$ \gamma $ -lines attributed to a specific isotope or, in cases where the observed peak contains unresolved lines from several isotopes, for the sum of these isotopes. Accordingly, for each observed line, the surface density of nuclei$ n_{nucl} $ in formula (1) was calculated taking into account the abundance of all isotopes of each element whose reactions could contribute to the formation of the studied photopeak:$ n_{nucl} = \sum\limits_{0}^{I} a_i c_i, $

(3) where c is the concentration of a specific isotope in the natural mixture on which the reaction occurs producing the target
$ \gamma $ -ray line,$ a_i $ is the coefficient representing amount of considered element in the empirical formula of the substance and I is a number of reaction channels that may contribute to formation of the discussed photopeak.The correction for absorption of primary neutrons in the target substrate (2 mm copper, tilt angle 45°) and the neutron generator wall (1.5 mm steel) was calculated in a separate GEANT4 [89, 90] simulation for each strip. The calculation results showed that the number of neutrons reaching the sample decreases by 9% compared to the number emitted, due to absorption and large-angle scattering. Meanwhile, approximately 1.5-2% of the total neutrons reaching the sample have energies below 14 MeV. However, additional calculations demonstrated their negligible contribution to the total yield of emitted
$ \gamma $ -rays. The typical values of neutron attenuation in the sample was 4-5% for SiO2, 7-8% for Ti and Cr2O3 and 11-12% for Fe. It should be noted that the difference in fraction of attenuated neutrons for central and outer strips was about 1% for each sample.The product of the total
$ \gamma $ -ray detection efficiency$ \epsilon $ and the$ \gamma $ -ray attenuation coefficient$ k_{\gamma a} $ as a function of depth in the sample was calculated using the Monte Carlo method in GEANT4 individually for each strip-detector combination. It was determined as the ratio of emitted$ \gamma $ -rays to registered full-energy peak events. A distinctive feature of this procedure was that$ \gamma $ -rays were emitted from the sample region corresponding to a specific strip, while accounting for the decreasing probability of$ \gamma $ -ray emission with increasing depth due to absorption of primary tagged neutrons. To validate the simulation procedure and estimate the associated uncertainties, several additional experiments were performed. The total detection efficiency for$ \gamma $ -rays for a point source was measured using standard$ \gamma $ -ray isotopic sources (22Na, 60Co, 137Cs, 133Ba, 228Th) with known activity (4% uncertainty). The sources were positioned at the center of the Ti sample front plane. The geometry of the sample and detector arrangement was the same as in the main experiment. Using these sources, the detection efficiency was obtained for the$ \gamma $ -ray energy range of 0.08 - 2.614 MeV and subsequently compared with simulation results. The average deviation between the experimental points and the model curve was about 5%, which was close to the uncertainty of the activity of the sources. This value was subsequently used as an estimate of the efficiency uncertainty in the low$ \gamma $ -ray energy region (up to 3.0 MeV), assuming that the uncertainty in the calculated efficiency is the same for a point source and an extended one.A second experiment measured the relative detection efficiency for high-energy
$ \gamma $ -rays. In this setup, a 5-liter container filled with concentrated NaCl solution was placed at the sample position. A 239PuBe neutron source was inserted to the center of this container. Some neutrons from the source were thermalized and subsequently captured by chlorine nuclei in the solution. Analysis of the measured spectra identified the most intense$ \gamma $ -lines above 3 MeV, corresponding to transitions in 36Cl nuclei at 7.413, 7.79, and 8.578 MeV (energy values from the prompt$ \gamma $ -ray database [91]). Key selection criteria required these lines to be free from single/double escape peak interference from higher-energy$ \gamma $ -rays. Contributions from 16O$ (n,\gamma)^{17} $ O and 37Cl$ (n,\gamma)^{38} $ Cl reactions were considered negligible due to extremely small cross-sections. The 1.951 and 1.959 MeV lines served as reference transitions in the$ 0.1-3 $ MeV range where efficiency could be verified using isotopic sources. The relative detection efficiency was then determined using the equation:$ \epsilon_{relative}(E) = \frac{N_p(E)k(E)Y(1.951\; {\rm{MeV}})}{N_p(1.951\; {\rm{MeV}})k(1.951\; {\rm{MeV}})Y(E)}, $

(4) where
$ N_p $ is the area of the full-energy peak for the corresponding$ \gamma $ -ray energy, k is a correction accounting for$ \gamma $ -ray absorption in the source volume, and Y is a yield for a specific$ \gamma $ -ray line. The yield values and their uncertainties were also taken from the IAEA database [91]. The efficiency values obtained in this way were added to the results of measurements with isotopic sources after normalization. Additional Monte Carlo simulations did not show any significant distortion of the efficiency curve shape between the point source and the PuBe+NaCl volumetric source, meaning that the renormalization performed at approximately 2 MeV allows the two efficiency curves, obtained under different conditions, to be combined. The results of comparing the simulated and experimental efficiency for one of the detectors are shown in Fig. 4. As can be seen from the figure, the simulation results generally agree with the experimental data within the measurement uncertainties. The uncertainty for the high-energy part of the spectrum (above 3 MeV) was estimated by comparing the results of simulations using various sets of electromagnetic physical processes in GEANT4. The maximum difference between them did not exceed 10%, which was accepted as the upper estimate of the efficiency uncertainty in this energy range. It is worth noting that the efficiency obtained using a point source was used only to verify the simulation model, while the final detection efficiency values used in eq. (1)-(2) were obtained from GEANT4 Monte Carlo simulations individually for each detector-strip combination. The calculations took into account the size and spatial position of the region in the sample corresponding to a specific strip from which$ \gamma $ -rays were emitted.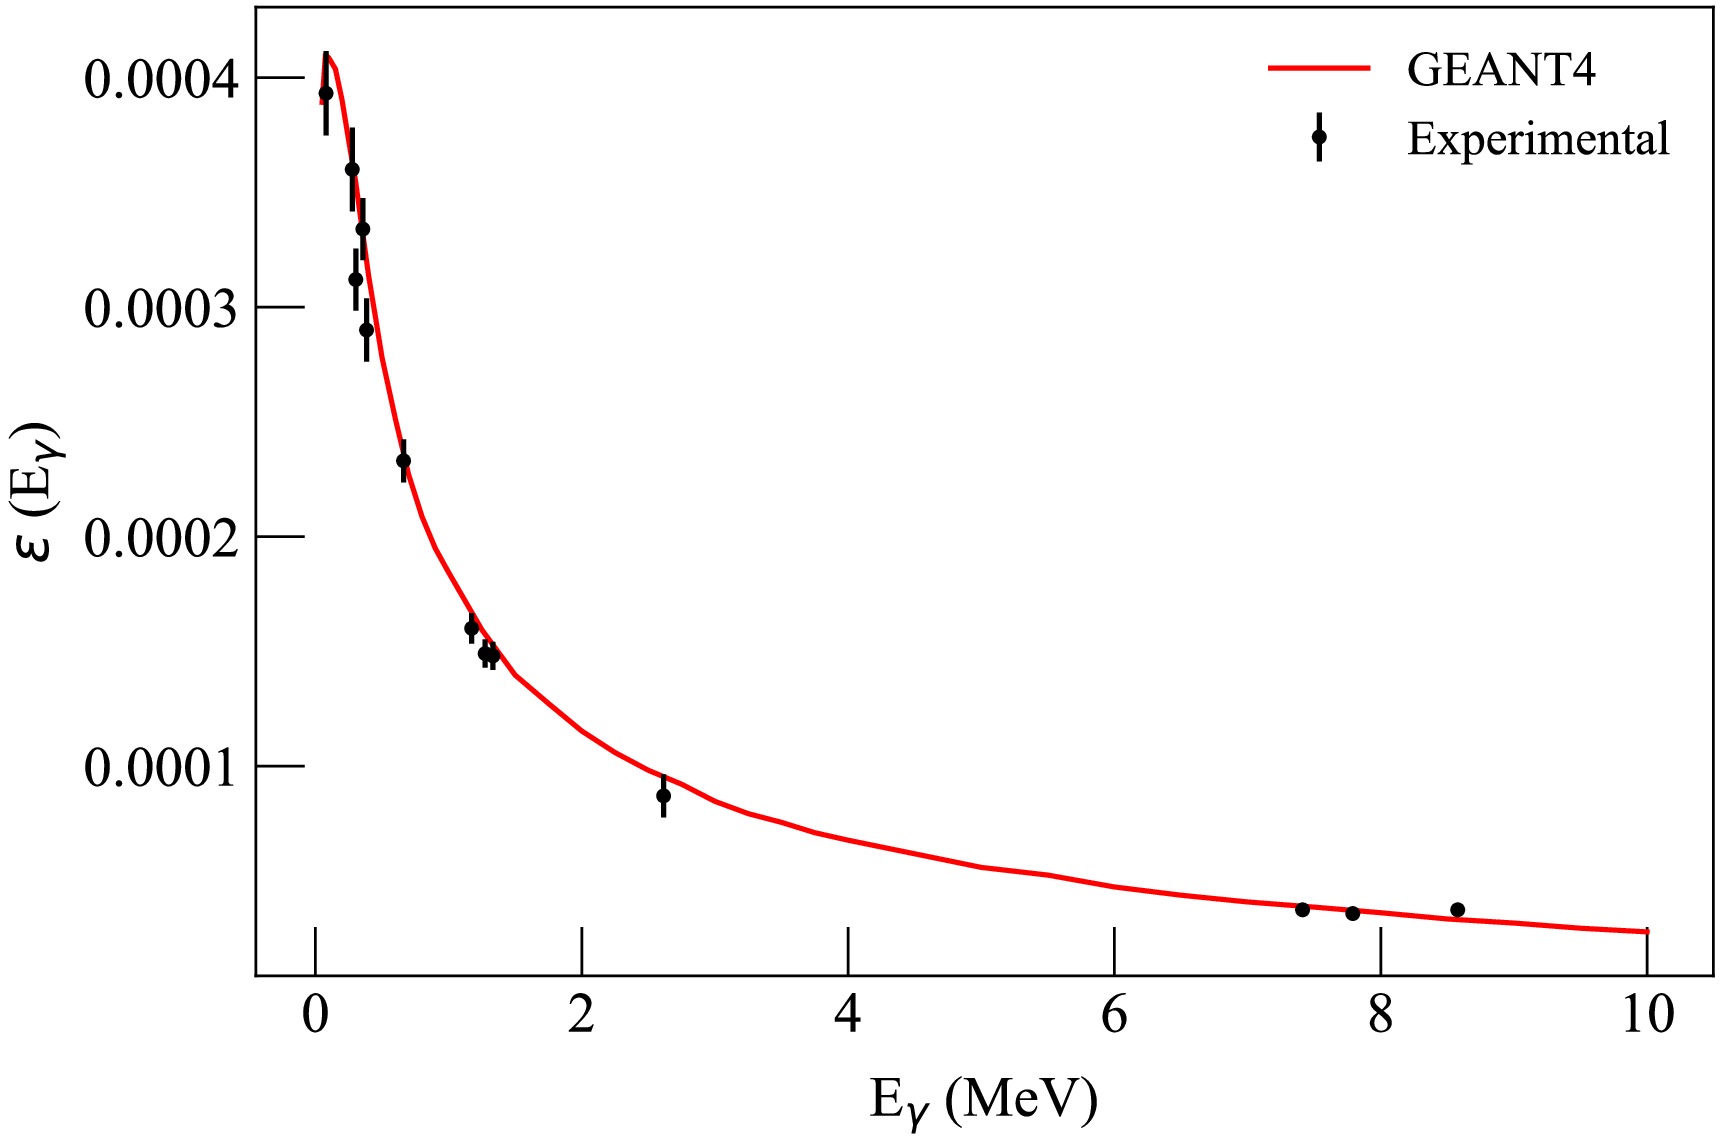
Figure 4. (color online) Comparison of experimental and calculated full-peak detection efficiency for one of the LaBr3(Ce) detectors.
To verify the accuracy of the attenuation coefficient calculation, a series of additional measurements was performed with 137Cs and 60Co sources. In these measurements, the sources were placed at the center of iron and titanium samples on the side opposite to the detectors. A measurement was also performed with a dummy sample made of thin polystyrene foam, placed in such a way as to maintain the geometry of the detector and source arrangement. The attenuation coefficient for a specific
$ \gamma $ -ray line was calculated as the ratio of the full-energy peak area with the sample to the corresponding peak area without the sample. Comparison of the obtained results with GEANT4 simulation results showed that the difference between experiment and calculation does not exceed 2% in all cases. It is worth noting that, despite the relatively narrow energy range, in which the attenuation verification was performed (¡<1.5 MeV), additional Monte Carlo simulations in GEANT4 showed that the contribution of attenuation in the sample decreases by a factor of 2-3 with increasing energy from 1.5 to 7.0 MeV, which allowed us to accept the obtained contribution to the total error (2%) as the upper limit for the entire energy range.Separately, a simulation of the coefficient
$ k_{ms} $ was performed, which accounted for multiple neutron scattering in the sample with subsequent generation of secondary$ \gamma $ -rays. Direct calculation of this correction in GEANT4 is extremely difficult, primarily due to the inability to account for the influence of$ (n,2n) $ reactions, since GEANT4 does not model the residual nucleus and its de-excitation for this reaction channel. To partially solve this problem, a two-stage calculation was performed. At the first stage, GEANT4 simulated the transport of neutrons emitted from the generator target through the sample. Here, the sample model was divided into thin layers, and neutron spectra were calculated for each layer. In general, the correction$ k_{ms} $ for$ \gamma $ -rays with the required energy was calculated as the ratio of the calculated number of$ \gamma $ -rays generated by all neutrons$ N_{\gamma}^{tot} $ to the number generated only by primary neutrons$ N_{\gamma}^{i} $ , according to the following expression:$ k_{ms}(x) = \frac{N_{\gamma}^{tot}(x)}{N_{\gamma}^{i}(x)} = \frac{ \sum\limits_{0}^{L} \int\limits_{0}^{14.1} F(E,x) n_j \sigma_j(E)dE}{\sum\limits_{0}^{L} F(14.1\; {\rm{MeV}},x) n_j \sigma_j (14.1\; {\rm{MeV}}))}, $

(5) where x is the depth in the sample; L is the number of reaction channels leading to the emission of
$ \gamma $ -rays with the required energy;$ F(E,x) $ is the number of neutrons with energy E at depth x;$ \sigma_j(E) $ is the cross-section of$ \gamma $ -ray emission with the required energy induced by neutrons with energy E for the j-th reaction channel;$ n_j $ is the surface density of atoms of the isotope on which the j-th reaction occurs. The energy dependences of the emission cross-sections for the$ \gamma $ -ray energies observed in the experiment were obtained for all possible reaction channels using the TALYS-2.1 code [92] with default parameters. TALYS was chosen due to the opportunity to obtain data on the energy dependence of the$ \gamma $ -ray emission cross section for all lines observed in the experiment, taking into account a large number of excited states and all reaction channels (including$ (n,2n) $ reactions). Unfortunately, generally accepted libraries of evaluated nuclear data, such as ENDF-B/VIII.0 [93] and JENDL-5 [94], do not provide data on the partial cross sections of$ (n,2n) $ reactions, which can make a significant contribution to$ \gamma $ -ray production for multi-isotopic elements [95]. A separate issue that should be mentioned is the limited number of states for which partial cross sections of inelastic scattering are provided in standard libraries. This issue can be illustrated using the example of the main isotope of titanium, 48Ti. Thus, in ENDF-B/VIII.0, partial excitation cross sections are presented for only 18 discrete levels for inelastic scattering on this isotope. The excitation of subsequent states is considered as excitation of a "continuum" with the emission of a continuous$ \gamma $ -ray spectrum. Moreover, for a neutron energy of 14.1 MeV, the total excitation cross section of discrete levels of 48Ti in inelastic scattering (MT=51-68) is 148 mbarn with a total inelastic scattering cross section of 793 mbarn (MT=4), and the continuum excitation cross section is 645 mbarn (MT=91). The emission cross section of the most intense line with an energy of 983 keV for a neutron energy of 14.1 MeV, calculated on the basis of the data presented in ENDF on the excitation of individual 18 states taking into account cascades (the contribution of which was calculated on the basis of data from MF=12), is 144 mbarn, which is in clear contradiction with the available experimental data on the$ \gamma $ -rays emission cross section with this energy (600-800 mbarn). This information, together with the lack of data on the partial excitation cross sections for individual states of the residual nucleus in the$ (n,2n) $ reaction does not allow us to assume that the shape of the emission cross section for individual$ \gamma $ -lines can be reproduced using data from standard libraries, in contrast to calculations using TALYS (see. Fig. 5).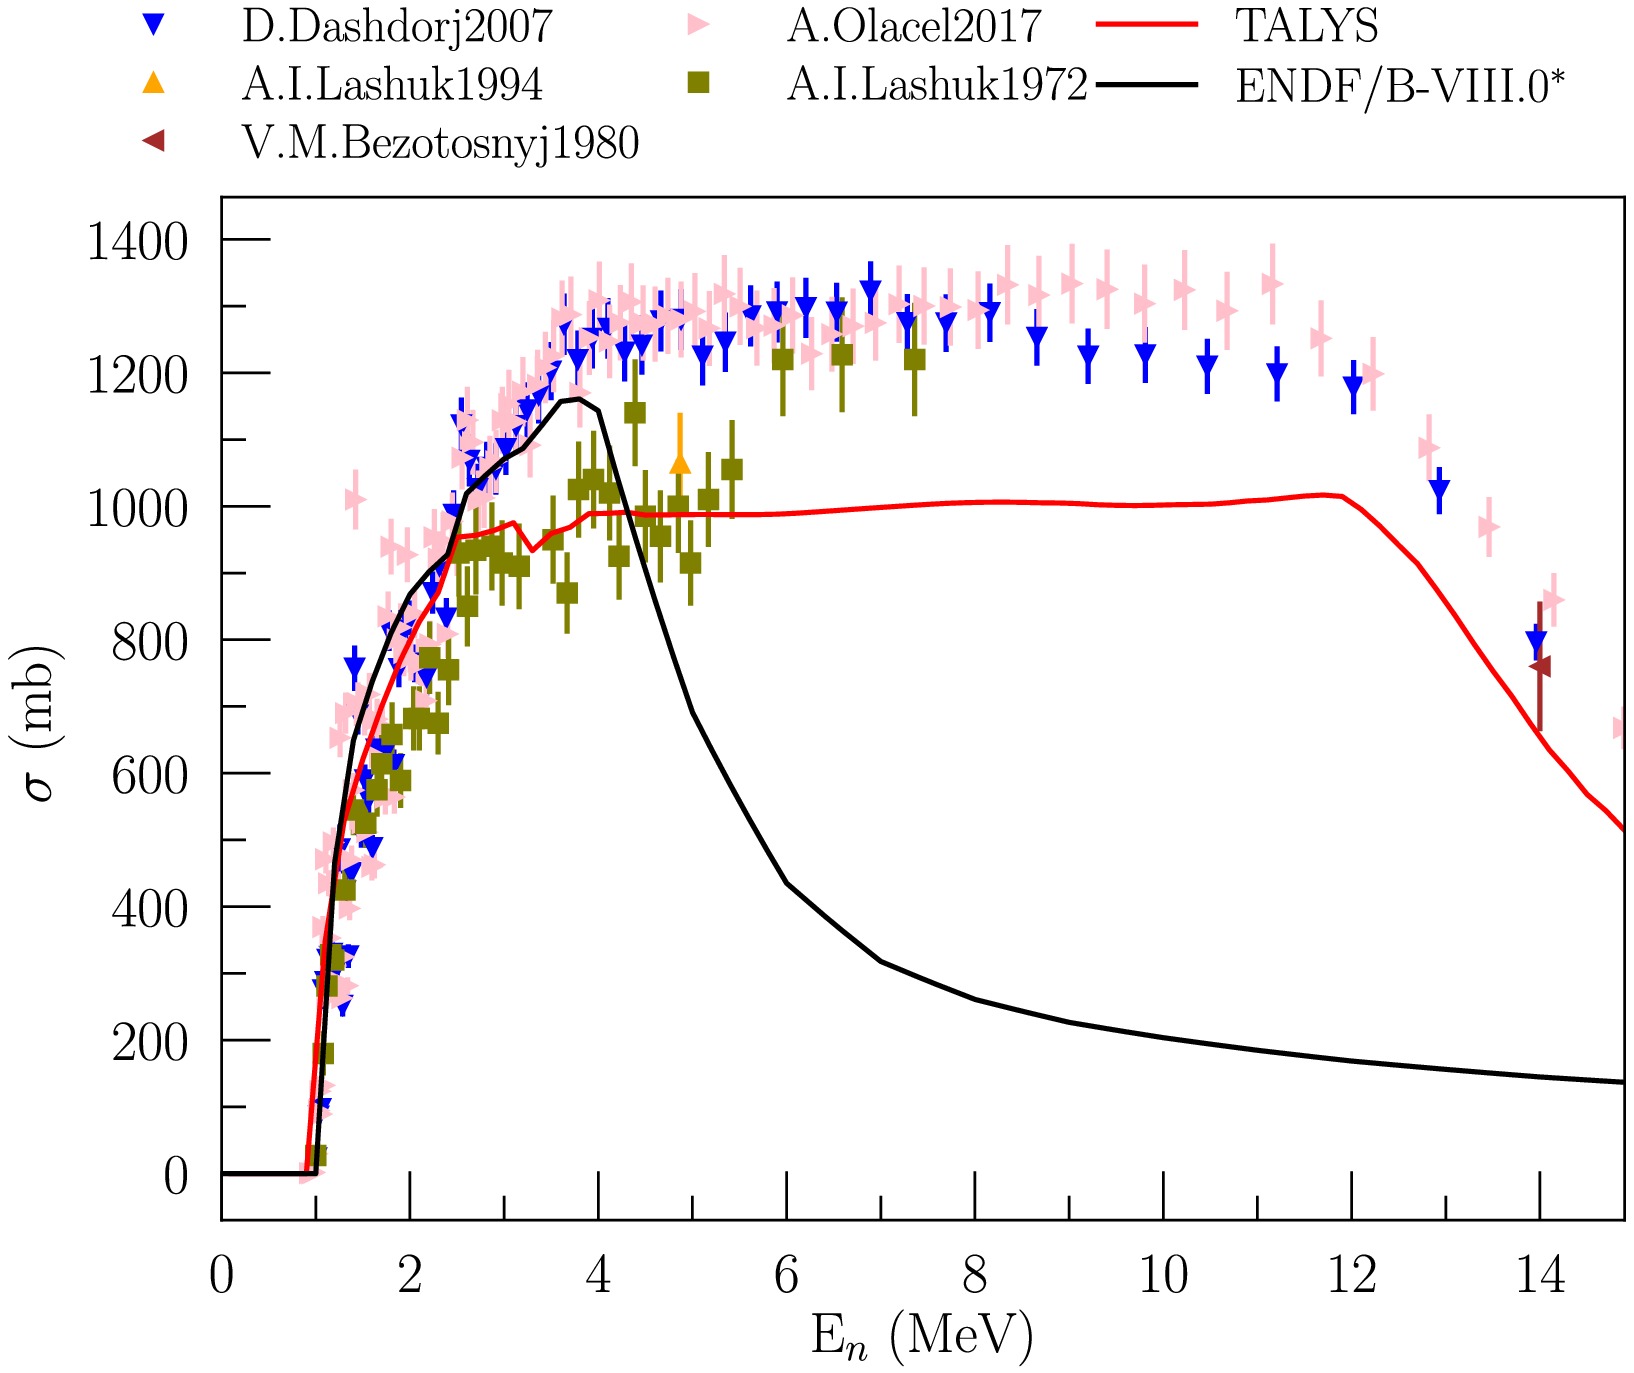
Figure 5. (color online) Emission cross-section for the 983.5 keV
$ \gamma $ -line (48Ti$ (n,n')^{48} $ Ti and 49Ti$ (n,2n)^{48} $ Ti reactions) from TALYS and ENDF/B-VIII.0 as a function of neutron energy in comparison with available experimental data. *When calculating the cross section from ENDF, only transitions from discrete states were taken into account.Moreover, as can be seen from Fig. 5 using the 983 keV line for titanium as an example, TALYS, in general, allows us to reproduce the shape of the energy dependence of the emission cross section. The difference in magnitude should not introduce a significant uncertainty in the relative calculation of the correction factor using formula (5). It is worth noting separately that in the case of carbon, for which no significant contribution from the
$ (n,2n) $ reaction was expected due to the low content of the 13C isotope and the high reaction threshold, as well as the absence of a contribution from cascade processes due to the structural features of 12C, the cross section from ENDF/B-VIII.0 was used as the basis for the calculations. The calculation results showed that the contribution of multiple scattering ranges from 5-10%, depending on the depth in the sample, for lines corresponding to transitions from low-lying states (e.g., 983 keV for titanium or 846 keV for iron) to 15-25% for some individual lines characterized by a very strong dependence of the cross-section on neutron energy, according to TALYS estimates. Fig. 6 demonstrates an example of the total correction factor k (from Eq. (5)) calculated for specific lines of titanium.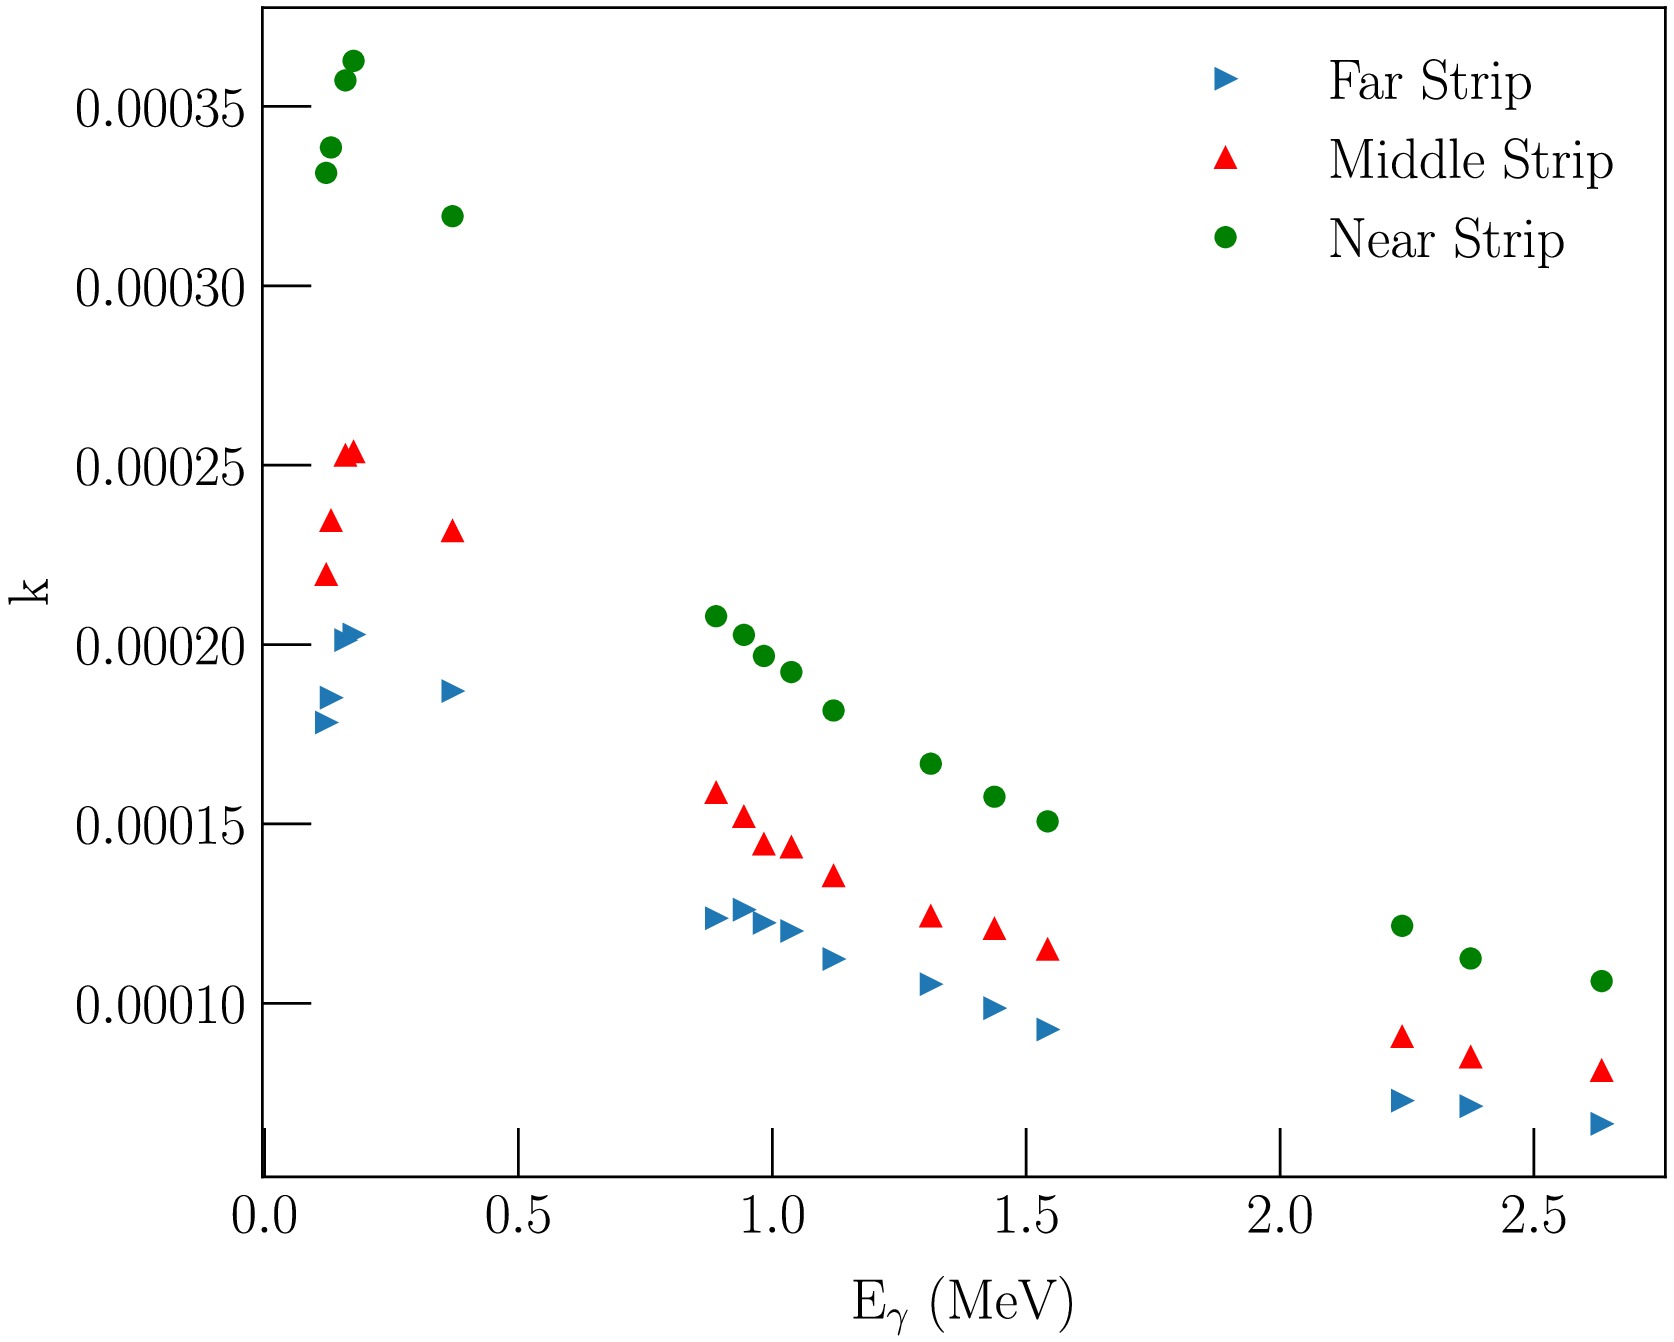
Figure 6. (color online) The total correction factor k from Eq. (1), calculated for the titanium sample for three combinations of strips (the farthest from the detector strip, the middle, and the nearest strip) with LaBr3(Ce) detector at 70°. The correction values include the full-energy peak detection efficiency, self-absorption, multiple neutron scattering, and neutron attenuation corrections.
To estimate the uncertainty of the correction factor related to the accuracy of the cross-sections provided by TALYS and ENDF, a separate series of calculations was performed using available experimental data on the energy dependence of emission cross-sections for some
$ \gamma $ -lines of C, Si, Ti, and Fe, previously measured at LANL [35] and GELINA [48, 57, 79]. The difference between the cross-sections obtained using TALYS and experimental data was used to estimate the method's uncertainty. Depending on the specific line and element, the contribution of this error was 3-7%, with 7% adopted as the upper uncertainty estimate for all lines.To verify the accuracy of the correction calculations, additional measurements of
$ \gamma $ -ray emission cross-sections were performed for iron samples of different thicknesses (3 mm and 18 mm), in addition to the 9 mm sample used in the main measurements. Among all the samples used in the measurements, iron has the highest effective Z and density, leading to the largest expected influence of neutron multiple scattering and$ \gamma $ -ray attenuation. The maximum difference between the cross-sections of the same$ \gamma $ -lines obtained for the thinnest and thickest samples did not exceed 7%, which is within the estimated systematic error of this experiment (9%, see Section 3.3).To obtain the total cross-section, the corresponding differential cross-sections calculated using formula (1) were approximated in the form of a Legendre-polynomial expansion of even order [96]:
$ \frac{d\sigma}{d\Omega}(\theta) = \frac{\sigma_{\gamma}}{4\pi} \sum\limits_{\nu=0}^{2J} a_{\nu} P_{\nu} (\cos\theta). $

(6) In this expression the coefficient
$ a_0 $ is equal to 1, and J is a multipole of the considered$ \gamma $ -transition. -
The main sources of systematic uncertainty in this experiment are given in Table 2.
Source Contribution (%) Efficiency 5 (Eγ=0−3 MeV), 10 (Eγ>3 MeV) Correction for attenuation
of$\gamma$ -rays in the sample

2 Multiple neutron scattering 7 Crosstalk correction for $\alpha$ -detector

1 Number of nuclei in the sample 2 Total 9.1 (Eγ=0−3 MeV), 12.6 (Eγ>3 MeV) Table 2. Systematic uncertainty budget in the experiment.
The total efficiency uncertainty was estimated as the average difference between efficiency values calculated in GEANT4 and experimental data. The upper limit of uncertainty associated with attenuation of secondary
$ \gamma $ -rays in the sample was determined in a separate experiment with 137Cs and 60Co sources (see section 3.2). The largest contribution to the systematic uncertainty of this experiment came from the multiple scattering correction in the sample. Its upper limit was estimated by comparing correction coefficients obtained from estimated cross-sections from TALYS code for heavy nuclei (heavier than oxygen), ENDF/B-VIII.0 library for carbon, and available experimental data from literature on energy dependence of emission of individual$ \gamma $ -lines. The uncertainty in the number of nuclei in the sample included both the uncertainty in its mass determination and the uncertainty related to purity of some samples. The total systematic uncertainty was estimated as 9%. The statistical uncertainty for differential cross-sections varied from 0.5-1% for the most intense lines to 20-30% for the least intense lines. -
The data on
$ \gamma $ -ray emission from the carbon sample are represented solely by the 4.439 MeV line (see Fig. 7 and Table 3), corresponding to the$ 2^+ \longrightarrow 0^+ $ transition in the 12C nucleus excited via the 12C$ (n,n')^{12} $ C reaction. The contribution from the 13C$ (n,2n)^{12} $ C reaction is assumed to be negligible (<1%). As shown in Fig. 7 (a), the angular distribution of 4.439 MeV$ \gamma $ -rays measured in the present work agrees within uncertainties with the data reported in Ref. [34] for angles greater than 90°, as well as with the data from Refs. [19−21, 26, 29, 30, 33], which provide measurements only for angles close to 90°. The differential cross-sections presented in Refs. [16, 22], as well as in Ref. [34] for the angular range of$ 0-90^{\circ} $ , significantly exceed the data obtained in this work, with Ref. [34] exhibiting a notable asymmetry in the angular distribution. Additionally, all experimental angular distributions reported over a wide angular range predict a significant$ a_4 $ coefficient in the Legendre polynomial expansion, whereas the evaluated data from ENDF/B-VIII.0 include only the$ a_2 $ coefficient.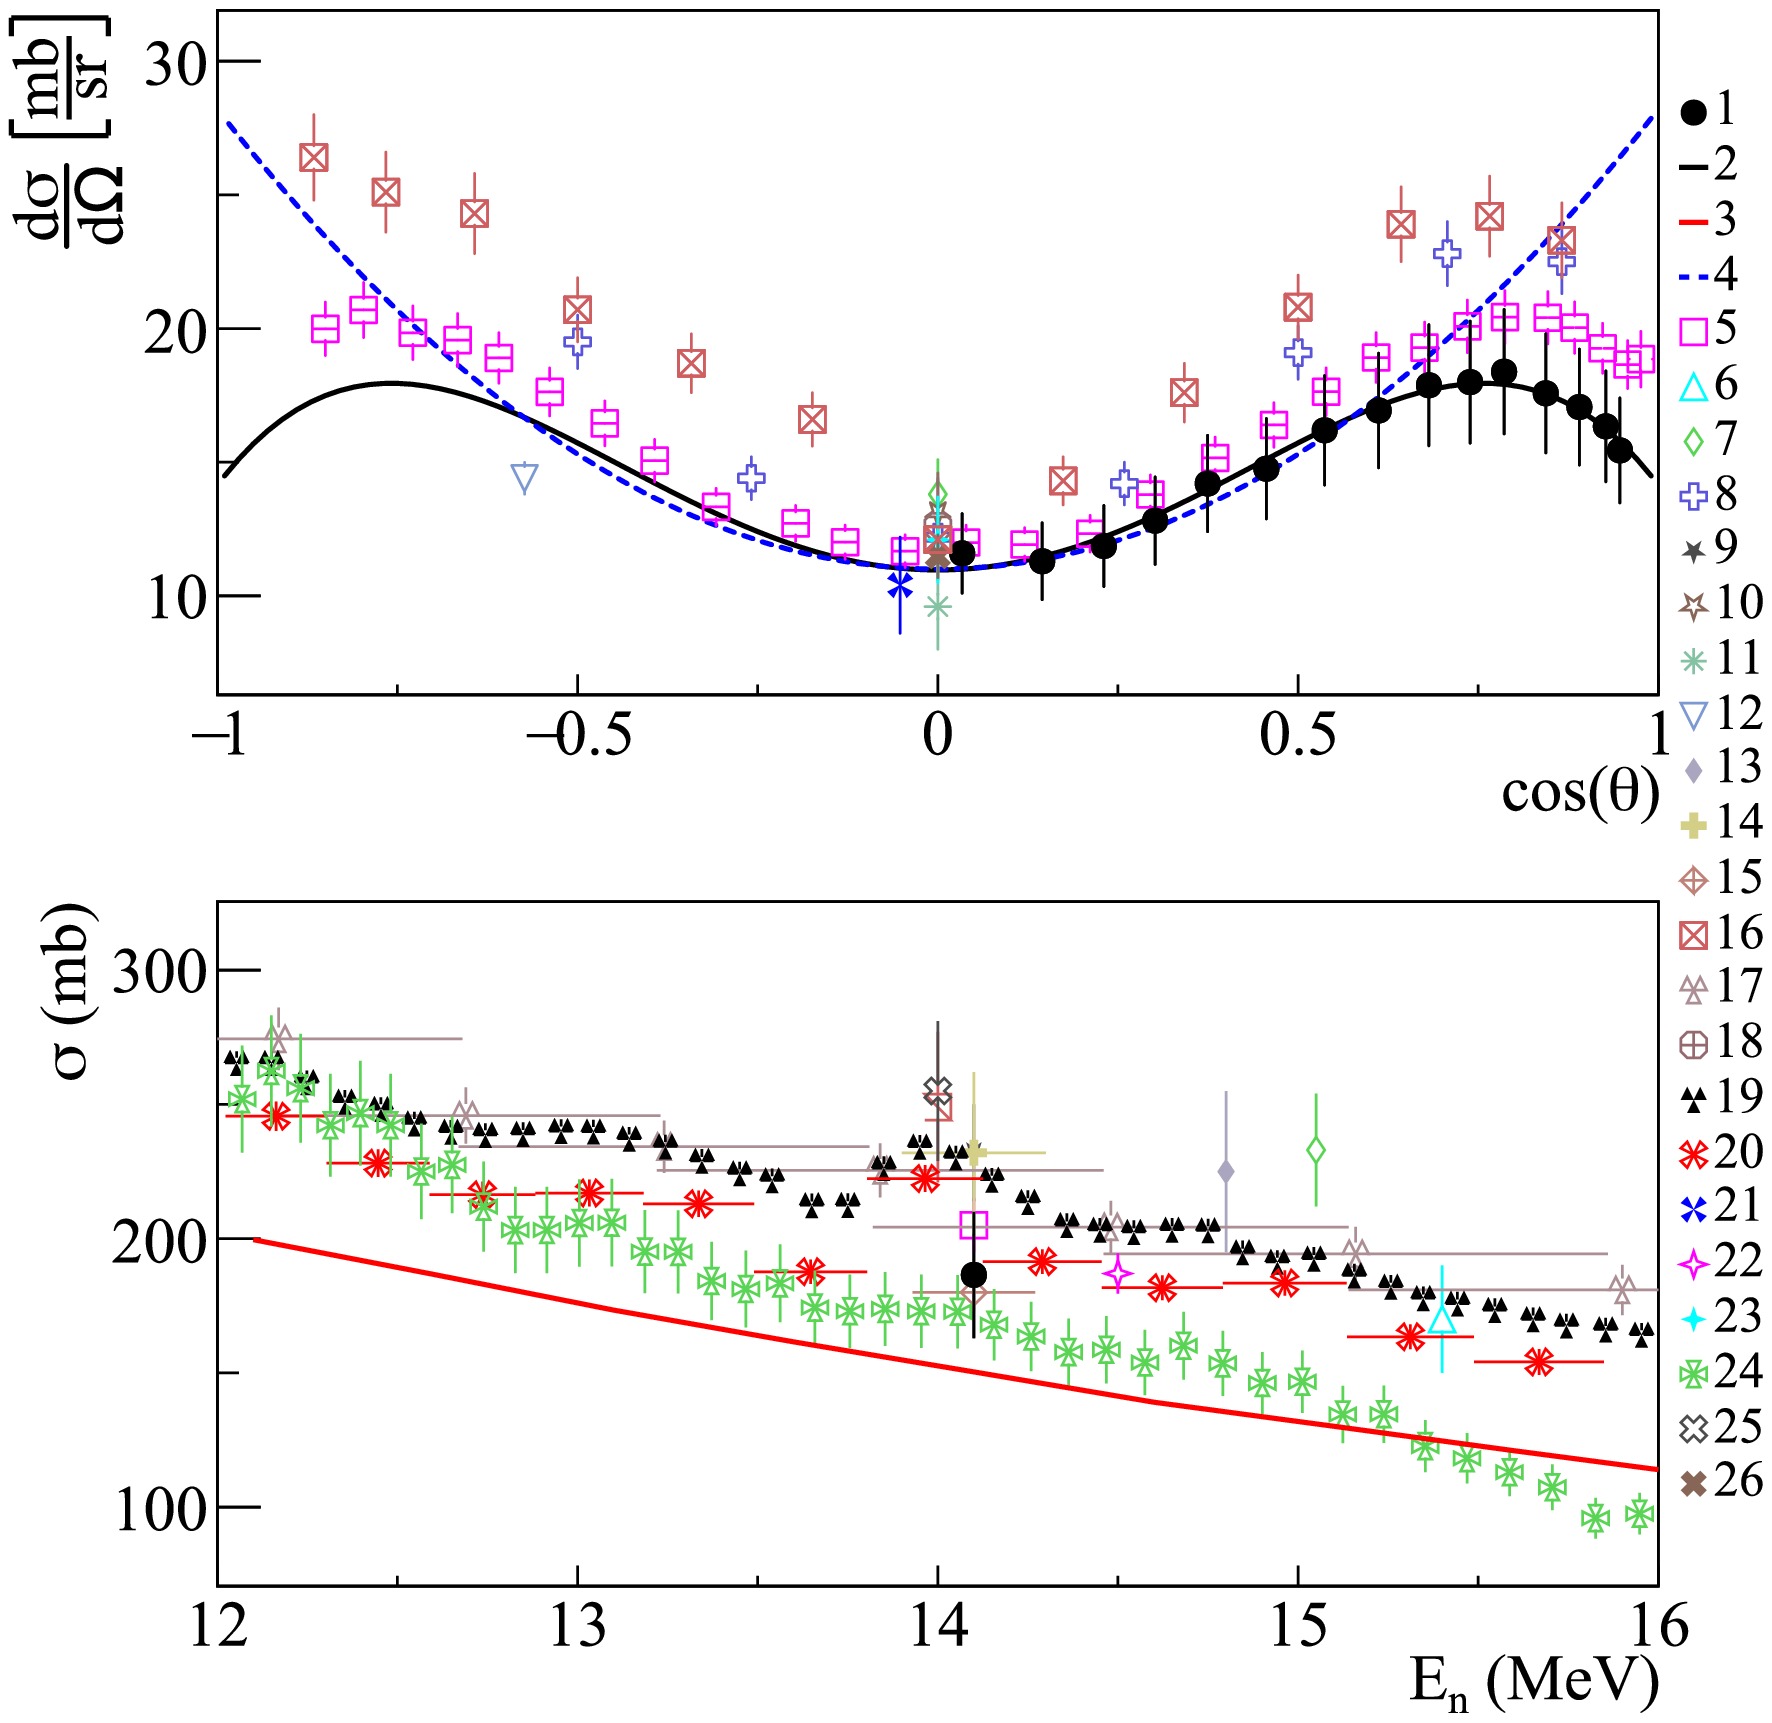
Figure 7. (color online) Differential (a) and total (b) cross sections of
$ \gamma $ -ray emission with energy 4.439 MeV from the 12C$ (n,n')^{12} $ C reaction in comparison with experimental data from other authors, evaluated cross sections from ENDF/B-VIII.0 libraries, and theoretical calculations based on the TALYS program with default parameters. 1 – data from present work; 2 – angular distribution fit from present work using Legendre polynomials; 3 – TALYS calculation; 4 – evaluated cross section from ENDF/B-VIII.0 [93]; 5 – Grozdanov2025 [38]; 6 – Lashuk1994 [31]; 7 – McEvoy2021 [33]; 8 – Spaargaren1971 [22]; 9 – Stewart1964 [17]; 10 – Engesser1967 [19]; 11 – Clayeux1969 [20]; 12 – Morgan1977 [37]; 13 – Morgan1964 [18]; 14 – Kadenko2016 [32]; 15 – Murata1988 [28]; 16 – Benveniste1960 [16]; 17 – Gordon2025 [36]; 18 – Hasegawa1991 [30]; 19, 20 – Kelly2023 [35], direct$ \gamma $ -ray measurement and correlated$ n-\gamma $ measurements; 21 – Zong1979 [26]; 22 – Simakov1998 [85]; 23 – Martin1971 [21]; 24 – Rogers1975 [23]; 25 – Bezotosnyi1975 [24]; 26 – Zhou1989 [29].As shown in Fig. 7 (b), there is also some discrepancy in the experimental data on total emission cross-sections. Specifically, the total cross-section obtained in this work is noticeably smaller (
$ \approx17 $ %) than the data from direct$ \gamma $ -ray measurements in Ref. [34] (224 mb), ($ \approx10 $ %) larger than the cross-section from Ref. [23] (173 mb), and agrees within uncertainties with the cross-sections derived from the$ n-\gamma $ correlation experiment in [35], as well as those reported in Ref. [36] and the evaluated cross-section from the ENDF/B-VIII.0 library [93] (210 mb). The cross-section values obtained in a recent experiment within the TANGRA project [38] using an array of plastic scintillation detectors are also consistent with the results presented here, both for the case where the cross-section was determined from the$ \gamma $ -ray angular distribution ($ 205\pm11 $ mb) and for the case where neutrons corresponding to the same scattering channel were detected ($ 192\pm10 $ mb). However, there is a slight difference in the Legendre polynomial expansion coefficients, though it remains within the uncertainties reported in [38]. It is worth noting separately that the results presented in [35], both for the direct measurement of the$ \gamma $ -ray emission cross-section and for the$ n-\gamma $ correlation experiment, represent relative measurements of the energy dependence of the cross-section, normalized to the ENDF/B-VIII.0 evaluated cross-section. -
The measurement results for the most intense
$ \gamma $ -ray lines emitted during the interaction of 14.1 MeV neutrons with silicon and aluminum nuclei are presented in Figs. 8 – 11 and Table 4 and 5.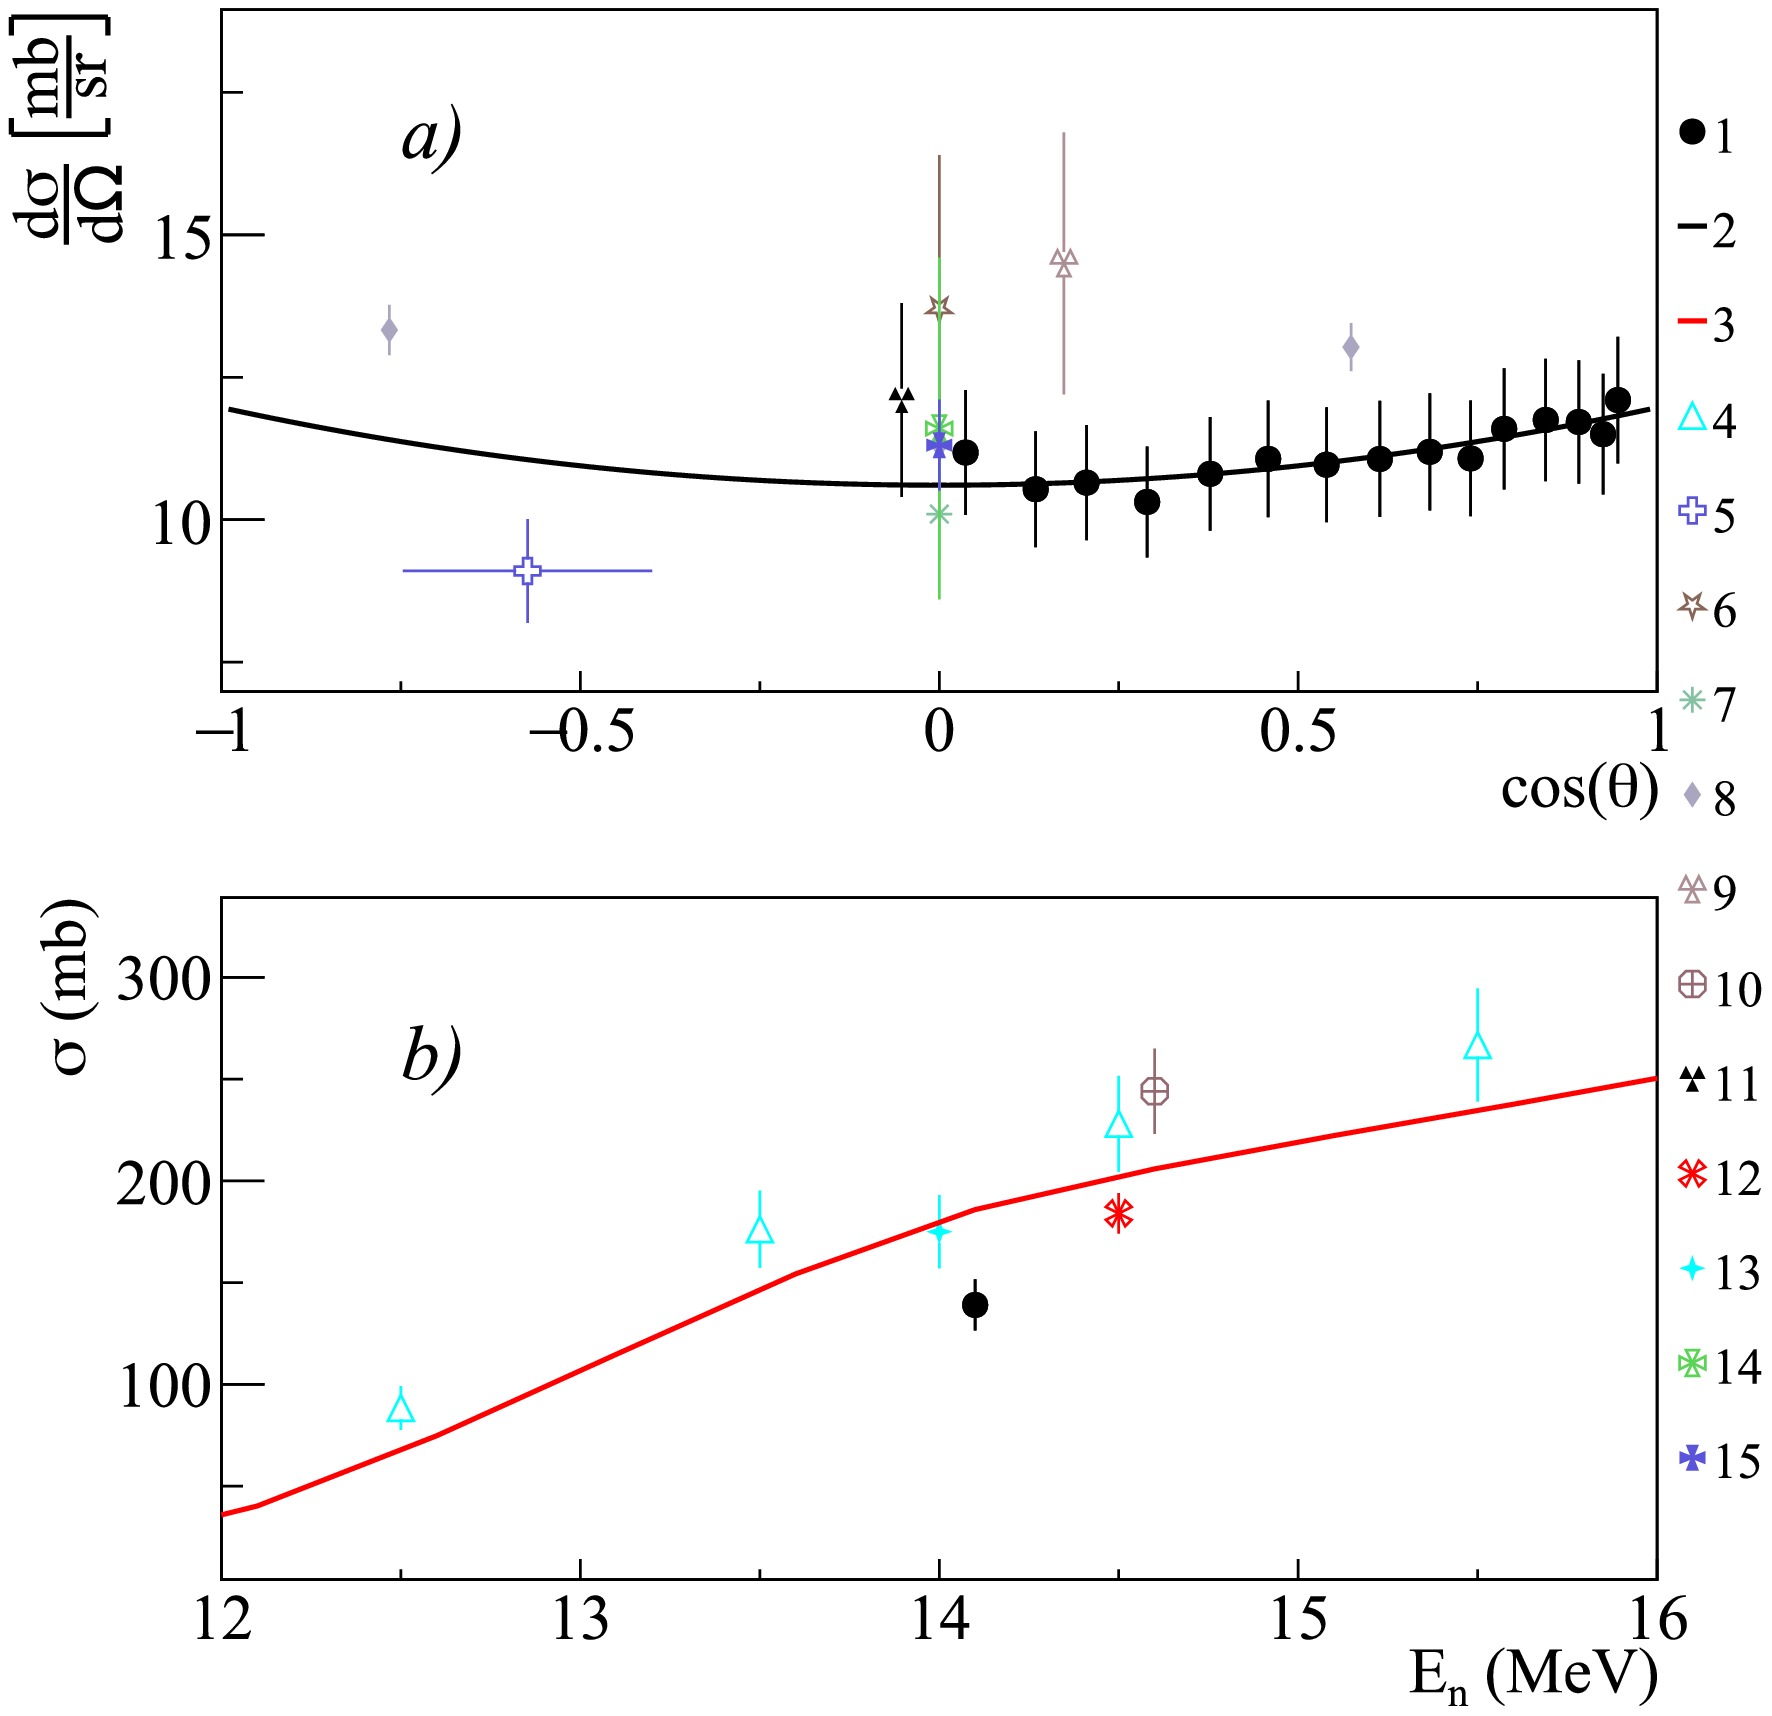
Figure 8. (color online) Differential (a) and total (b) cross-sections of 1.808 MeV
$ \gamma $ -ray emission from the 27Al$ (n,d)^{26} $ Mg reaction, compared with experimental data from other authors and theoretical calculations using the TALYS code with default parameters. 1 – present work data; 2 – Legendre polynomial fit of angular angular distribution from present work; 3 – TALYS calculation; 4 – Pavlik1998 [41]; 5 – Hoot1975 [43]; 6 – Engesser1967 [19]; 7 – Clayeux1969 [20]; 8 – Zhou1997 [44]; 9 – Nyberg1971 [45]; 10 – Hlavac1999 [42]; 11 – Zong1979 [26]; 12 – Simakov1998 [85]; 13 – Bezotosnyi1975 [24]; 14 – Bochkarev1965 [40]; 15 – Hongyu1986 [46].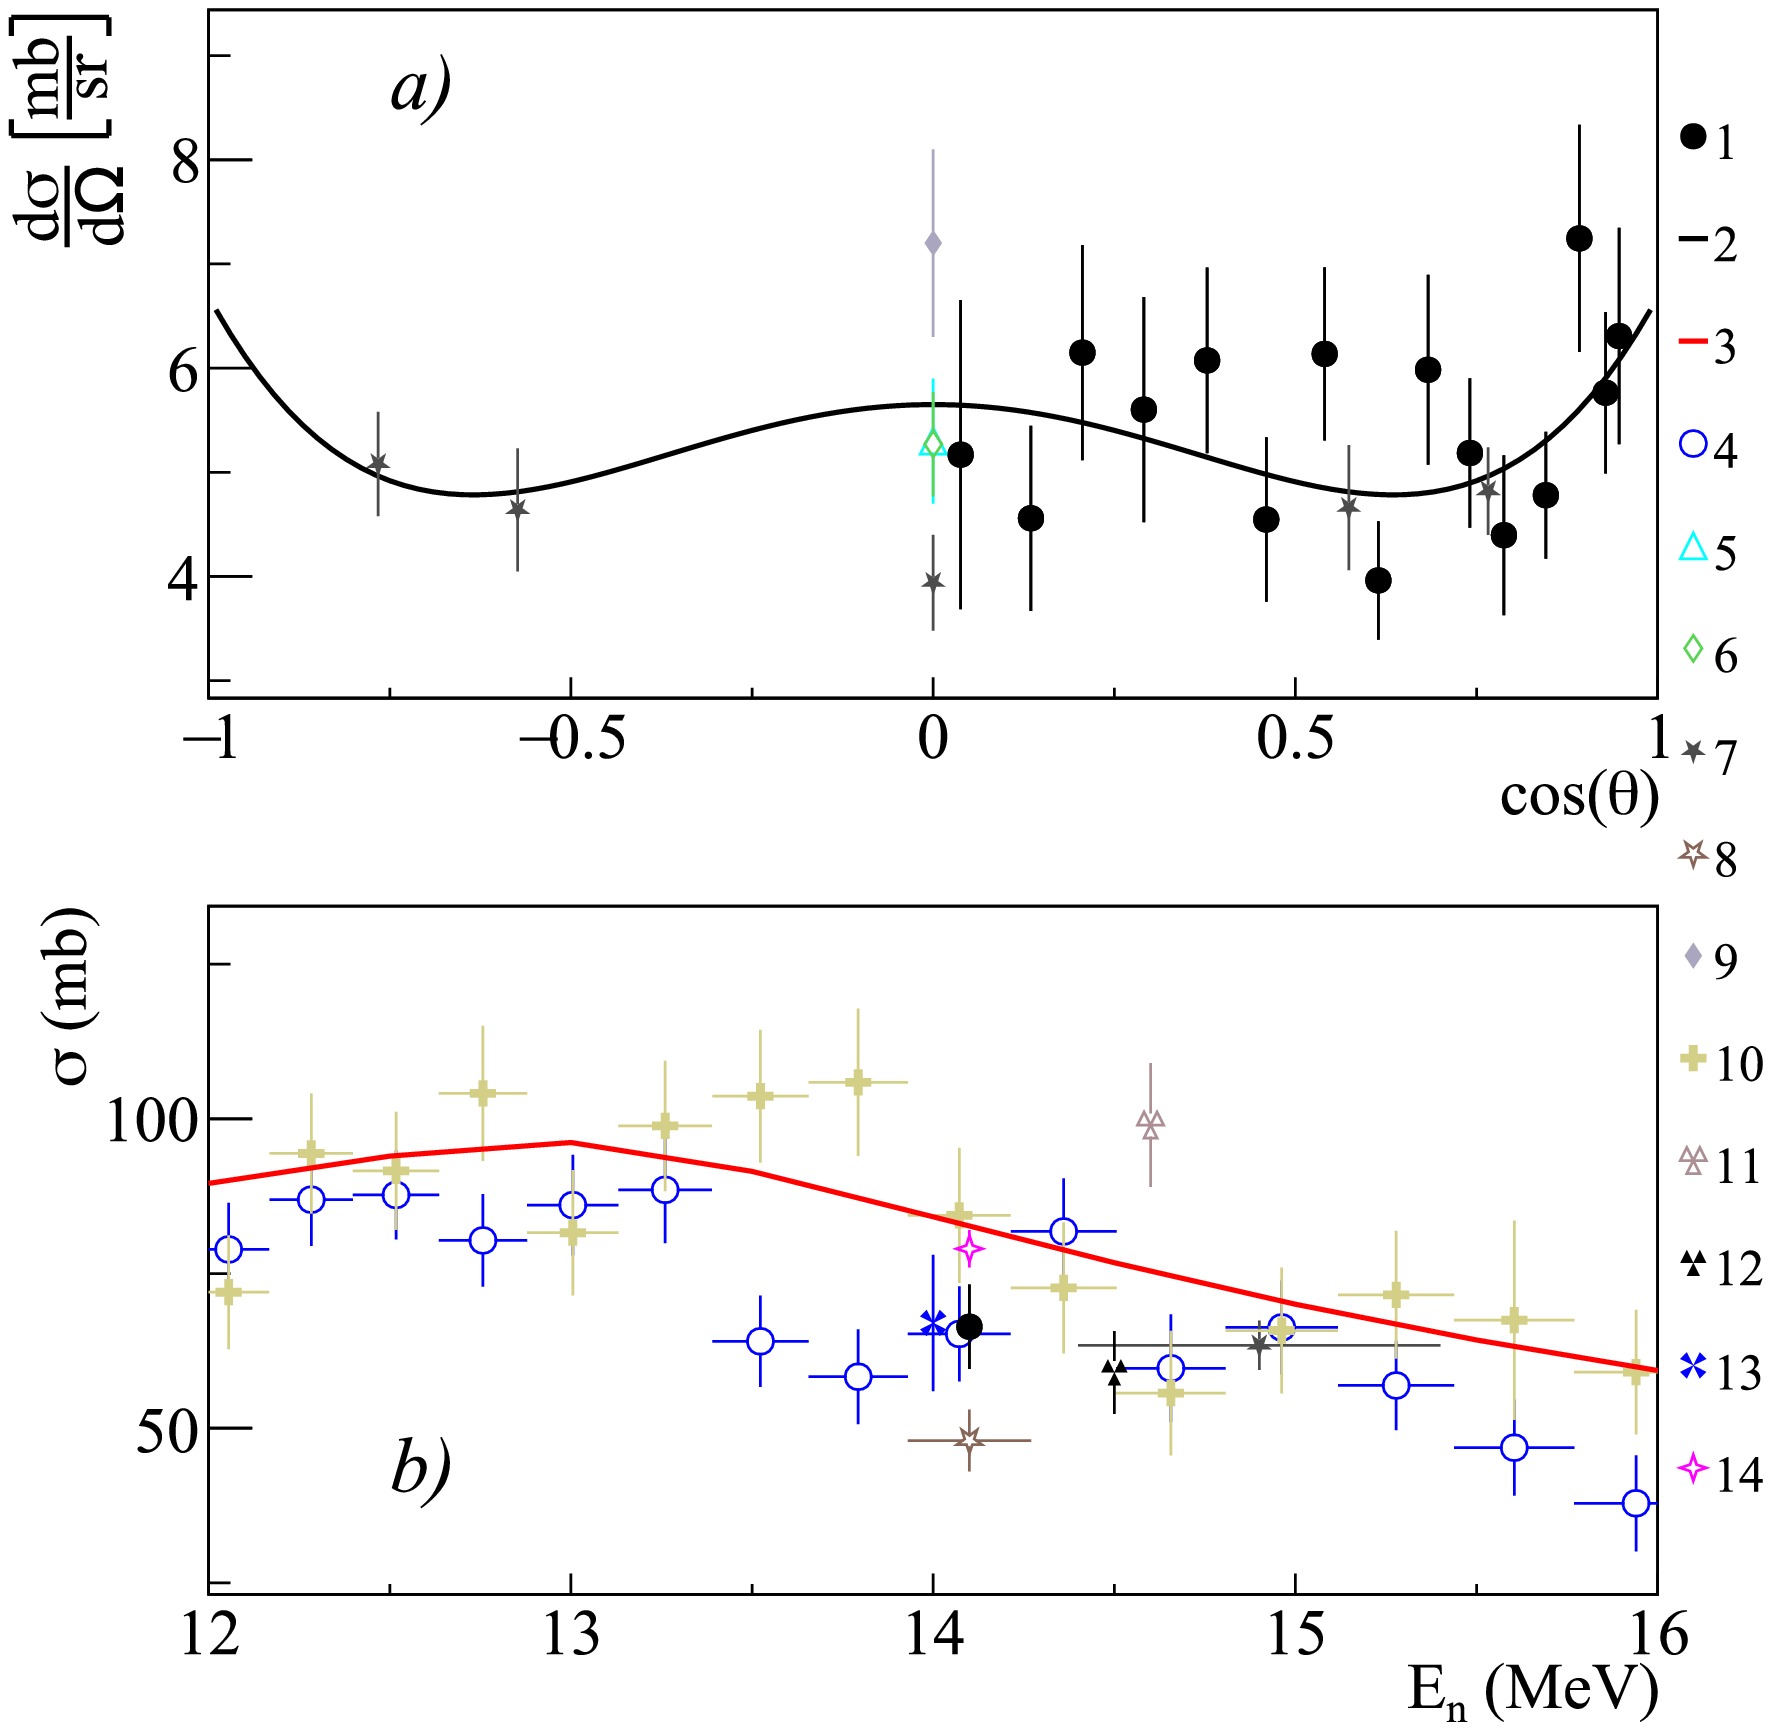
Figure 11. (color online) Differential (a) and total (b) cross-sections of 2.839 MeV
$ \gamma $ -ray emission from the 28Si$ (n,n')^{28} $ Si reactions, compared with experimental data from other authors and theoretical calculations using the TALYS code with default parameters. 1 – present work data; 2 – Legendre polynomial fit of angular distribution from present work; 3 – TALYS calculation; 4 – Negret2013 [57]; 5 – Engesser1967 [19]; 6 – Guoying1992 [54]; 7 – Zhou2011 [56]; 8 – Murata1988 [28]; 9 – Hasegawa1991 [30]; 10 – Boromiza2020 [58]; 11 – Hlavac1999 [42]; 12 – Simakov1998 [85]; 13 – Bezotosnyj1980 [53]; 14 – Kopatch2025 [14].$E_{\gamma}$ (MeV)

Reaction Transition, $E_{i}$ 

$(J_{i}^{\pi}) \rightarrow E_{f} (J_{f}^{\pi})$ 

$\sigma$ (mb)

$a_2$ 

$a_4$ 

0.091 27Al $(n,\alpha)^{24}Na$ 

$0.563(2^+)\rightarrow0.472(1^+)$ 

$42\pm4$ 

$-0.21\pm0.04$ 

$0.03\pm0.06$ 

0.792 27Al $(n,n')^{27}$ Al

$3.004(9/2^+)\rightarrow 2.212(7/2^+)$ 

$26\pm3$ 

$-0.07\pm0.07$ 

$-0.02\pm0.10$ 

0.843 27Al $(n,n')^{27}$ Al

$0.843(1/2^+)\rightarrow $ g.s.

$(5/2^+)$ 

$28\pm3$ 

$-0.24\pm0.07$ 

$0.11\pm0.10$ 

0.984 27Al $(n,p)^{27}$ Mg

$0.984(3/2^+)\rightarrow $ g.s.

$(1/2^+)$ 

$28\pm3$ 

$0.07\pm0.09$ 

$-0.07\pm0.14$ 

1.014 27Al $(n,n')^{27}$ Al

$1.014(3/2^+)\rightarrow $ g.s.

$(5/2^+)$ 

$70\pm6$ 

$0.04\pm0.04$ 

$0.04\pm0.06$ 

1.698 27Al $(n,p)^{27}$ Mg

$1.698(5/2^+)\rightarrow $ g.s.

$(1/2^+)$ 

$29\pm3$ 

$0.23\pm0.15$ 

$0.18\pm0.20$ 

1.808 27Al $(n,d)^{26}$ Mg

$1.808(2^+)\rightarrow $ g.s.

$(0^+)$ 

$140\pm13$ 

$0.08\pm0.01$ 

$-0.02\pm0.02$ 

2.212 27Al $(n,n')^{27}$ Al

$2.212(7/2^+)\rightarrow $ g.s.

$(5/2^+)$ 

$138\pm12$ 

$0.14\pm0.02$ 

$-0.03\pm0.02$ 

2.298 27Al $(n,n')^{27}$ Al

$4.510(11/2^+)\rightarrow 2.212(7/2^+)$ 

$29\pm3$ 

$0.34\pm0.04$ 

$-0.03\pm0.06$ 

3.004 27Al $(n,n')^{27}$ Al

$3.004(9/2^+)\rightarrow $ g.s.

$(5/2^+)$ 

$108\pm11$ 

$0.20\pm0.02$ 

$0.03\pm0.03$ 

Table 4. Total emission cross-sections
$\sigma$ and Legendre polynomial expansion coefficients$a_2$ and$a_4$ for angular distributions of$\gamma$ -ray lines emitted during the interaction of 14.1 MeV neutrons with aluminum nuclei. The energies of the initial (i) and final (f) states are given in MeV.$E_{\gamma}$ (MeV)

Reaction Transition, $E_{i}$ 

$(J_{i}^{\pi}) \rightarrow E_{f} (J_{f}^{\pi})$ 

$\sigma$ (mb)

$a_2$ 

$a_4$ 

0.389 28Si $(n,\alpha)^{25}$ Mg

$0.974(3/2^+)\rightarrow 0.585(1/2^+)$ 

$32\pm5$ 

$-0.25\pm0.25$ 

$-0.08\pm0.35$ 

0.585 28Si $(n,\alpha)^{25}$ Mg

$0.585(1/2^+)\rightarrow $ g.s.

$(5/2^+)$ 

$35\pm4$ 

$0.10\pm0.16$ 

$0.16\pm0.21$ 

1.622 28Si $(n,p)^{28}$ Al

$1.622(2^+)\rightarrow $ g.s.

$(3^+)$ 

$43\pm5$ 

$0.01\pm0.18$ 

$-0.27\pm0.25$ 

1.779 28Si $(n,n')^{28}$ Si

$1.779(2^+)\rightarrow $ g.s.

$(0^+)$ 

$346\pm31$ 

$0.18\pm0.02$ 

$-0.11\pm0.03$ 

29Si $(n,2n)^{28}$ Si

2.271 28Si $(n,p)^{28}$ Al

$2.271(4^+)\rightarrow $ g.s.

$(3^+)$ 

$47\pm14$ 

$0.57\pm0.70$ 

$0.54\pm0.83$ 

2.839 28Si $(n,n')^{28}$ Si

$4.617(4^+)\rightarrow 1.779(2^+)$ 

$67\pm7$ 

$0.03\pm0.10$ 

$0.23\pm0.14$ 

Table 5. Total emission cross-sections
$\sigma$ and Legendre polynomial expansion coefficients$a_2$ and$a_4$ for angular distributions of$\gamma$ -ray lines emitted during the interaction of 14.1 MeV neutrons with silicon nuclei. The energies of the initial (i) and final (f) states are given in MeV.For the aluminum sample, angular distributions and total emission cross-sections were obtained for
$ \gamma $ -ray lines with energies of 0.091, 0.792, 0.843, 0.984, 1.014, 1.698, 1.808, 2.212, 2.298, 3.004 MeV, generated in the reactions 27Al$ (n,n')^{27} $ Al, 27Al$ (n,\alpha)^{24} $ Na, 27Al$ (n,p)^{27} $ Mg, 27Al$ (n,d)^{26} $ Mg. It should be noted that the available literature data on differential cross-sections for the above lines [19, 20, 26, 30, 59, 65, 72] are extremely fragmentary and mostly limited to 1-2 angular data-points. Data on the total emission cross-sections of these lines are also limited to a small number of studies [24, 28, 31, 39, 41, 42], which show significant scatter, reaching in some cases 30-50% (see Figs. 8 and 9).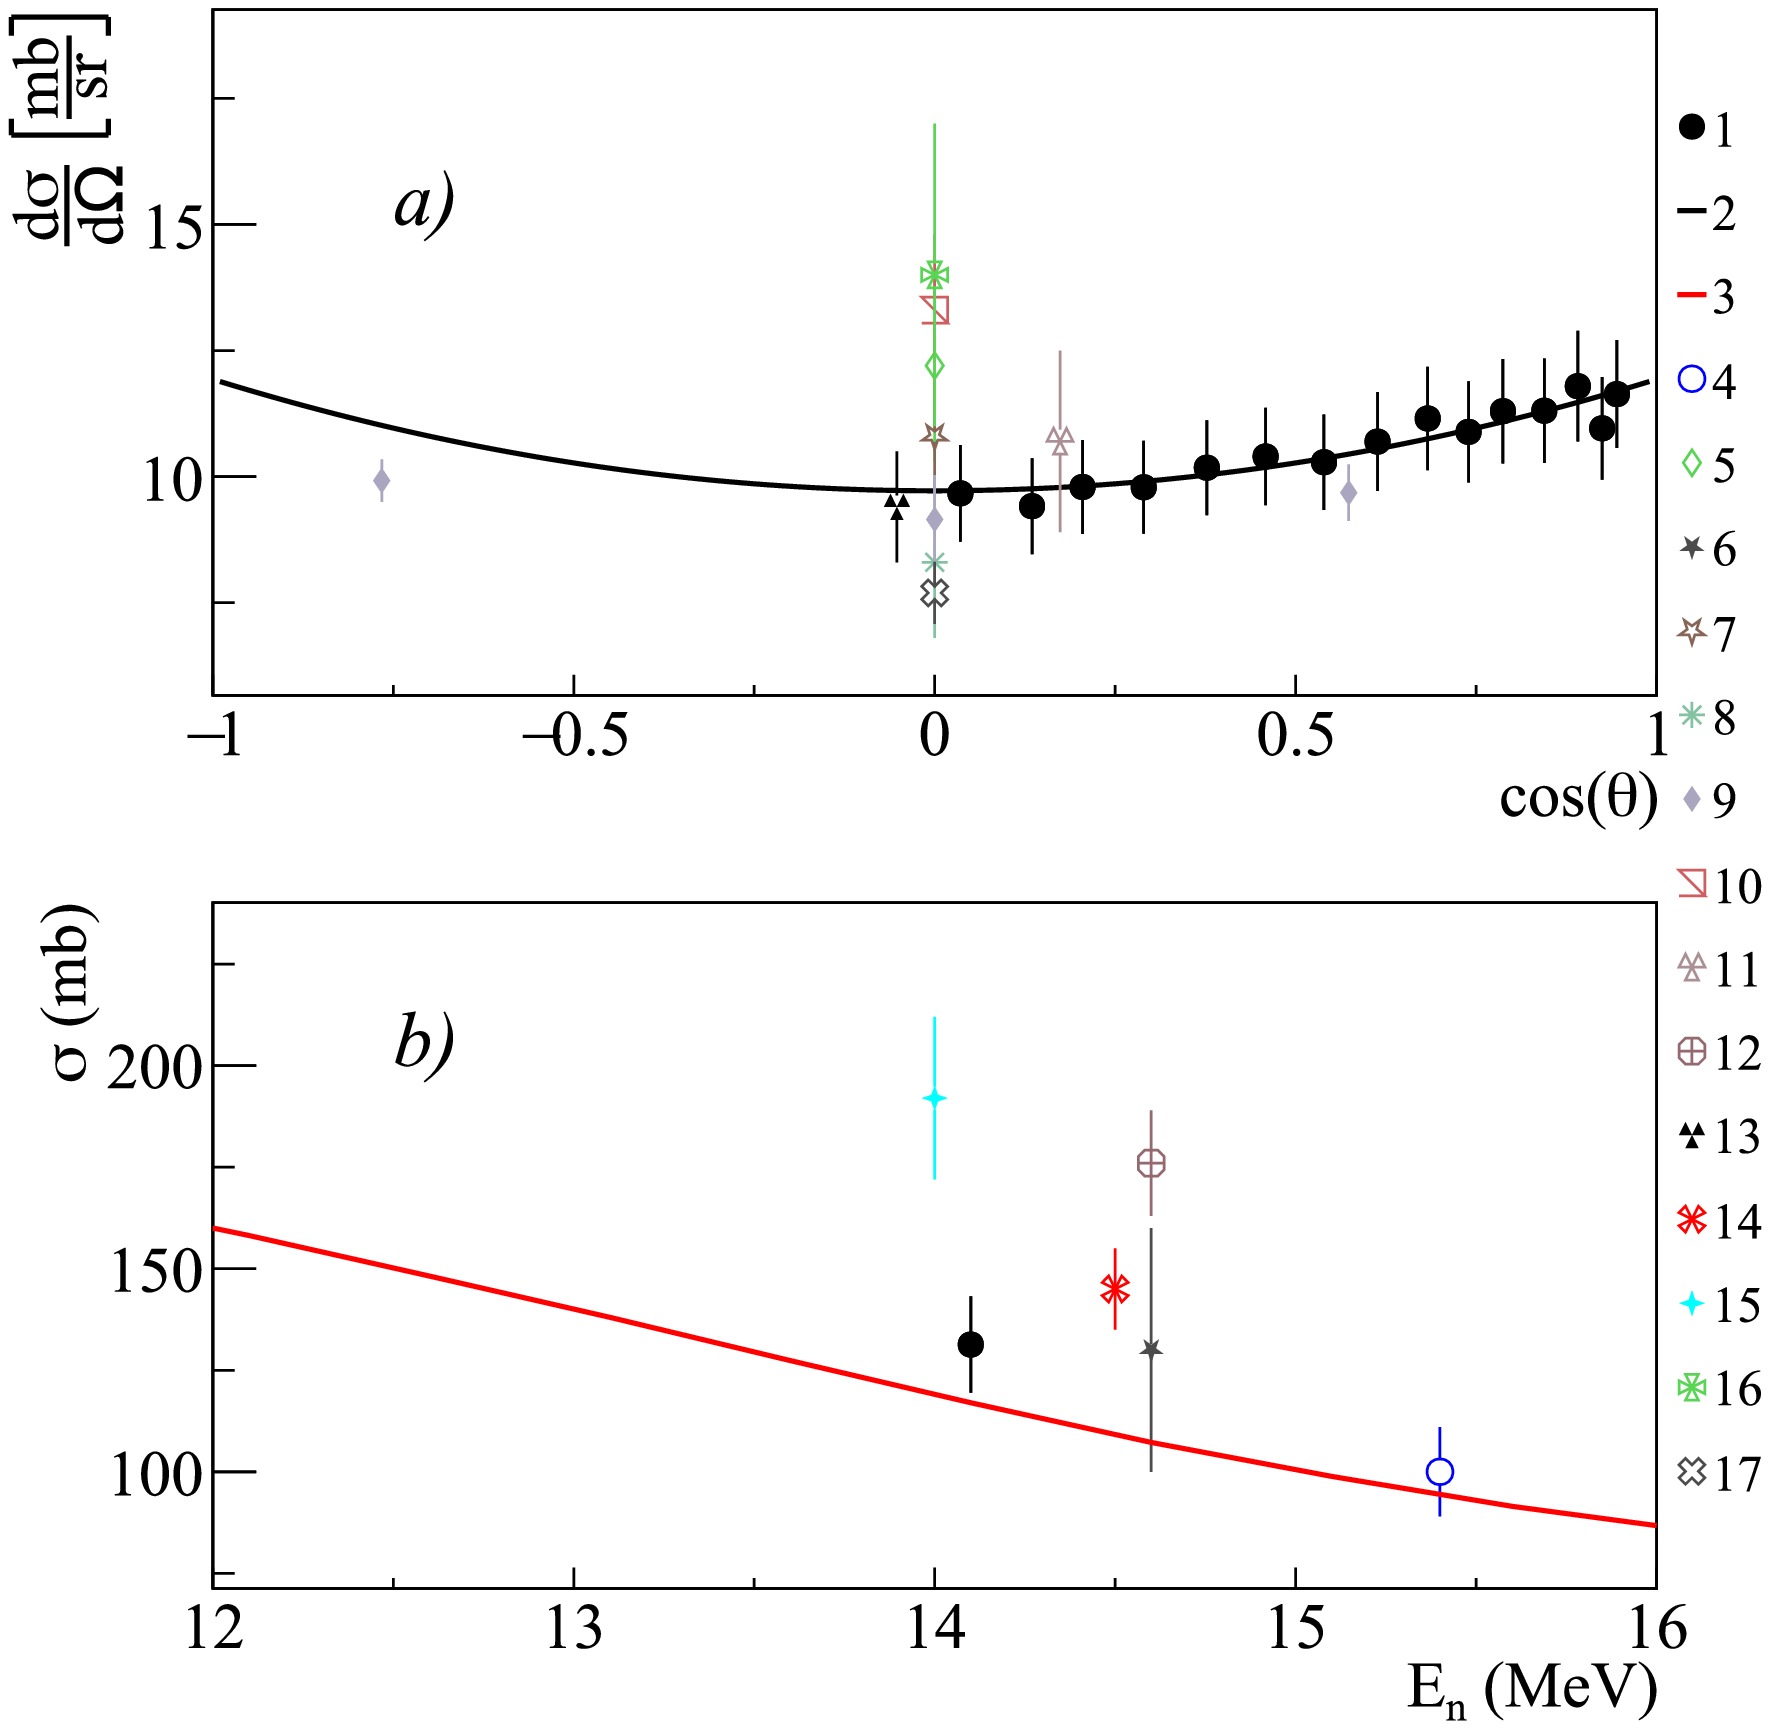
Figure 9. (color online) Differential (a) and total (b) cross-sections of 2.212 MeV
$ \gamma $ -ray emission from the 27Al$ (n,n')^{27} $ Al reaction, compared with experimental data from other authors and theoretical calculations using the TALYS code with default parameters. 1 – present work data; 2 – Legendre polynomial fit of angular angular distribution from present work; 3 – TALYS calculation; 4 – Lashuk1994 [31]; 5 – Sukhanov1970 [72]; 6 – Burymov1969 [39]; 7 – Engesser1967 [19]; 8 – Clayeux1969 [20]; 9 – Zhou1997 [44]; 10 – Hasegawa1991 [30]; 11 – Nyberg1971 [45]; 12 – Hlavac1999 [42]; 13 – Zong1979 [26]; 14 – Simakov1998 [85]; 15 –Bezotosnyi1975 [24]; 16 – Bochkarev1965 [40]; 17 – Hongyu1986 [46].For silicon, data on angular distributions and total emission cross-sections were obtained for
$ \gamma $ -ray lines with energies of 0.389, 0.585, 1.622, 1.779, 2.271, 2.839 MeV, generated in the reactions 28Si$ (n,p)^{28} $ Al, 28Si$ (n,\alpha)^{25} $ Mg, 28Si$ (n,n')^{28} $ Si, and 29Si$ (n,2n)^{28} $ Si. It should be noted that the excitation of the 28Si with subsequent emission of the$ \gamma $ -ray with an energy of 1.779 MeV occurs in the both reactions 28Si$ (n,n')^{28} $ Si, and 29Si$ (n,2n)^{28} $ Si.Data for the most intense lines corresponding to the transitions
$ 1.779(2^+) \rightarrow $ g.s.$ (0^+) $ and$ 4.617(4^+) \rightarrow 1.779(2^+) $ in the 28Si nucleus are presented in Figs. 10 and 11 in comparison with data from the literature [28, 42, 48, 49, 51, 53−58]. As can be seen from the figures, the data from the present work for these lines agree with the data from other authors within the measurement uncertainties, both for angular distributions and total cross-sections. The results presented for silicon in the previous work within the TANGRA project [14] differ somewhat from the results presented in this work.
Figure 10. (color online) Differential (a) and total (b) cross-sections of 1.779 MeV
$ \gamma $ -ray emission from the 28Si$ (n,n')^{28} $ Si and 29Si$ (n,2n)^{28} $ Si reactions, compared with experimental data from other authors and theoretical calculations using the TALYS code with default parameters. 1 – present work data; 2 – Legendre polynomial fit of angular angular distribution from present work; 3 – TALYS calculation; 4 – Negret2013 [57]; 5 – Drake1978 [52]; 6 – Engesser1967 [19]; 7 – Guoying1992 [54]; 8 – Grenier1974 [50]; 9 – Zhou2011 [56]; 10 – Murata1988 [28]; 11 – Prud'homme1960 [47]; 12 – Connell1975 [51]; 13 – Hasegawa1991 [30]; 14 – Boromiza2020 [58]; 15 – Drosg2002 [55]; 16 – Martin1965 [48]; 17 – Zong1979 [26]; 18 – Simakov1998 [85]; 19 – Abbondanno1973 [49]; 20 – Bezotosnyj1980 [53]; 21 – Kopatch2025 [14].It should be noted that the data from [14] were preliminary, as the cross-section calculation did not account for corrections for neutron multiple scattering and neutron attenuation in the generator wall. At the same time, only statistical uncertainty was considered in the error calculation in [14].
Analysis of the measured angular distributions showed a significant contribution from the Legendre polynomial expansion coefficients
$ a_2 $ and$ a_4 $ for the 1.779 MeV line (transition$ 1.779(2^+) \rightarrow $ g.s.$ (0^+ $ ) in the 28Si nucleus). For the 1.622 and 2.839 MeV lines (transitions$ 1.622(2^+) \rightarrow $ g.s.$ (3^+) $ in the 28Al nucleus and$ 4.617(4^+) \rightarrow 1.779(2^+) $ in the 28Si nucleus), the contribution of the$ a_2 $ coefficient is negligible, while the$ a_4 $ coefficient is significant. For transitions in the 25Mg nucleus ($ 0.974(3/2^+) \rightarrow 0.585(1/2^+) $ and$ 0.585(1/2^+) \rightarrow $ g.s.$ (5/2^+) $ ), the errors in the coefficients were comparable to their magnitudes due to the large statistical scatter in the data. -
The measurement results for the most intense
$ \gamma $ -ray lines emitted during the interaction of 14.1 MeV neutrons with calcium and titanium nuclei are presented in Figures 12–15 and in Table 6 and 7.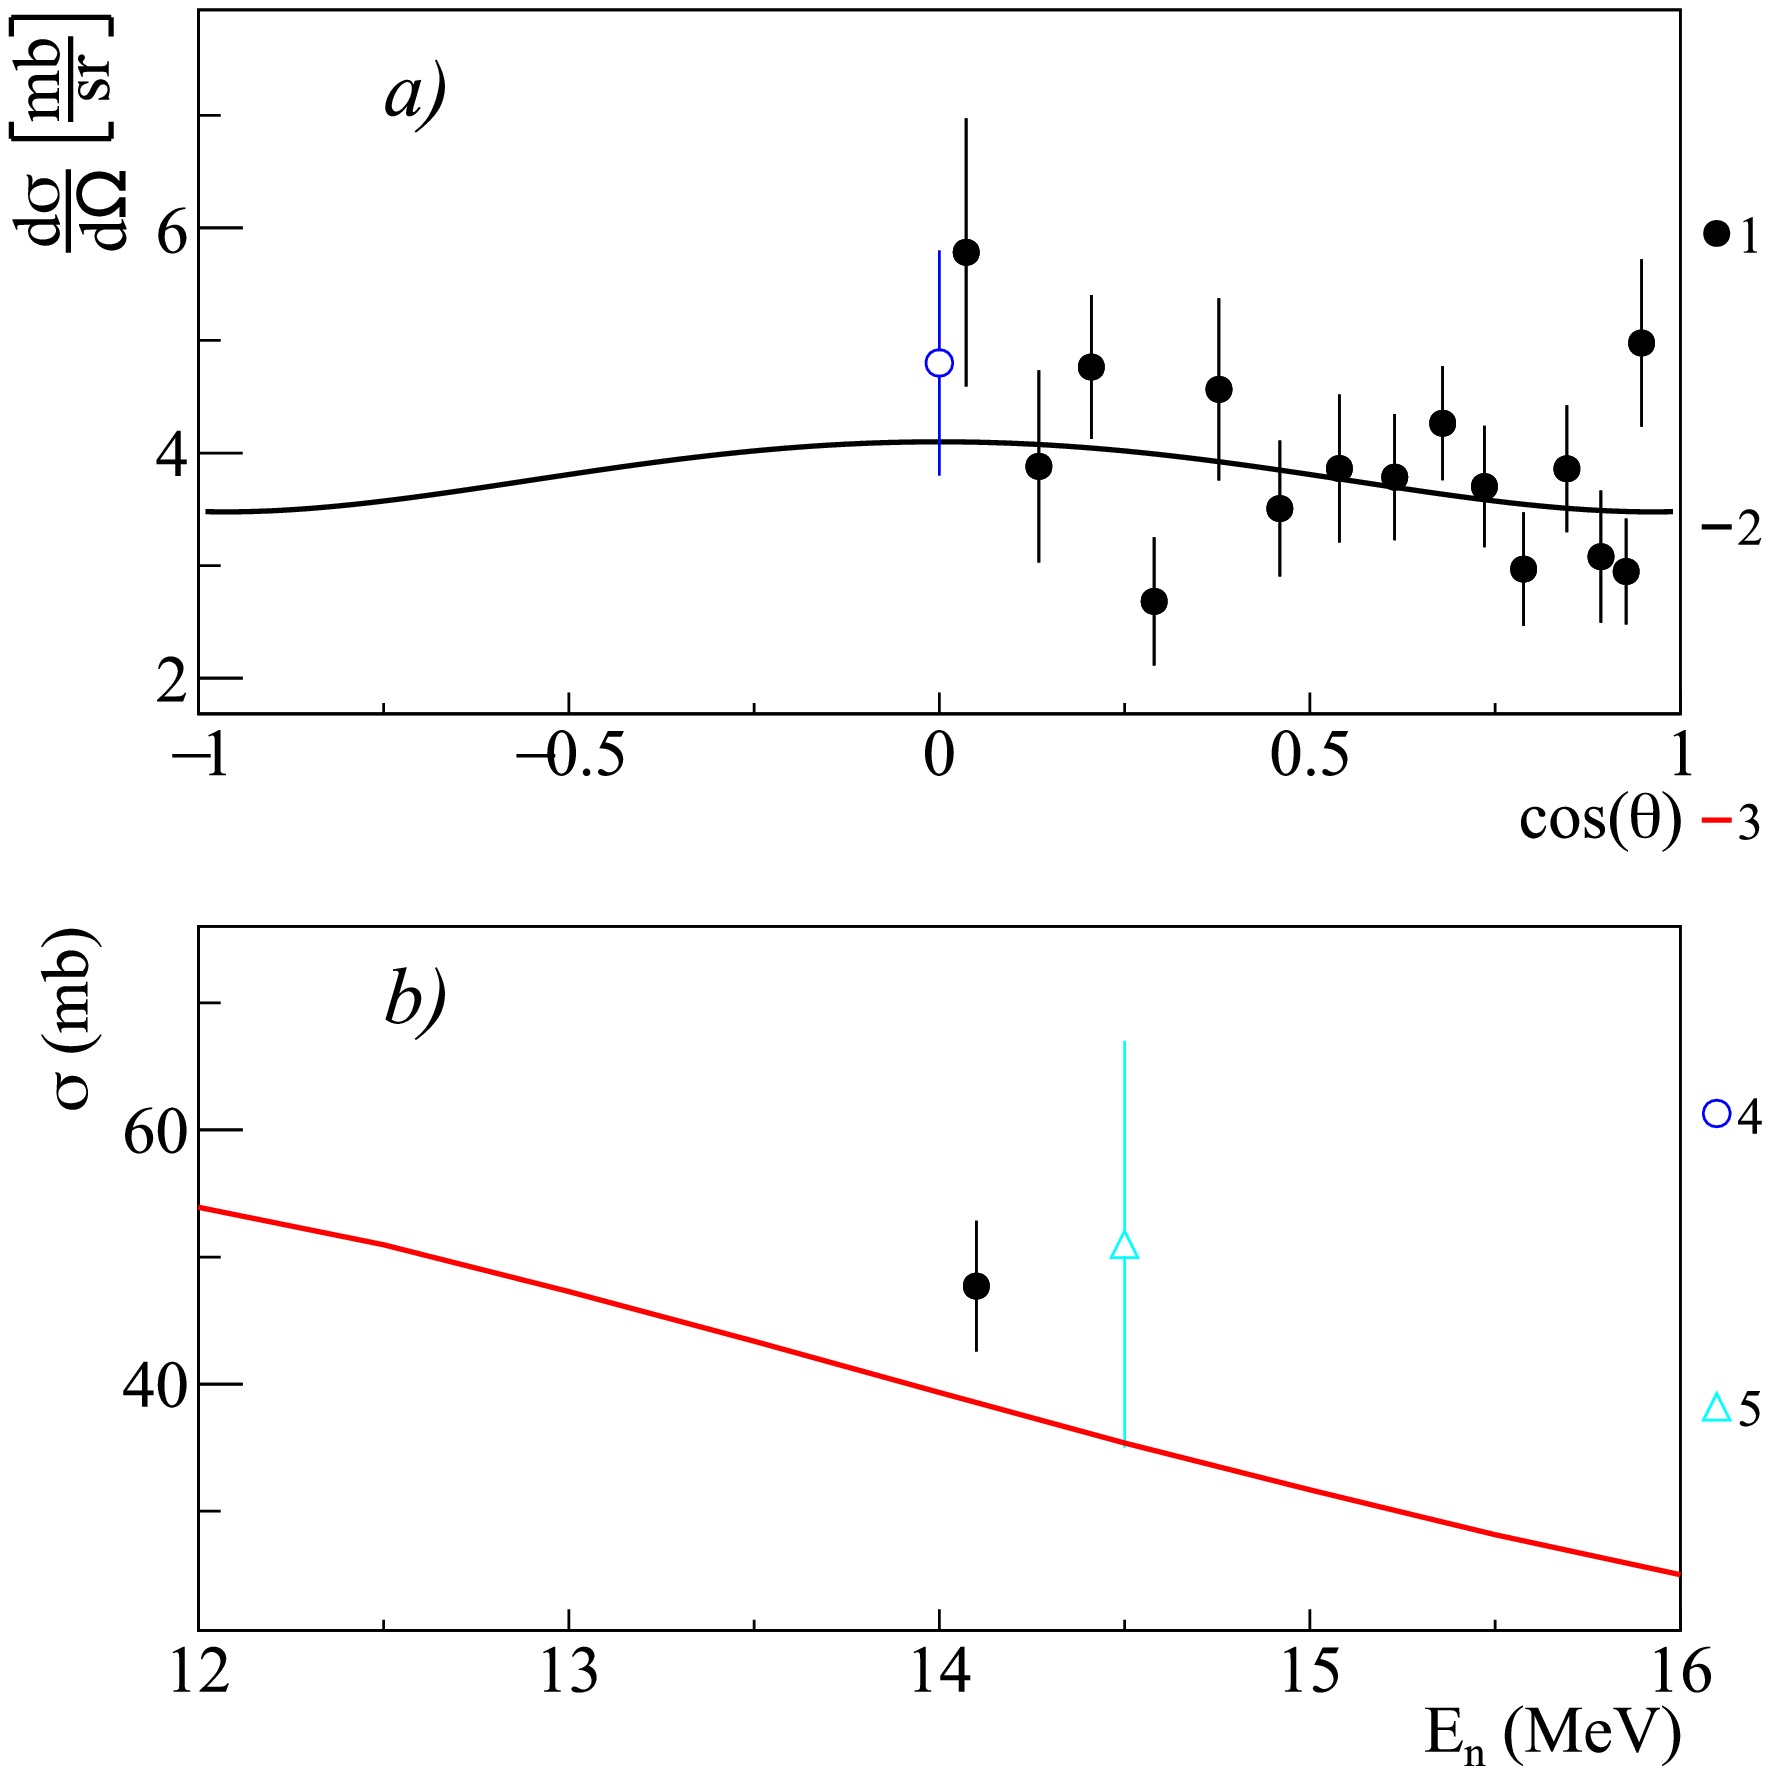
Figure 12. (color online) Differential (a) and total (b) cross-sections of 0.891 MeV
$ \gamma $ -ray emission from the 40Ca$ (n,p)^{40} $ K reaction, compared with experimental data from other authors and theoretical calculations using the TALYS code with default parameters. 1 – present work data; 2 – Legendre polynomial fit of angular angular distribution from present work; 3 – TALYS calculation; 4 – Engesser1967 [19]; 5 – Simakov1998 [85].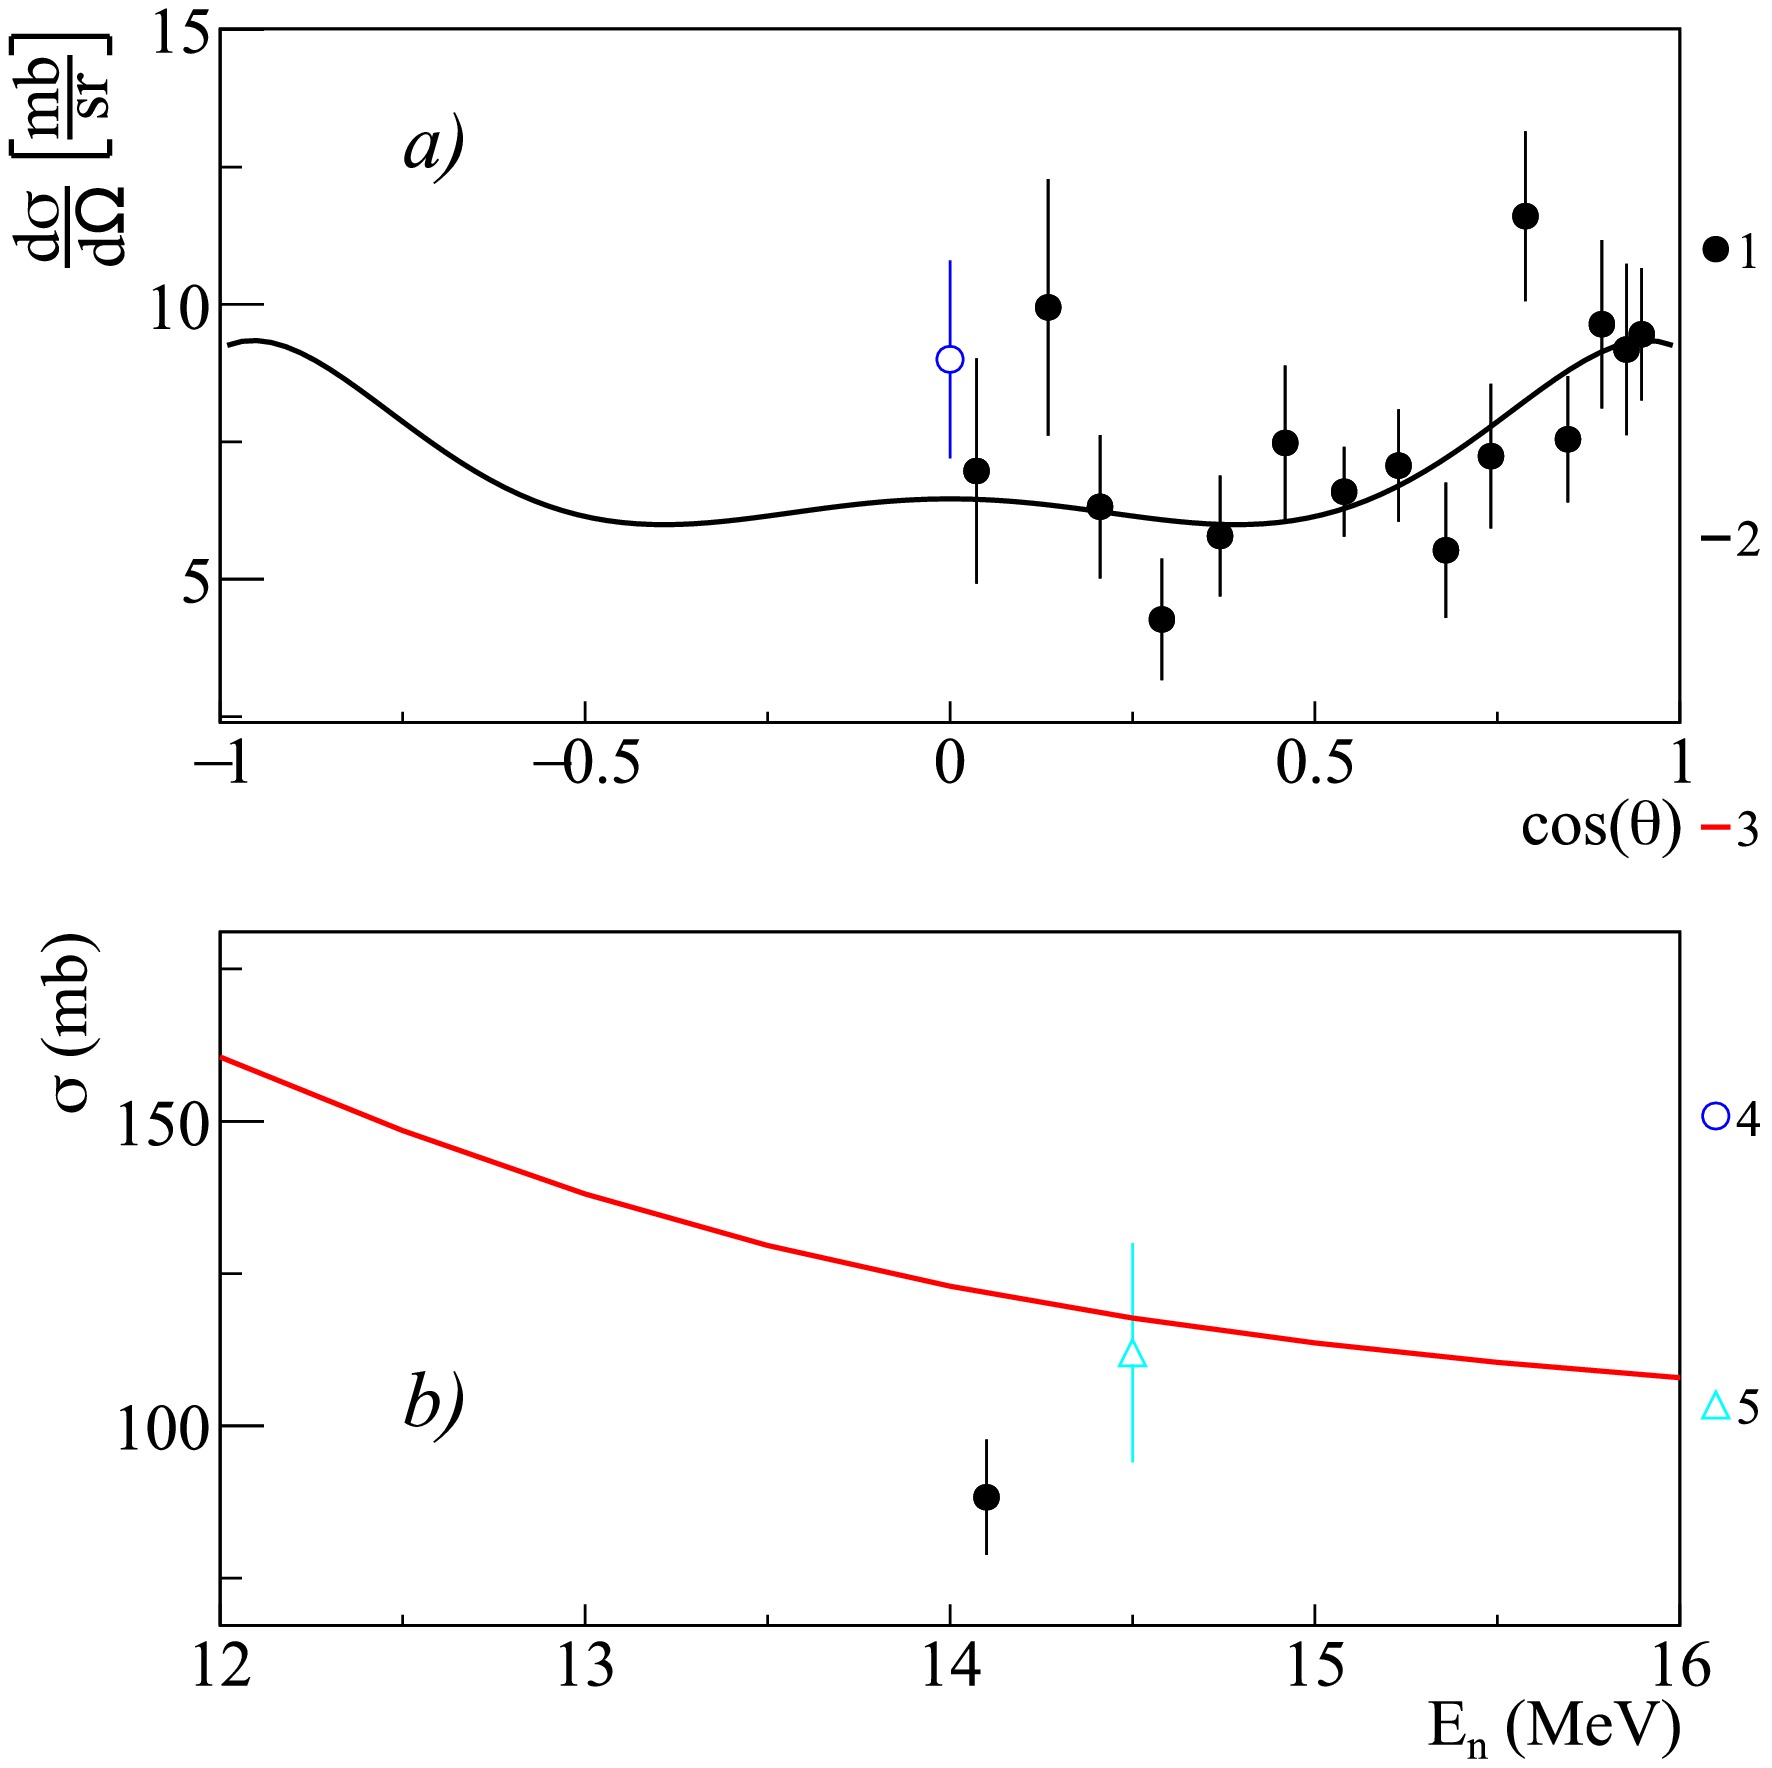
Figure 13. (color online) Differential (a) and total (b) cross-sections of 3.736 MeV
$ \gamma $ -ray emission from the 40Ca$ (n,n')^{40} $ Ca reaction, compared with experimental data from other authors and theoretical calculations using the TALYS code with default parameters. 1 – present work data; 2 – Legendre polynomial fit of angular angular distribution from present work; 3 – TALYS calculation; 4 – Engesser1967 [19]; 5 – Simakov1998 [85].
Figure 14. (color online) Differential (a) and total (b) cross-sections of 0.983 MeV
$ \gamma $ -ray emission from the 48Ti$ (n,n')^{48} $ Ti and 49Ti$ (n,2n)^{48} $ Ti reactions, compared with experimental data from other authors and theoretical calculations using the TALYS code with default parameters. 1 – present work data; 2 – Legendre polynomial fit of angular angular distribution from present work; 3 – TALYS calculation; 4 – Lashuk1994 [31]; 5 – Olacel2017 [64]; 6 – Arya1967 [59]; 7 – Dashdorj2005 [62]; 8 – Dashdorj2007 [63]; 9 – Engesser1967 [19]; 10 – Connell1975 [51]; 11 – Simakov1998 [85]; 12 – Abbondanno1973 [49]; 13 – Bezotosnyj1980 [53]; 14 – Breunlich1971 [60].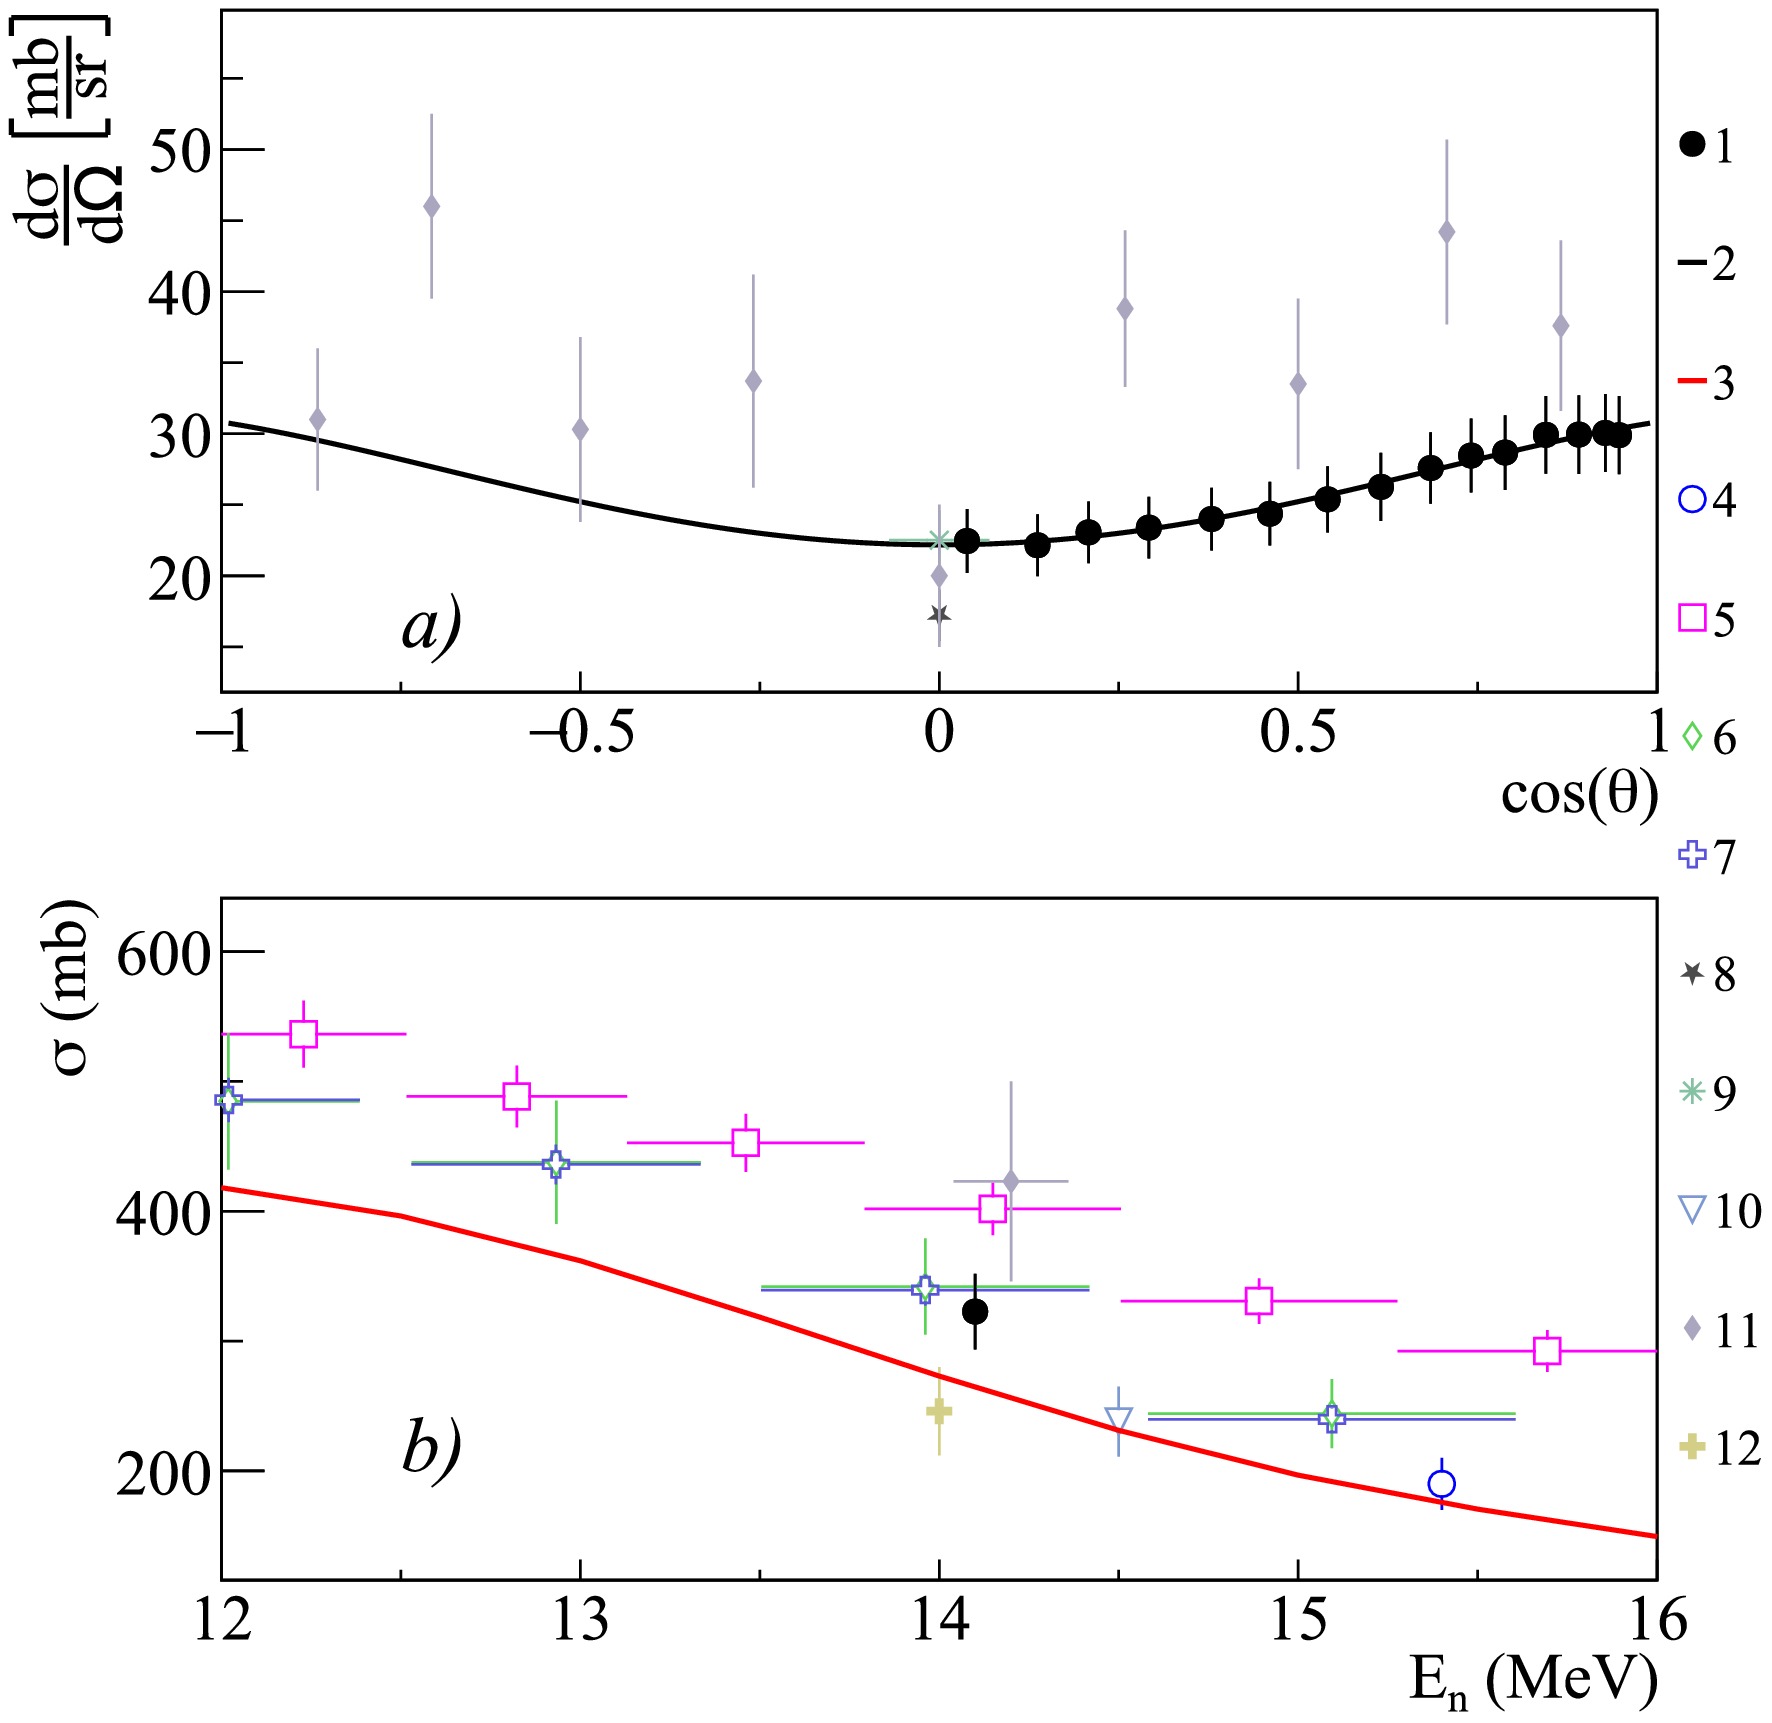
Figure 15. (color online) Differential (a) and total (b) cross sections of
$ \gamma $ -ray emission with energy 1.312 MeV from the reactions 48Ti$ (n,n')^{48} $ Ti and 49Ti$ (n,2n)^{48} $ Ti, in comparison with experimental data of other authors and theoretical calculations based on the TALYS program with default parameters. 1 – data from the present work; 2 – angular distribution fit from the present work using Legendre polynomials; 3 – calculation in TALYS; 4 – Lashuk1994 [31]; 5 – Olacel2017 [64]; 6 – Dashdorj2005 [62]; 7 – Dashdorj2007 [63]; 8 – Engesser1967 [19]; 9 – Connell1975 [51]; 10 – Simakov1998 [85]; 11 – Abbondanno1973 [49]; 12 – Bezotosnyj1980 [53].$E_{\gamma}$ (MeV)

Reaction Transition, $E_{i}$ 

$(J_{i}^{\pi}) \rightarrow E_{f} (J_{f}^{\pi})$ 

$\sigma$ (mb)

$a_2$ 

$a_4$ 

$a_6$ 

0.770 40Ca $(n,p)^{40}$ K

$0.800(2^-) \rightarrow 0.030(2^-)$ 

$40\pm5$ 

$0.10\pm0.21$ 

$0.16\pm0.25$ 

0.891 40Ca $(n,p)^{40}$ K

$0.891(5^-) \rightarrow $ g.s.

$(4^-)$ 

$48\pm5$ 

$-0.13\pm0.12$ 

$0.04\pm0.17$ 

1.159 40Ca $(n,p)^{40}$ K

$1.959(2^+) \rightarrow 0.800(2^-)$ 

$29\pm4$ 

$-0.07\pm0.19$ 

1.611 40Ca $(n,\alpha)^{37}$ Ar

$1.611(7/2^-) \rightarrow $ g.s.

$(3/2^+)$ 

$34\pm6$ 

$0.01\pm0.26$ 

$-0.30\pm0.43$ 

$0.41\pm0.47$ 

2.217 40Ca $(n,\alpha)^{37}$ Ar

$2.217(7/2^+) \rightarrow $ g.s.

$(3/2^+)$ 

$21\pm3$ 

$-0.38\pm0.20$ 

$0.11\pm0.30$ 

2.814 40Ca $(n,d)^{39}$ K

$2.814(7/2^-) \rightarrow $ g.s.

$(3/2^+)$ 

$28\pm4$ 

$0.46\pm0.23$ 

$-0.08\pm0.25$ 

$0.49\pm0.34$ 

3.736 40Ca $(n,n')^{40}$ Ca

$3.736(3^-) \rightarrow $ g.s

$(0^+)$ 

$88\pm12$ 

$0.34\pm0.15$ 

$0.12\pm0.18$ 

$-0.15\pm0.24$ 

3.904 40Ca $(n,n')^{40}$ Ca

$3.904(2^+) \rightarrow $ g.s.

$(0^+)$ 

$39\pm6$ 

$0.07\pm0.22$ 

$0.26\pm0.31$ 

Table 6. Total emission cross sections
$\sigma$ and coefficients of angular distribution expansion in Legendre polynomials$a_2, a_4$ and$a_6$ for$\gamma$ -ray lines emitted in the interaction of 14.1 MeV neutrons with calcium nuclei. The energies of the initial (i) and final (f) states are given in MeV.$E_{\gamma}$ (MeV)

Reaction Transition, $E_{i}$ 

$(J_{i}^{\pi}) \rightarrow E_{f} (J_{f}^{\pi})$ 

$\sigma$ (mb)

$a_2$ 

$a_4$ 

0.121 48Ti $(n,p)^{48}$ Sc

$0.252(4^+) \rightarrow 0.130(5^+)$ 

$51\pm8$ 

$0.39\pm0.31$ 

$-0.03\pm0.46$ 

0.130 48Ti $(n,p)^{48}$ Sc

$0.130(5^+) \rightarrow $ g.s.

$(6^+)$ 

$47\pm5$ 

$0.01\pm0.09$ 

$-0.22\pm0.13$ 

0.159 47Ti $(n,n')^{47}$ Ti

$0.159(7/2^-) \rightarrow $ g.s.

$(5/2^-)$ 

$187\pm17$ 

$-0.27\pm0.01$ 

$-0.03\pm0.02$ 

48Ti $(n,2n)^{47}$ Ti

0.175 48Ti $(n,n')^{48}$ Ti

$3.508(6^+) \rightarrow 3.333(6^+)$ 

$43\pm4$ 

$0.42\pm0.05$ 

$-0.12\pm0.07$ 

49Ti $(n,2n)^{48}$ Ti

0.370 48Ti $(n,p)^{48}$ Sc

$0.622(3^+) \rightarrow 0.252(4^+)$ 

$26\pm3$ 

$0.15\pm0.08$ 

$-0.07\pm0.11$ 

0.889 46Ti $(n,n')^{46}$ Ti

$0.889(2^+) \rightarrow $ g.s.

$(0^+)$ 

$523\pm48$ 

$0.12\pm0.03$ 

$0.01\pm0.04$ 

47Ti $(n,2n)^{46}$ Ti

0.944 48Ti $(n,n')^{48}$ Ti

$3.239(4^+) \rightarrow 2.295(4^+)$ 

$65\pm6$ 

$0.24\pm0.04$ 

$0.12\pm0.06$ 

49Ti $(n,2n)^{48}$ Ti

0.983 48Ti $(n,n')^{48}$ Ti

$0.983(2^+) \rightarrow $ g.s.

$(0^+)$ 

$700\pm63$ 

$0.16\pm0.01$ 

$-0.04\pm0.01$ 

49Ti $(n,2n)^{48}$ Ti

1.037 48Ti $(n,n')^{48}$ Ti

$3.333(6^+) \rightarrow 2.295(4^+)$ 

$72\pm7$ 

$0.42\pm0.04$ 

$-0.01\pm0.06$ 

49Ti $(n,2n)^{48}$ Ti

1.120 46Ti $(n,n')^{46}$ Ti

$2.009(4^+) \rightarrow 0.889(2^+)$ 

$200\pm19$ 

$0.29\pm0.05$ 

$-0.04\pm0.06$ 

47Ti $(n,2n)^{46}$ Ti

1.312 48Ti $(n,n')^{48}$ Ti

$2.295(4^+) \rightarrow 0.983(2^+)$ 

$323\pm29$ 

$0.24\pm0.01$ 

$-0.04\pm0.01$ 

49Ti $(n,2n)^{48}$ Ti

1.438 48Ti $(n,n')^{48}$ Ti

$2.421(2^+) \rightarrow 0.983(2^+)$ 

$59\pm6$ 

$0.15\pm0.06$ 

$-0.01\pm0.08$ 

49Ti $(n,2n)^{48}$ Ti

1.542 49Ti $(n,n')^{49}$ Ti

$1.542(11/2^-) \rightarrow $ g.s.

$(7/2^-)$ 

$659\pm61$ 

$0.21\pm0.05$ 

$0.08\pm0.06$ 

49Ti $(n,2n)^{50}$ Ti

2.240 48Ti $(n,n')^{48}$ Ti

$3.224(3^+) \rightarrow 0.983(2^+)$ 

$36\pm3$ 

$0.15\pm0.05$ 

$-0.22\pm0.09$ 

49Ti $(n,2n)^{48}$ Ti

2.375 48Ti $(n,n')^{48}$ Ti

$3.358(3^-) \rightarrow 0.983(2^+)$ 

$89\pm8$ 

$-0.12\pm0.02$ 

49Ti $(n,2n)^{48}$ Ti

2.633 48Ti $(n,n')^{48}$ Ti

$3.617(3^+) \rightarrow 0.983(2^+)$ 

$21\pm2$ 

$-0.19\pm0.13$ 

$-0.01\pm0.18$ 

49Ti $(n,2n)^{48}$ Ti

Table 7. Total emission cross sections
$\sigma$ and coefficients of angular distribution expansion in Legendre polynomials$a_2$ and$a_4$ for$\gamma$ -ray lines emitted in the interaction of 14.1 MeV neutrons with titanium nuclei. The energies of the initial (i) and final (f) states are given in MeV.In the case of calcium, it should be noted that nearly all available experimental data are limited to measurements at 90° (see, for example, [19]), and there are no reliable data whatsoever on total emission cross-sections or angular distributions. In the present work, detailed angular distributions were obtained for the first time for lines with energies of 0.770, 0.891, 2.814, 3.736, and 3.904 MeV, and their total emission cross-sections were determined (see Table 6). The results for the most intense lines 0.891 and 3.736 MeV, are shown in Figure 12 and 13.
Analysis of the measured angular distributions revealed a significant contribution from the first three even-order Legendre polynomial expansion coefficients
$ a_2 $ ,$ a_4 $ , and$ a_6 $ for the 2.814 and 3.736 MeV lines, which correspond to the transitions$ 2.814(7/2^-) \rightarrow $ g.s.$ (3/2^+) $ in the 39K nucleus and$ 3.736(3^-) \rightarrow $ g.s.$ (0^+) $ in 40Ca, respectively. Significant$ a_2 $ and$ a_4 $ coefficients, with no contribution from$ a_6 $ , were observed for the transitions$ 0.800(2^-) \rightarrow 0.03(2^-) $ and$ 0.892(5^-) \rightarrow $ g.s.$ (4^-) $ in the 40K nucleus (lines with energies of 0.770 MeV and 0.891 MeV, respectively), as well as for$ 3.904(2^+) \rightarrow $ g.s.$ (0^+) $ (the 3.904 MeV line) in the 40Ca nucleus.For titanium, in the present work, angular distributions and emission cross-sections were obtained for lines with energies of 0.121, 0.130, 0.159, 0.175, 0.370, 0.889, 0.944, 0.983, 1.037, 1.120, 1.312, 1.437, 1.542, 2.375 MeV. It is worth noting that the (n,2n) reaction contributes to all observed
$ \gamma $ -transitions excited by inelastic scattering of neutrons on titanium nuclei. As can be seen from Figs. 14 and 15, which present data for the most intense lines with energies of 0.983 and 1.312 MeV in comparison with data from other authors, the total emission cross-sections obtained in the present work agree with most of the data from other authors [53, 60, 62, 63] within the measurement uncertainties, except for data from a recent study [64], which are slightly higher.The available data on angular distributions for these and other lines are quite fragmentary and represented by only a few measurements [19, 49, 51, 59], of which only two datasets provide more than 1 angular point [19, 49]. Detailed angular distributions for all lines, except 0.983 and 1.312 MeV, were obtained for the first time.
Overall, as can be seen from the approximation results presented in Table 7, for most transitions in titanium nuclei, significant
$ a_2 $ coefficients were observed in the Legendre polynomial expansion, with negligible contributions from$ a_4 $ and$ a_6 $ coefficients. An exception is the transition$ 0.130(5^+) \rightarrow $ g.s.$ (6^+) $ in the 48Sc nucleus, for which the angular distribution is nearly isotropic. -
The results of measurements for the most intense
$ \gamma $ -ray lines emitted during the interaction of 14.1 MeV neutrons with chromium and iron nuclei are presented in Figs. 16–19 and Table 8 and 9.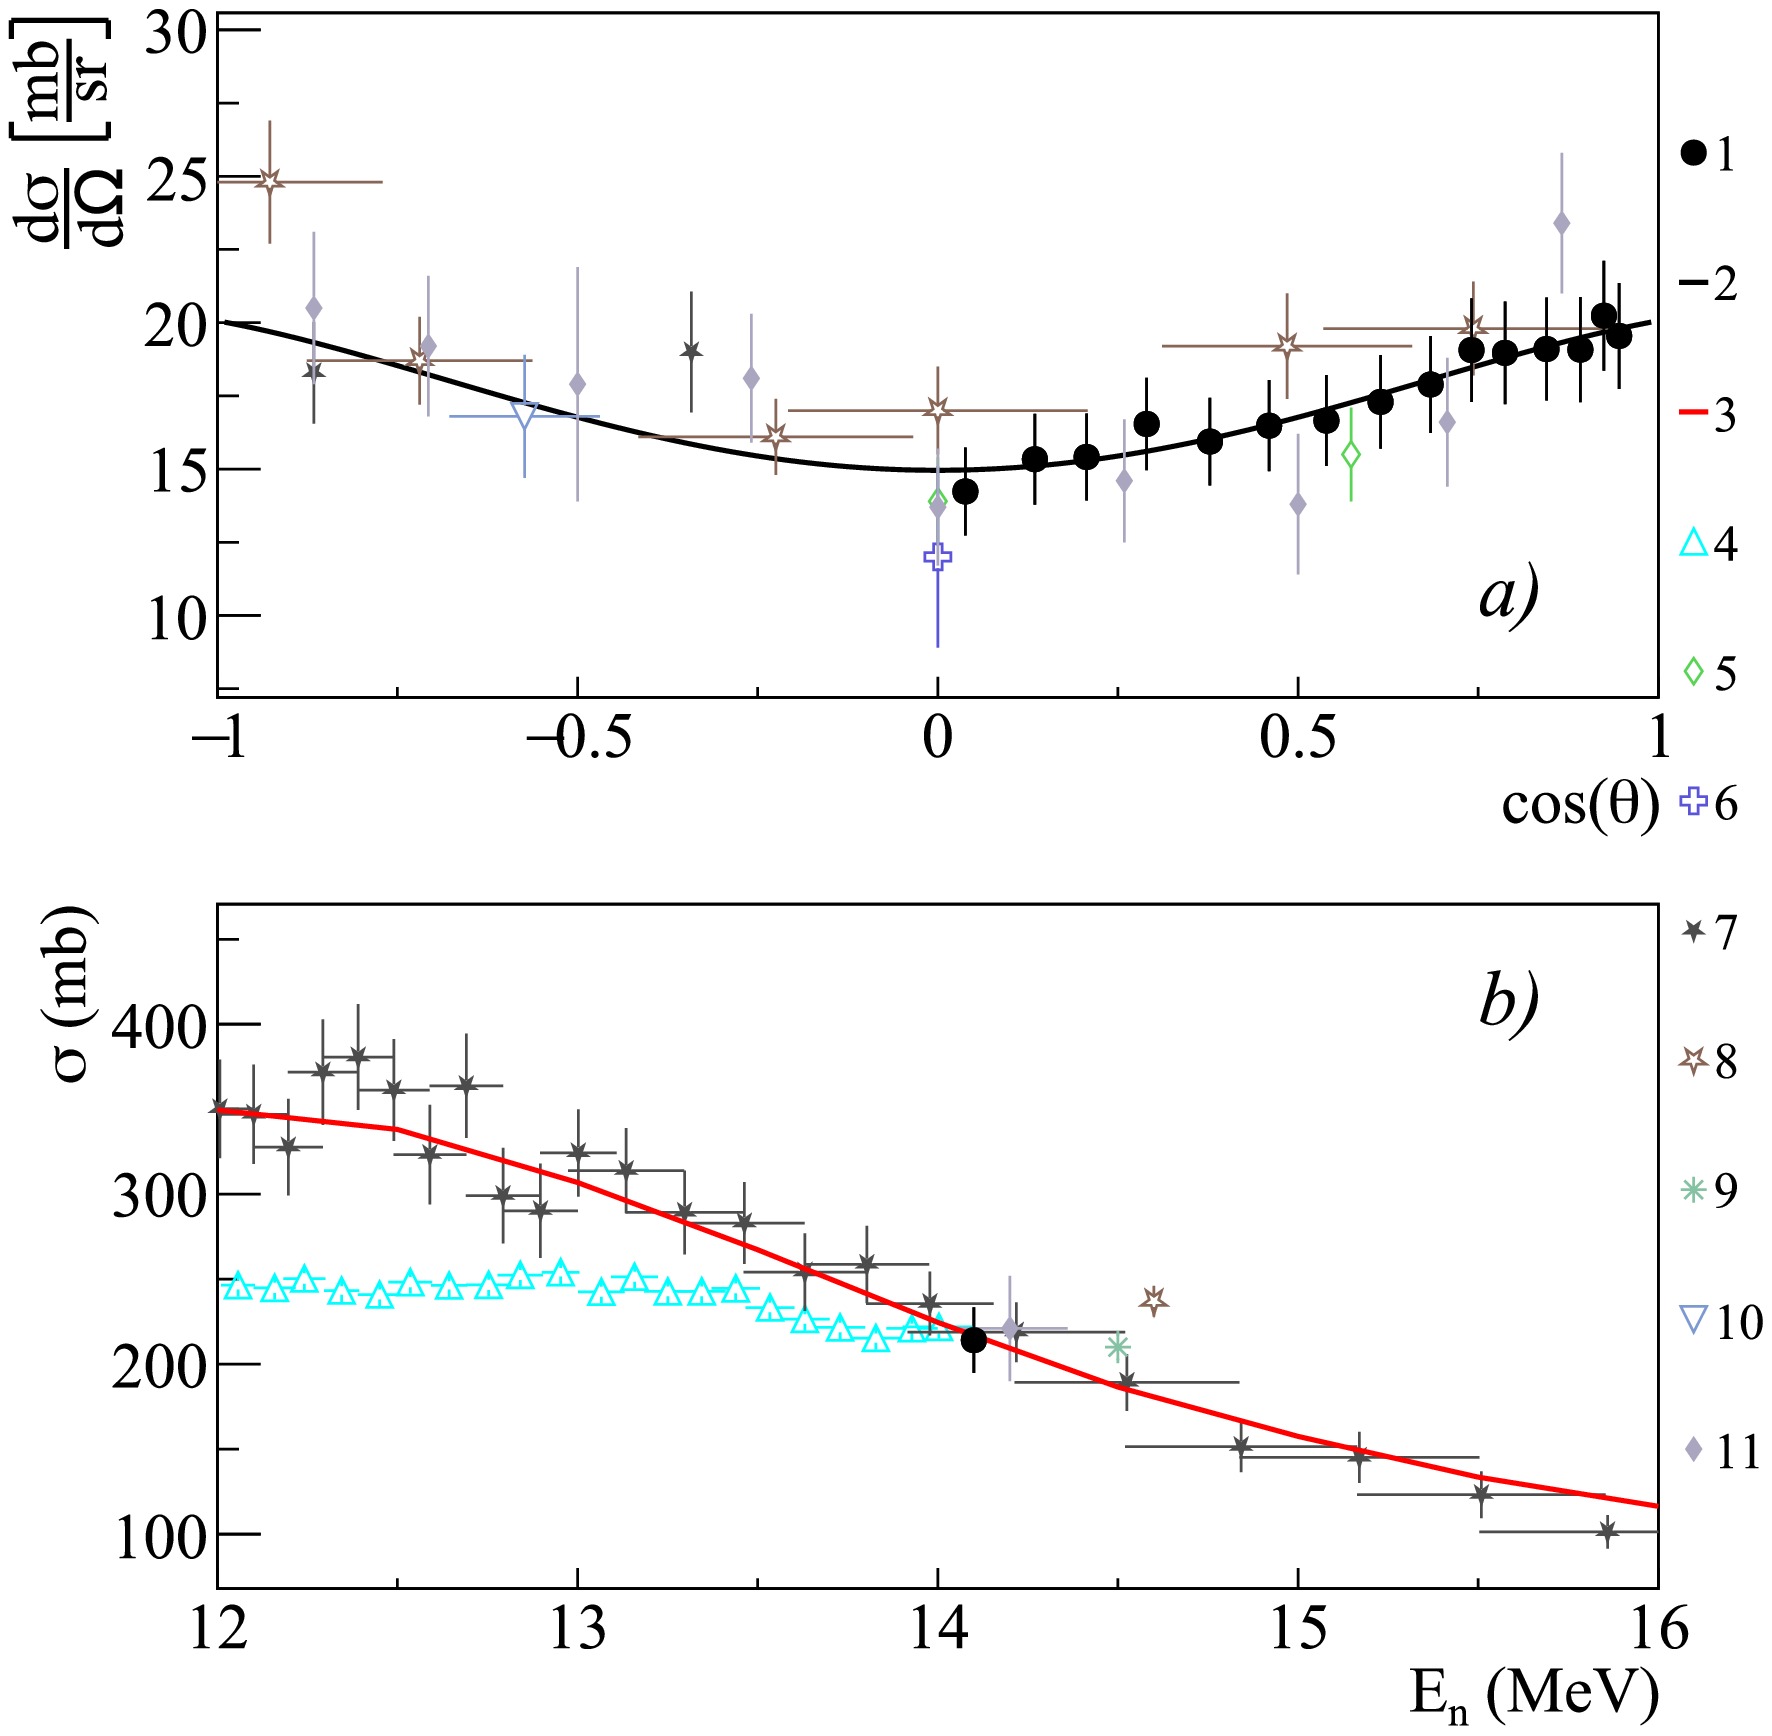
Figure 16. Differential (a) and total (b) cross sections of
$ \gamma $ -ray emission with energy 0.935 MeV from the reactions 52Cr$ (n,n')^{52} $ Cr and 53Cr$ (n,2n)^{52} $ Cr, in comparison with experimental data of other authors and theoretical calculations based on the TALYS program with default parameters. 1 – data from the present work; 2 – angular distribution fit from the present work using Legendre polynomials; 3 – calculation in TALYS; 4 – Voss1975 [66]; 5 – Clayeux1969 [20]; 6 – Kinney1972 [65]; 7 – Mihailescu2007 [69]; 8 – Oblozinsky1992 [68]; 9 – Simakov1998 [85]; 10 – Yamamoto1978 [67]; 11 – Abbondanno1973 [49].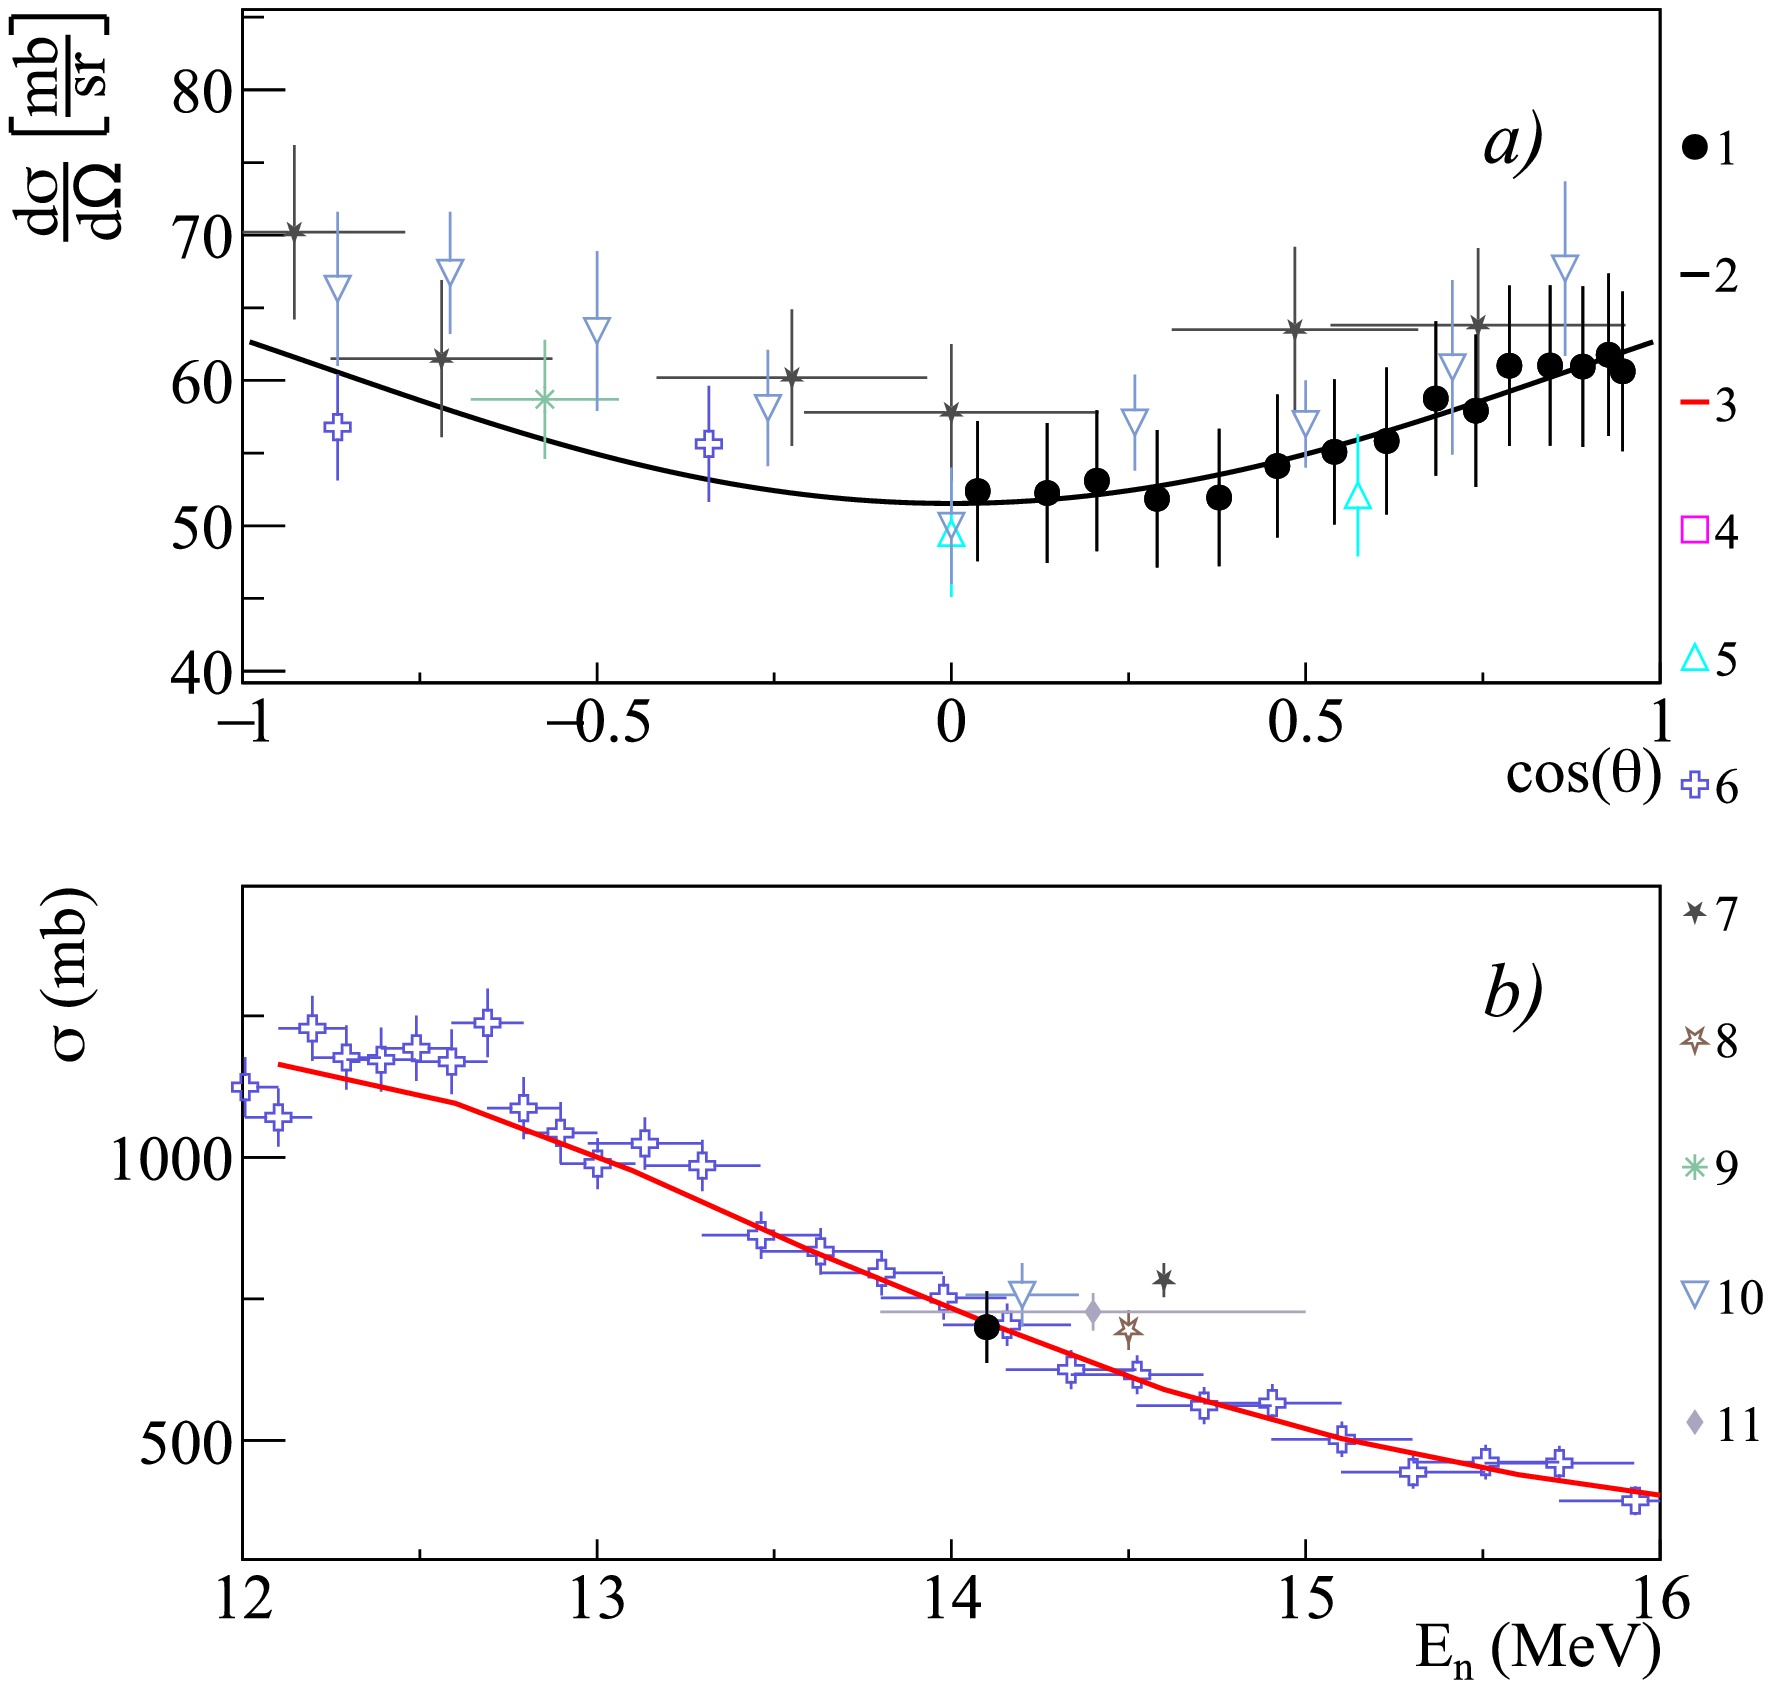
Figure 17. Differential (a) and total (b) cross sections of
$ \gamma $ -ray emission with energy 1.434 MeV from the reactions 52Cr$ (n,n')^{52} $ Cr and 53Cr$ (n,2n)^{52} $ Cr, in comparison with experimental data of other authors and theoretical calculations based on the TALYS program with default parameters. 1 – data from the present work; 2 – angular distribution fit from the present work using Legendre polynomials; 3 – calculation in TALYS; 4 – Voss1975 [66]; 5 – Clayeux1969 [20]; 6 – Mihailescu2007 [69]; 7 – Oblozinsky1992 [68]; 8 – Simakov1998 [85]; 9 – Yamamoto1978 [67]; 10 – Abbondanno1973 [49]; 11 – Breunlich1971 [60].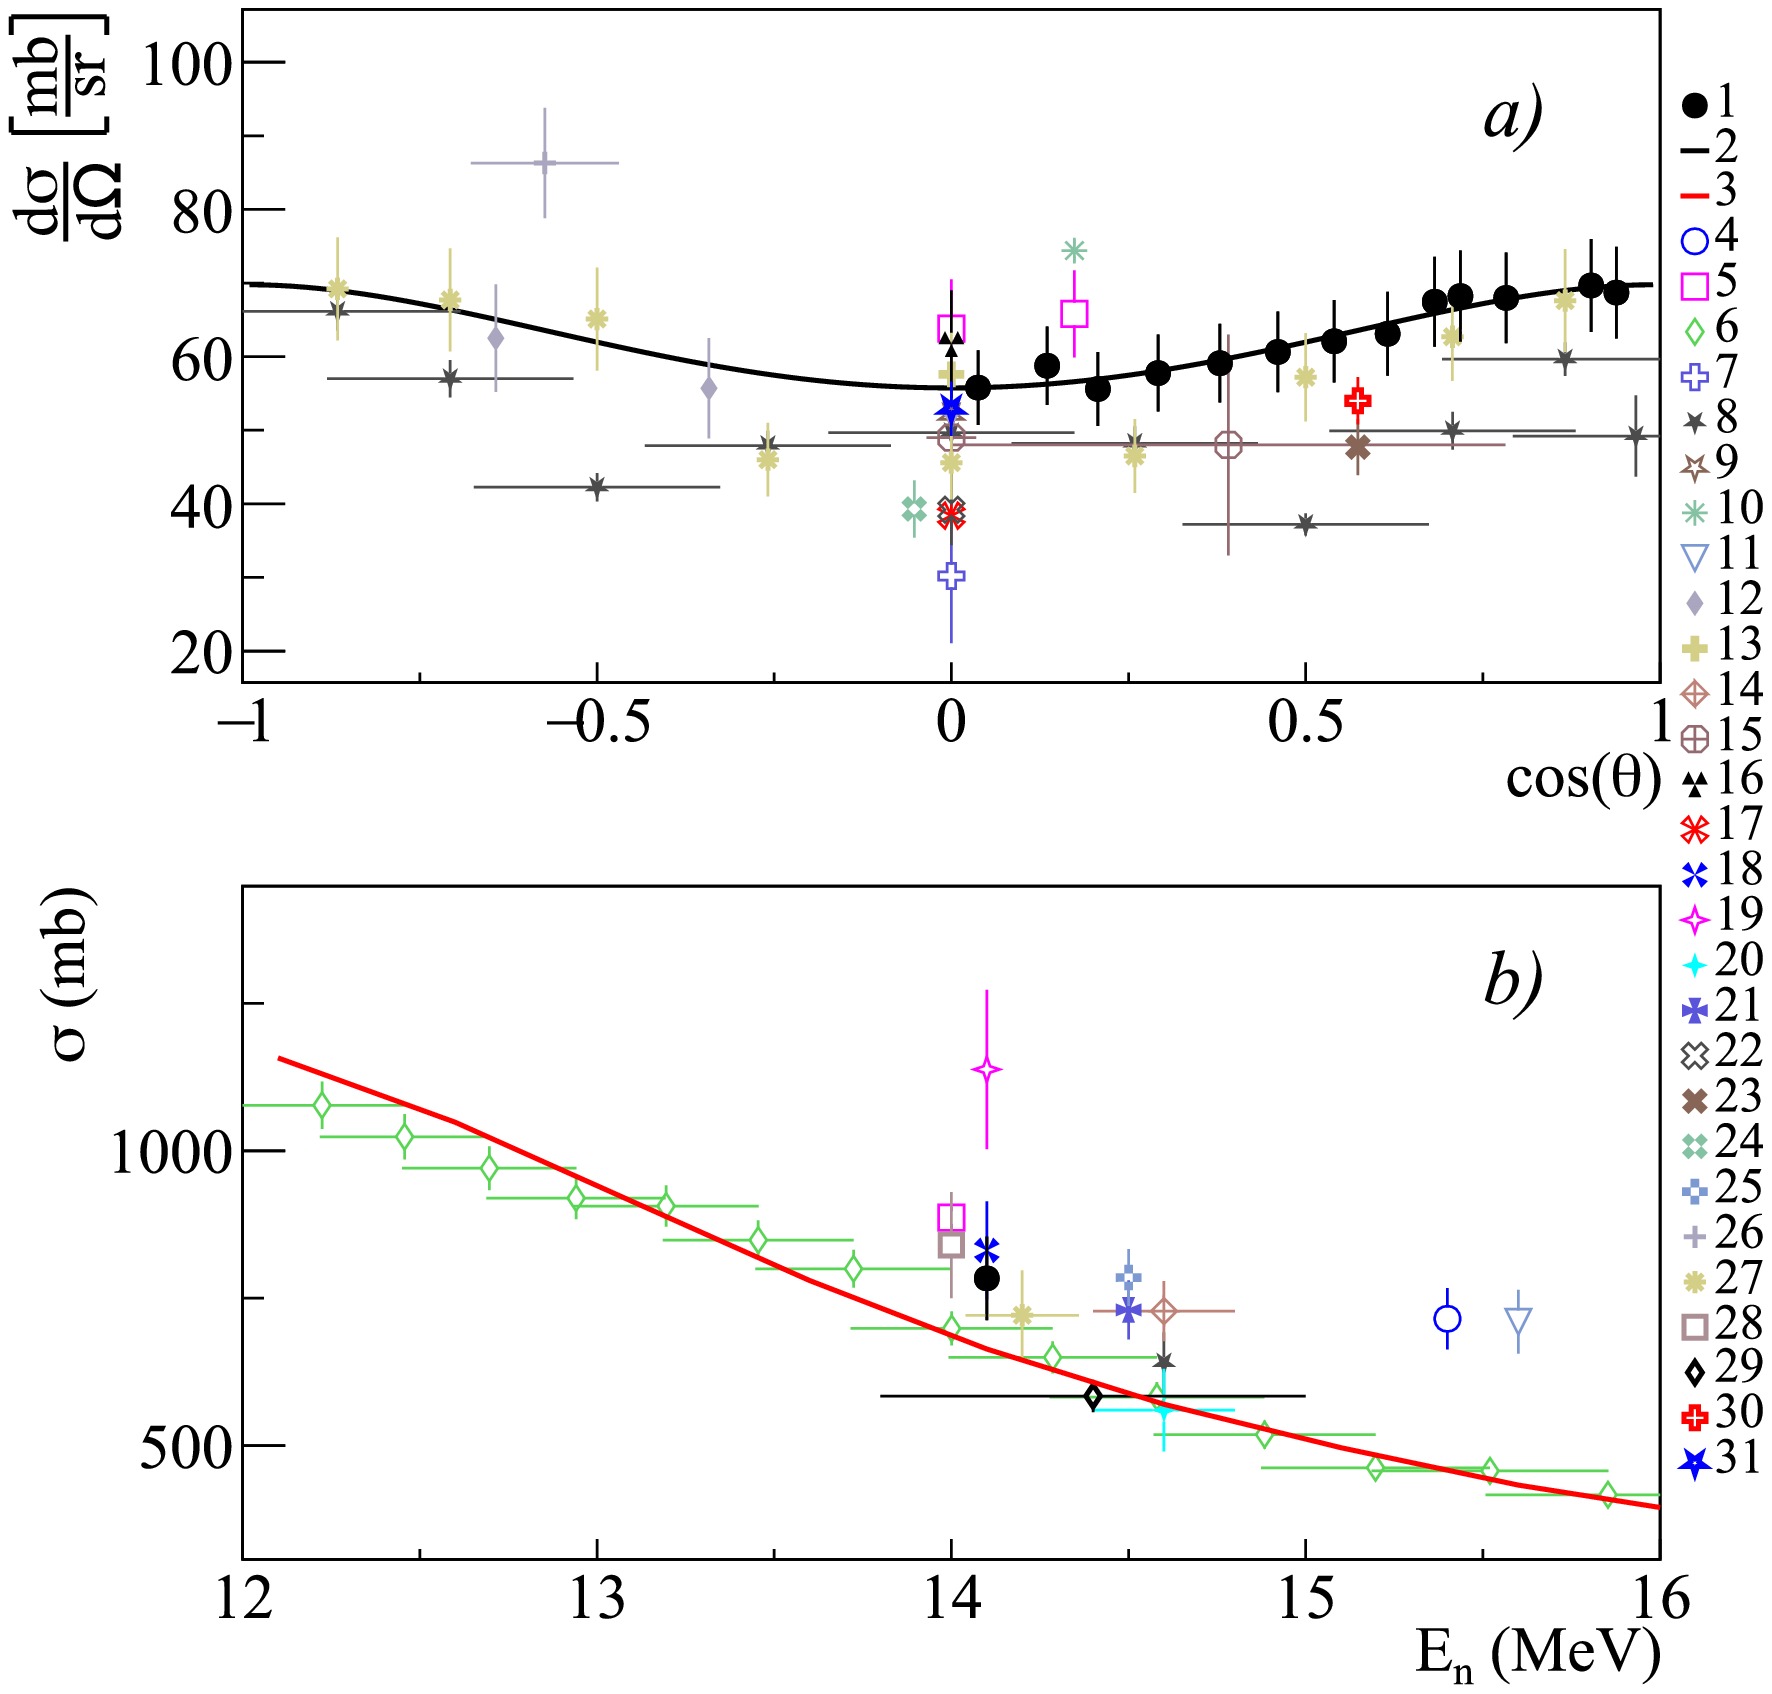
Figure 18. (color online) Differential (a) and total (b) cross sections of
$ \gamma $ -ray emission with energy 0.846 MeV from the reactions 56Fe$ (n,n')^{56} $ Fe and 57Fe$ (n,2n)^{56} $ Fe, in comparison with experimental data of other authors and theoretical calculations based on the TALYS program with default parameters. 1 – data from the present work; 2 – angular distribution fit from the present work using Legendre polynomials; 3 – calculation in TALYS; 4 – Lashuk1994 [31]; 5 – Shalabi1983 [75]; 6 – Negret2014 [79]; 7 – Arya1967 [59]; 8 – Degtyarev1977 [73]; 9 – Sukhanov1970 [72]; 10 – Joensson1969 [71]; 11 – Broder1970 [80]; 12 – Drake1978 [52]; 13 – Engesser1967 [19]; 14 – Western1965 [81]; 15 – Prud'homme1960 [47]; 16 – Hasegawa1991 [30]; 17 – Drosg2002 [55]; 18 – Mitsuda2002 [82]; 19 – Bostrom1959 [70]; 20 – Martin1965 [48]; 21 – Antalik1980 [83]; 22 – Nelson2005 [84]; 23 – Hlavac1983 [76]; 24 – Xiamin1982 [74]; 25 – Zong1979 [26]; 26 – Simakov1998 [85]; 27 – Yamamoto1978 [67]; 28 – Abbondanno1973 [49]; 29 – Bezotosnyi1975 [24]; 30 – Breunlich1971 [60]; 31 – Jinqiang1988 [77]; 32 – Hongyu1986 [46].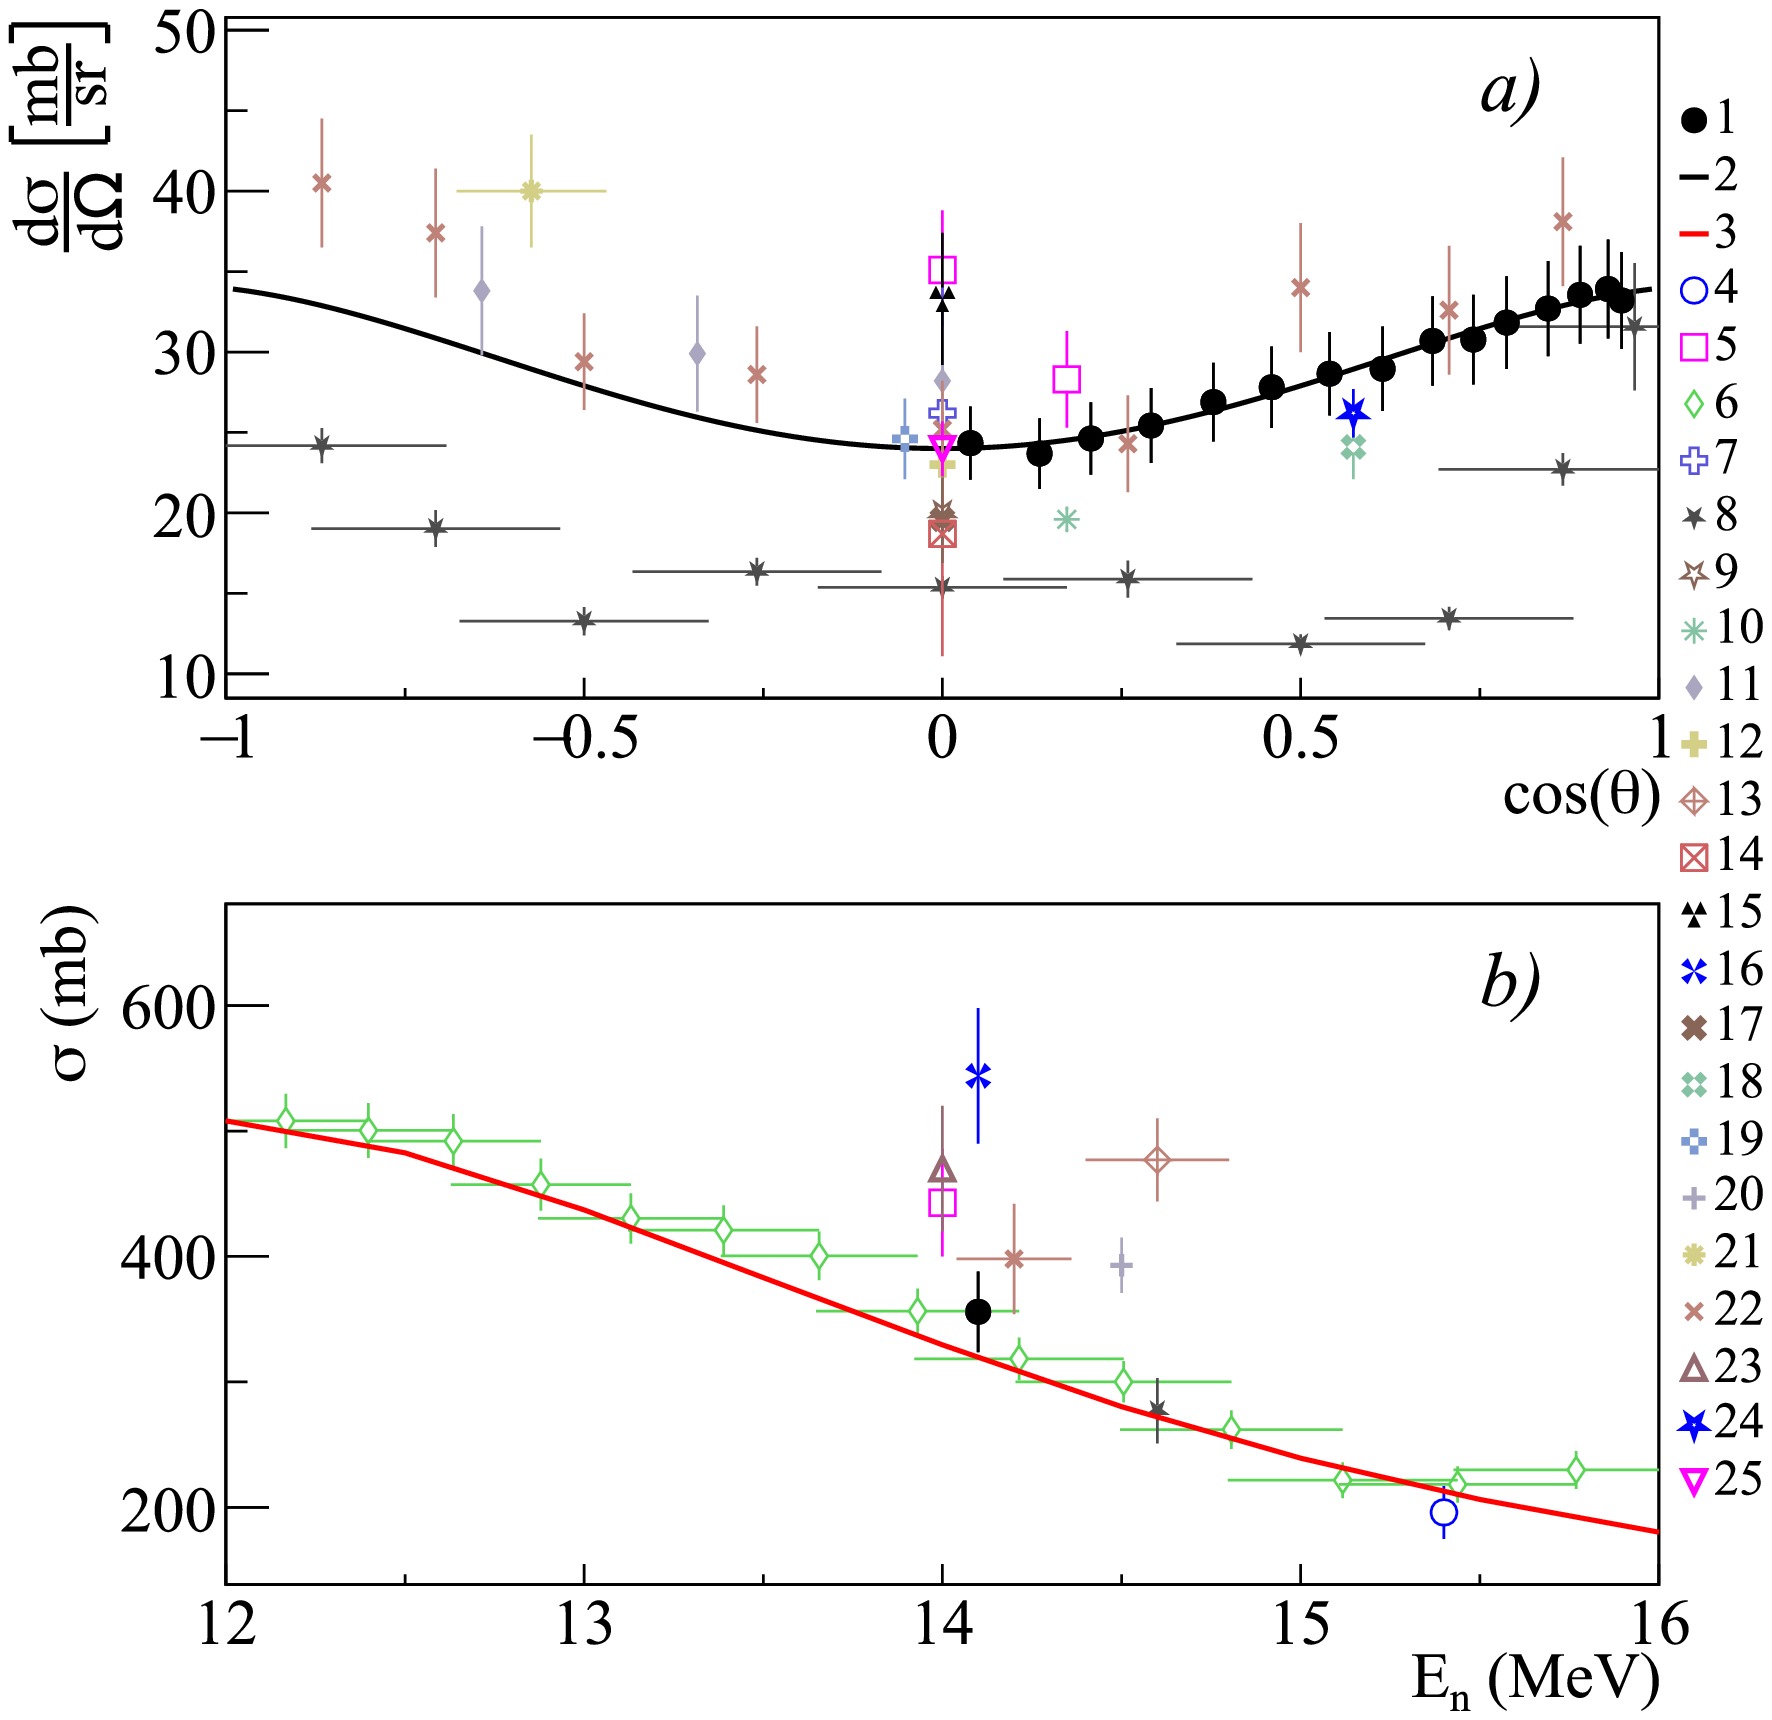
Figure 19. (color online) Differential (a) and total (b) cross sections of
$ \gamma $ -ray emission with energy 1.238 MeV from the reactions 56Fe$ (n,n')^{56} $ Fe and 57Fe$ (n,2n)^{56} $ Fe, in comparison with experimental data of other authors and theoretical calculations based on the TALYS program with default parameters. 1 – data from the present work; 2 – angular distribution fit from the present work using Legendre polynomials; 3 – calculation in TALYS; 4 – Lashuk1994 [31]; 5 – Shalabi1983 [75]; 6 – Negret2014 [79]; 7 – Arya1967 [59]; 8 – Degtyarev1977 [73]; 9 – Sukhanov1970 [72]; 10 – Joensson1969 [71]; 11 – Drake1978 [52]; 12 – Engesser1967 [19]; 13 – Western1965 [81]; 14 – Kinney1972 [65]; 15 – Hasegawa1991 [30]; 16 – Mitsuda2002 [82]; 17 – Hlavac1983 [76]; 18 – Xiamin1982 [74]; 19 – Zong1979 [26]; 20 – Simakov1998 [85]; 21 – Yamamoto1978 [67]; 22 – Abbondanno1973 [49]; 23 – Bezotosnyi1975 [24]; 24 – Jinqiang1988 [77]; 25 – Hongyu1986 [46].$E_{\gamma}$ (MeV)

Reaction Transition, $E_{i}$ 

$(J_{i}^{\pi}) \rightarrow E_{f} (J_{f}^{\pi})$ 

$\sigma$ (mb)

$a_2$ 

$a_4$ 

0.647 52Cr $(n,n')^{52}$ Cr

$3.415(4^+) \rightarrow 2.767(4^+)$ 

$52\pm5$ 

$0.25\pm0.06$ 

$-0.02\pm0.08$ 

53Cr $(n,2n)^{52}$ Cr

0.744 52Cr $(n,n')^{52}$ Cr

$3.113(6^+) \rightarrow 2.369(4^+)$ 

$52\pm5$ 

$0.39\pm0.11$ 

$-0.21\pm0.15$ 

53Cr $(n,2n)^{52}$ Cr

0.935 52Cr $(n,n')^{52}$ Cr

$2.369(4^+) \rightarrow 1.434(2^+)$ 

$214\pm19$ 

$0.22\pm0.02$ 

$-0.04\pm0.02$ 

53Cr $(n,2n)^{52}$ Cr

1.333 52Cr $(n,n')^{52}$ Cr

$2.767(4^+) \rightarrow 1.434(2^+)$ 

$162\pm15$ 

$0.19\pm0.01$ 

$-0.05\pm0.02$ 

53Cr $(n,2n)^{52}$ Cr

1.434 52Cr $(n,n')^{52}$ Cr

$1.434(2^+) \rightarrow $ g.s.

$(0^+)$ 

$700\pm63$ 

$0.14\pm0.01$ 

$-0.01\pm0.02$ 

53Cr $(n,2n)^{52}$ Cr

1.530 52Cr $(n,n')^{52}$ Cr

$2.964(2^+) \rightarrow 1.434(2^+)$ 

$40\pm4$ 

$-0.08\pm0.07$ 

$-0.03\pm0.10$ 

53Cr $(n,2n)^{52}$ Cr

Table 8. Total emission cross sections
$\sigma$ and coefficients of angular distribution expansion in Legendre polynomials$a_2$ and$a_4$ for$\gamma$ -ray lines emitted in the interaction of 14.1 MeV neutrons with chromium nuclei. The energies of the initial (i) and final (f) states are given in MeV.$E_{\gamma}$ (MeV)

Reaction Transition, $E_{i}$ 

$(J_{i}^{\pi}) \rightarrow E_{f} (J_{f}^{\pi})$ 

$\sigma$ (mb)

$a_2$ 

$a_4$ 

0.125 56Fe $(n,d)^{55}$ Mn

$0.125(7/2^-) \rightarrow $ g.s.

$(5/2^-)$ 

$46\pm4$ 

$-0.11\pm0.04$ 

$-0.19\pm0.06$ 

0.212 56Fe $(n,p)^{56}$ Mn

$0.212(4^+) \rightarrow $ g.s.

$(3^+)$ 

$39\pm4$ 

$-0.18\pm0.09$ 

$0.07\pm0.12$ 

57Fe $(n,d)^{56}$ Mn

0.367 56Fe $(n,n')^{56}$ Fe

$3.756(6^+) \rightarrow 3.389(6^+)$ 

$10\pm3$ 

$0.16\pm0.60$ 

$0.15\pm0.74$ 

57Fe $(n,2n)^{56}$ Fe

0.411 54Fe $(n,n')^{54}$ Fe

$2.949(6^+) \rightarrow 2.538(4^+)$ 

$20\pm2$ 

$0.07\pm0.04$ 

$0.02\pm0.05$ 

56Fe $(n,2n)^{55}$ Fe

$0.411(1/2^-) \rightarrow $ g.s.

$(3/2^-)$ 

0.477 56Fe $(n,2n)^{55}$ Fe

$1.408(7/2^-) \rightarrow 0.931(5/2^-)$ 

$17\pm3$ 

$-0.28\pm0.27$ 

$0.05\pm0.36$ 

0.846 56Fe $(n,n')^{56}$ Fe

$0.856(2^+) \rightarrow $ g.s.

$(0^+)$ 

$784\pm71$ 

$0.17\pm0.01$ 

$-0.05\pm0.02$ 

57Fe $(n,2n)^{56}$ Fe

0.931 56Fe $(n,2n)^{55}$ Fe

$0.931(5/2^-) \rightarrow $ g.s.

$(3/2^-)$ 

$78\pm7$ 

$0.20\pm0.02$ 

$-0.03\pm0.03$ 

1.038 56Fe $(n,n')^{56}$ Fe

$3.122(4^+) \rightarrow 2.085(4^+)$ 

$72\pm7$ 

$0.24\pm0.04$ 

$-0.01\pm0.06$ 

57Fe $(n,2n)^{56}$ Fe

1.238 56Fe $(n,n')^{56}$ Fe

$2.085(4^+) \rightarrow 0.846(2^+)$ 

$356\pm32$ 

$0.26\pm0.01$ 

$-0.06\pm0.01$ 

57Fe $(n,2n)^{56}$ Fe

1.303 56Fe $(n,n')^{56}$ Fe

$3.388(6^+) \rightarrow 2.085(4^+)$ 

$136\pm12$ 

$0.31\pm0.02$ 

$-0.09\pm0.03$ 

57Fe $(n,2n)^{56}$ Fe

1.408 54Fe $(n,n')^{54}$ Fe

$1.408(2^+) \rightarrow $ g.s.

$(0^+)$ 

$33\pm3$ 

$0.17\pm0.04$ 

$-0.08\pm0.05$ 

56Fe $(n,2n)^{55}$ Fe

$1.408(7/2^-) \rightarrow $ g.s.

$(3/2^-)$ 

1.670 56Fe $(n,n')^{56}$ Fe

$3.755(6^+) \rightarrow 2.085(4^+)$ 

$43\pm4$ 

$0.42\pm0.04$ 

$-0.15\pm0.05$ 

57Fe $(n,2n)^{56}$ Fe

1.810 56Fe $(n,n')^{56}$ Fe

$2.657(2^+) \rightarrow 0.846(2^+)$ 

$51\pm5$ 

$0.02\pm0.07$ 

$-0.12\pm0.11$ 

57Fe $(n,2n)^{56}$ Fe

2.598 56Fe $(n,n')^{56}$ Fe

$3.445(3^+) \rightarrow 0.846(2^+)$ 

$31\pm3$ 

$-0.31\pm0.03$ 

$-0.06\pm0.04$ 

57Fe $(n,2n)^{56}$ Fe

Table 9. Total emission cross sections
$\sigma$ and coefficients of angular distribution expansion in Legendre polynomials$a_2$ and$a_4$ for$\gamma$ -ray lines emitted in the interaction of 14.1 MeV neutrons with iron nuclei. The energies of the initial (i) and final (f) states are given in MeV.For chromium, a relatively large amount of experimental data is available for both angular distributions and total emission cross sections. In this work, emission cross sections and angular distributions were obtained for
$ \gamma $ -ray lines with energies of 0.647, 0.704, 0.744, 0.935, 1.333, 1.434, and 1.530 MeV emitted in the reactions 52Cr$ (n,n')^{52} $ Cr and 53Cr$ (n,2n)^{52} $ Cr. It is worth noting that the (n,2n) reaction contributes to all observed$ \gamma $ -transitions excited by inelastic scattering of neutrons on chromium nuclei.For the most intense lines with energies of 0.935 and 1.434 MeV (see Figs. 16 and 17), agreement is observed between the results of this work and data from other authors [49, 50, 59, 60, 65−69], both in angular distributions and total emission cross sections.
It should be noted that all measured angular distributions exhibit a pronounced
$ a_2 $ coefficient in the Legendre polynomial expansion (see Table 8), while the influence of the$ a_4 $ coefficient is negligible.Data obtained for iron in the present work include angular distributions and total emission cross sections for
$ \gamma $ -ray lines with energies of 0.125, 0.212, 0.846, 0.931, 1.037, 1.238, 1.303, 1.408, 1.670, 1.810, and 2.598 MeV, generated in$ (n,p) $ ,$ (n,d) $ ,$ (n,n') $ , and$ (n,2n) $ reactions on iron isotopes. It is worth noting that the (n,2n) reaction contributes to all observed$ \gamma $ -transitions excited by inelastic scattering of neutrons on iron nuclei.Comparison of experimental data obtained in the present work with data from other authors [19, 24, 26, 30, 31, 47−49, 52, 55, 59, 60, 65, 67, 70, 72−77, 79−84] for the most intense lines (0.846 and 1.238 MeV) is shown in Figs. 18 and 19. As can be seen from the figures, there is a considerable amount of experimental data available for these lines, both for angular distributions and total cross sections. The values of both total and differential cross sections obtained in this work for these lines agree with data from other authors within the existing scatter of data points.
From the Legendre polynomial expansion coefficients presented in Table 9, it is evident that for all transitions – except for the
$ 2.657(2^+) \rightarrow 0.846(2^+) $ transition in 56Fe (1.810 MeV line) and the$ 0.125(7/2^-) \rightarrow $ g.s.$ (5/2^-) $ transition in 55Mn (0.125 MeV line) – there is a significant contribution from the$ a_2 $ coefficient, with a minor or negligible contribution from the$ a_4 $ coefficient. -
In this work, differential cross-sections of
$ \gamma $ - emission generated in reactions under the action of 14.1 MeV neutrons on the nuclei of carbon, aluminum, silicon, calcium, chromium and iron were measured. The measurements were performed using four LaBr3(Ce) scintillation detectors positioned at angles of 25°, 45°, 60°, and 70° relative to the axis of the generator target – the center of the sample. A key feature of this study was the implementation of the tagged neutron method. The experiments utilized a neutron generator capable of producing 16 separate tagged neutron beams. Combined with the detector system, this enabled measurements of differential cross sections at 64 discrete angles in the$ 17-89^{\circ} $ range. Corrections for multiple neutron scattering and attenuation,$ \gamma $ -ray attenuation, and total detection efficiency – calculated using GEANT4 – were systematically applied. Verification measurements were conducted to validate these correction factors. The analysis yielded angular distribution data for the 4.439 MeV$ \gamma $ -line from carbon, 10$ \gamma $ -lines from aluminum reactions, 6$ \gamma $ -lines from silicon reactions, 8$ \gamma $ -lines from calcium reactions, 16$ \gamma $ -lines from titanium reactions, 6$ \gamma $ -lines from chromium reactions, and 14$ \gamma $ -lines from iron reactions. All angular distributions were approximated through expansion in even-order Legendre polynomials, followed by full solid-angle integration to determine total emission cross sections. The total systematic uncertainty of the obtained data was estimated to be 9.1%. -
We thank D. N. Borisov and S. I. Negovelov for their help in preparing the experiments.
Measurement of the differential and total cross-sections of γ-ray emission induced by 14.1 MeV neutrons for C, Al, Si, Ca, Ti, Cr, and Fe using the tagged neutron method
- Received Date: 2025-08-28
- Available Online: 2026-03-01
Abstract: In this work, differential cross sections of


 DownLoad: