


 Abstract
 HTML
HTML Reference
 Related
 PDF
PDF


-
The study of radioactive decay remains one of the most fundamental areas in nuclear physics, which provides direct insights into nuclear structure, stability, and the limits of the nuclear landscape. As one significant decay mode in heavy and superheavy nuclei, α decays offer reliable information on ground-state energies, half-lives, and shell effects, thereby serving as a sensitive probe of the nuclear many-body system at extreme proton numbers. The study of α decay can be traced back to the discovery of natural radioactivity by Becquerel in 1896 [1], which opened a new era in the study of unstable nuclei. Shortly thereafter, Rutherford identified α particles as helium nuclei and established α decays as a universal decay mode for heavy elements [2, 3]. The empirical Geiger–Nuttall law further revealed a strikingly simple linear relationship between the logarithm of the half-life and the inverse square root of the decay energy [4], highlighting the exponential sensitivity of the decay rates to α-decay energies [5–8]. A microscopic explanation was later provided by Gamow’s as well as Gurney and Condon’s quantum tunneling theory, which described α decay as the penetration of an α cluster through the potential barrier [9–11]. These developments established α decay as the earliest and one of the most profound demonstrations of quantum mechanics on a macroscopic scale. Over the decades, α decay has been studied using a wide range of theoretical approaches. Early models such as the liquid-drop description captured gross features but failed to reproduce detailed systematics [12–16]. Shell-model calculations revealed the important role of closed shells and pairing correlations in stabilizing nuclei [17]. Cluster models emphasized the preformation of the α particle inside the parent nucleus [18]. More sophisticated approaches, including generalized liquid-drop models [19, 20], fission-like models [21, 22], microscopic treatments based on shell model and self-consistently density functional theory such as the relativistic Hartree-Bogoliubov theory [23, 24] have progressively improved the description of nuclear decays.
In current theoretical frameworks, α decay is usually treated as a two-step process: (i) the formation of an α cluster inside the parent nucleus, and (ii) the quantum tunneling through the potential barrier. The preformation factor
$ P_{\alpha} $ characterizes the likelihood of forming an α cluster in the parent nucleus. Once formed, the cluster tunnels through a barrier consisting of nuclear, Coulomb, and centrifugal contributions. The tunneling factor is evaluated via the semiclassical Wentzel-Kramers-Brillouin (WKB) approximation [25–27], while the decay width Γ as well as the half-life$ T_{1/2} $ can be calculated using the two-potential approach (TPA) introduced by Gurvitz in 1987 [28, 29]. On the other hand, since the direct calculation on$ P_{\alpha} $ involves complicated quantum many-body problems, it is usually assumed to be a constant value or extracted by reproducing the experimental data. There have been several studies to calculate the preformation factor from systematics or semi-microscopic models [30–35]. By combining the shell model and cluster model, the α-cluster preformation factor in the parent nucleus$ ^{212} \rm{Po} $ with a doubly-magic core$ ^{208} \rm{Pb} $ has been microscopically calculated lying in the range of 0.23-0.30 [36, 37], as constrained by the reproduction of the experimental α-decay width. Under reasonable approximations for the many-body system, the quarteting wave-function approach is proposed to microscopically calculate the preformation factor in heavy and superheavy nuclei [38, 39]. From the interactions among the valence nucleons in the parent nucleus, the cluster-formation model (CFM) is proposed to calculate the preformation factor of even-even parent nuclei with experimental separation energies [40]. Later, the CFM is further developed to study the odd-A and odd-odd nuclei by considering the effects from the odd-valence nucleons and the blocking [41–44]. This model has been used to systematically calculate the α-cluster preformation factor for heavy and superheavy nuclei, where the consistent value 0.221 for$ ^{212} \rm{Po} $ is also obtained.Besides the preformation factor
$ P_{\alpha} $ , the accuracy of the calculated α-decay half-lives$ T_{1/2} $ also depends critically on the α-decay energies$ Q_{\alpha} $ which can be determined by direct experimental data or available nuclear masses. Since the decay half-life depends exponentially on the decay energy, small uncertainty in nuclear masses can propagate into the predicted half-lives by orders of magnitude differences. Several global nuclear mass models, such as the Weizsäcker-Skyrme model (WS4) [45–49], the finite-range droplet model (FRDM) [50–52], the Duflo–Zuker model (DZ10) [53–55], and the KouraTachibana-Uno-Yamada model (KTUY) [56], are widely used to reproduce the experimental masses given in the Atomic Mass evaluation (AME2020) [57–59] throughout the nuclide chart and predict theoretical masses for possible nuclides. These models incorporate liquid-drop contributions, shell corrections, pairing, and diffuseness effects, and can reproduce known α-decay energies consistently. Recently, the microscopic density functional theory approaches, particularly the relativistic mean-field with PC-PK1 parametrization, have achieved great success in describing nuclear masses across the nuclear chart [60–67]. All these models can reproduce the experimental data very well, however, their extrapolations into regions lacking experimental data can diverge significantly, especially in the superheavy region.The superheavy element region is of particular interest because it involves the existence limit of protons in atomic nuclei. Since the landmark synthesis of the element with Z=118 in 2007 using
$ ^{48} \rm{Ca} $ -induced reactions [68, 69], much attention has been paid to the next candidates, namely the elements with Z=119 and Z=120 [70–74]. Experimental progress has been rapid by selecting$ ^{50} \rm{Ti} $ ,$ ^{51} \rm{V} $ or$ ^{54} \rm{Cr} $ as projectiles [75–78] and the direct identification of new elements relies almost exclusively on the observations of relevant α-decay chains. Considering the particular role of α decay in confirming the discovery of new elements [79], it is necessary to provide more accurate theoretical predictions of the α-decay half-lives for experimental searches. However, there exist large uncertainties for α decays of superheavy elements from the unknown decay energies$ Q_{\alpha} $ as well as the cluster preformation factor$ P_{\alpha} $ . Hence, to perform more consistent theoretical calculations for α decays with known superheavy nuclei and more reliable predictions for unknown ones, it is necessary to study the effects of the predicted α-decay energies and the deduced α-cluster preformation factors from different nuclear mass models.In this work, we use the density-dependent cluster model (DDCM) to study α decays throughout the calculations [80–83], which has been widely used for α decays by inserting the decay energy
$ Q_{\alpha} $ and the preformation factor$ P_{\alpha} $ . The latter is usually obtained from two types of CFM by combining the relevant theoretical nuclear masses [42, 44]. Under different nuclear mass models to estimate the decay energies$ Q_{\alpha} $ , the preformation factors$ P_{\alpha} $ , and the decay half-lives$ T_{1/2} $ , we perform a systematic evaluation of α-decay properties for superheavy nuclei. Using nuclear masses from WS4, FRDM, DZ10, and KTUY as inputs, we calculate α-decay systematics for known and extrapolated superheavy elements, while the data in AME2020 are used as benchmark. We assess their consistency, quantify correlations among preformation factors, and explore the stability trends toward superheavy isotopes with more neutrons. This study provides both the predictive power of these mass models and practical predictions for ongoing experimental searches for new elements. This paper is organized as follows. Section 2 details the theoretical formalism of DDCM and CFM. In Section 3, the corresponding α-decay half-lives along with correlations among theoretical predictions for various nuclear mass models are presented and discussed. A summary is given in Section 4. -
The study of radioactive decay remains one of the most fundamental areas in nuclear physics as it provides direct insights into nuclear structure, stability, and the limits of the nuclear landscape. In particular, α decays, a significant decay mode in heavy and superheavy nuclei, offer reliable information on ground-state energies, half-lives, and shell effects and thus serve as a sensitive probe of the nuclear many-body system at extreme proton numbers. The study of α decay can be traced back to the discovery of natural radioactivity by Becquerel in 1896 [1], which began a new era in the study of unstable nuclei. Shortly thereafter, Rutherford identified α particles as helium nuclei and established α decays as a universal decay mode for heavy elements [2, 3]. The empirical Geiger–Nuttall law further revealed a strikingly simple linear relationship between the logarithm of the half-life and the inverse square root of the decay energy [4], thereby highlighting the exponential sensitivity of the decay rates to α-decay energies [5–8]. A microscopic explanation was later provided by Gamow’s as well as Gurney and Condon’s quantum tunneling theory, which described α decay as the penetration of an α cluster through the potential barrier [9–11]. These developments established α decay as the earliest and one of the most profound demonstrations of quantum mechanics on a macroscopic scale. Over the decades, various theoretical approaches have been used to study α decay. Early models such as the liquid-drop description captured gross features but failed to reproduce detailed systematics [12–16]. Shell-model calculations revealed the important role of closed shells and pairing correlations in stabilizing nuclei [17]. Cluster models emphasized the preformation of the α particle inside the parent nucleus [18]. More sophisticated approaches, including generalized liquid-drop models [19, 20], fission-like models [21, 22], microscopic treatments based on shell model and self-consistently density functional theory such as the relativistic Hartree-Bogoliubov theory [23, 24] have progressively improved the description of nuclear decays.
In current theoretical frameworks, α decay is typically treated as a two-step process: (i) the formation of an α cluster inside the parent nucleus, and (ii) the quantum tunneling through the potential barrier. The preformation factor
$ P_{\alpha} $ characterizes the likelihood of forming an α cluster in the parent nucleus. Once formed, the cluster tunnels through a barrier which contains nuclear, Coulomb, and centrifugal contributions. The tunneling factor is evaluated via the semiclassical Wentzel-Kramers-Brillouin (WKB) approximation [25–27], while the decay width Γ as well as the half-life$ T_{1/2} $ can be calculated using the two-potential approach (TPA) introduced by Gurvitz in 1987 [28, 29]. On the other hand, since the direct calculation on$ P_{\alpha} $ contains complex quantum many-body problems, it is typically considered a constant value or extracted by reproducing the experimental data. Several studies have calculated the preformation factor using systematics or semi-microscopic models [30–35]. A combination of the shell and cluster models yielded a α-cluster preformation factor in the parent nucleus$ ^{212} \rm{Po} $ with a doubly-magic core$ ^{208} \rm{Pb} $ in the range of 0.23–0.30 [36, 37], as constrained by the reproduction of the experimental α-decay width. Under reasonable approximations for the many-body system, the preformation factor in heavy and superheavy nuclei can be microscopically calculated using the quarteting wave-function approach [38, 39]. Based on the interactions among the valence nucleons in the parent nucleus, the preformation factor of even-even parent nuclei with experimental separation energies can be calculated using the cluster-formation model (CFM) [40]. The CFM has been further developed to study the odd-A and odd-odd nuclei by considering the effects from the odd-valence nucleons and the blocking [41–44]. This model has been used to systematically calculate the α-cluster preformation factor for heavy and superheavy nuclei, which yields a consistent value of 0.221 for$ ^{212} \rm{Po} $ .In addition to the preformation factor
$ P_{\alpha} $ , the accuracy of the calculated α-decay half-lives$ T_{1/2} $ also depends critically on the α-decay energies$ Q_{\alpha} $ which can be determined using experimental data or available nuclear masses. As the decay half-life depends exponentially on the decay energy, a small uncertainty in nuclear masses can propagate into the predicted half-lives by differences of several orders of magnitude. Several global nuclear mass models, such as the Weizsäcker-Skyrme model (WS4) [45–49], finite-range droplet model (FRDM) [50–52], Duflo–Zuker model (DZ10) [53–55], and KouraTachibana-Uno-Yamada model (KTUY) [56], are widely used to reproduce the experimental masses given in the Atomic Mass evaluation (AME2020) [57–59] throughout the nuclide chart and predict theoretical masses for possible nuclides. These models incorporate liquid-drop contributions, shell corrections, pairing, and diffuseness effects, and can reproduce known α-decay energies consistently. Recently, the microscopic density functional theory approaches, particularly the relativistic mean-field with PC-PK1 parametrization, have successfully been used to describe nuclear masses across the nuclear chart [60–67]. These models can accurately reproduce the experimental data, however, their extrapolations into regions lacking experimental data can diverge significantly, especially in the superheavy region.The superheavy element region is of particular interest because it contains the existence limit of protons in atomic nuclei. Since the landmark synthesis of the element with Z=118 in 2007 using
$ ^{48} \rm{Ca} $ -induced reactions [68, 69], significant interest has emerged towards elements with Z=119 and Z=120 [70–74]. Experimental progress has been rapid by selecting$ ^{50} \rm{Ti} $ ,$ ^{51} \rm{V} $ , or$ ^{54} \rm{Cr} $ as projectiles [75–78] and the direct identification of new elements relies nearly exclusively on the observations of relevant α-decay chains. Considering the particular role of α decay in confirming the discovery of new elements [79], experimental research requires more accurate theoretical predictions of the α-decay half-lives. However, α decays of superheavy elements contain large uncertainties from the unknown decay energies$ Q_{\alpha} $ as well as the cluster preformation factor$ P_{\alpha} $ . Hence, consistent theoretical calculations for α decays with known superheavy nuclei and more reliable predictions for unknown ones require an examination of the effects of the predicted α-decay energies and the deduced α-cluster preformation factors from various nuclear mass models.In this work, we use the density-dependent cluster model (DDCM) to study α decays throughout the calculations [80–83], which has been widely used for α decays by inserting the decay energy
$ Q_{\alpha} $ and the preformation factor$ P_{\alpha} $ . The latter is usually obtained from two types of CFM by combining the relevant theoretical nuclear masses [42, 44]. To estimate the decay energies$ Q_{\alpha} $ , the preformation factors$ P_{\alpha} $ , and the decay half-lives$ T_{1/2} $ under various nuclear mass models, we systematically evaluate the α-decay properties of superheavy nuclei. Using nuclear masses from WS4, FRDM, DZ10, and KTUY as inputs, we calculate α-decay systematics for known and extrapolated superheavy elements, while the data in AME2020 are used as benchmark. We assess their consistency, quantify correlations among preformation factors, and explore the stability trends toward superheavy isotopes with more neutrons. This study provides both the predictive power of these mass models and practical predictions for ongoing experimental searches for new elements. This paper is organized as follows. Section II details the theoretical formalism of DDCM and CFM. In Section III, the corresponding α-decay half-lives along with correlations among theoretical predictions for various nuclear mass models are presented and discussed. A summary is given in Section IV. -
Within the density-dependent cluster model (DDCM), the total potential
$ V(R) $ between the α cluster and the daughter nucleus is the sum of the nuclear potential$ V_N(R) $ , the Coulomb potential$ V_C(R) $ , and the centrifugal potential$ V_{\ell}(R) $ :$ \begin{array}{l} V(R)=V_N(R)+V_C(R)+V_{\ell}(R), \end{array} $
(1) where R represents the distance between the centers of mass of the α cluster and the daughter nucleus. The nuclear potential
$ V_N(R) $ and the Coulomb potential$ V_C(R) $ are calculated using the double-folding model [82–85]:$ V_N(R)=\lambda\int\int \rho_1(\mathbf{r_1})\rho_2(\mathbf{r_2})g_{00}(s,\epsilon)d\mathbf{r_1}d\mathbf{r_2}, $
(2) $ V_C(R)=\int\int \rho_{1p}(\mathbf{r_1})\rho_{2p}(\mathbf{r_2})\dfrac{e^2}{|\mathbf{s}|}d\mathbf{r_1}d\mathbf{r_2}, $
(3) where
$ \rho_1 $ and$ \rho_2 $ represent the mass density distributions of the α cluster and the daughter nucleus, while$ \rho_{1p} $ and$ \rho_{2p} $ denote their proton density distributions, respectively. The density distribution of the α cluster is usually taken as the Gaussian form [82, 84, 85]$ \begin{array}{l} \rho_1(\mathbf{r_1})=0.4229\exp(-0.7024r_1^2), \end{array} $
(4) and the density distribution of the daughter nucleus is taken as the standard two-parameter Fermi form
$ \rho_2(r_2)=\dfrac{\rho_{20}}{1+\exp\left(\dfrac{r_2-c}{a}\right)},$
(5) where the half-radius
$ c=1.07A_2^{1/3} $ fm and the diffuseness parameter a = 0.54 fm are taken from textbooks. The value of$ \rho_{20} $ is determined by integrating the density distribution equivalent to the mass number$ A_2 $ of the daughter nucleus. The quantity$ g_{00}(s,\epsilon) $ in Eq. (2) denotes the M3Y-Reid effective nucleon-nucleon interaction$ g_{00}(s,\epsilon)=7999\dfrac{e^{-4s}}{4s}-2134\dfrac{e^{-2.5s}}{2.5s}-276(1-0.005\epsilon)\delta(s), $
(6) where
$ \epsilon=Q_{\alpha}/A_1 $ with$ A_1=4 $ being the mass number of α cluster. The centrifugal potential$ V_{\ell}(R) $ is defined as$ \begin{array}{l} V_{\ell}(R)=\dfrac{\hbar^2}{2\mu}\dfrac{\ell(\ell+1)}{R^2}, \end{array} $
(7) where
$ \ell $ denotes the orbital angular momentum carried by the α cluster and μ represents the reduced mass of the two-body system. For favored α decays with no changes of angular momentum and parity between the parent and daughter nuclei,$ \ell=0 $ is adopted, which applies to the majority of superheavy nuclei considered in this work. For unfavored decays, the minimum allowed$ \ell $ consistent with angular momentum and parity conservation is used. The nuclear potential strength λ in Eq. (2) is determined to satisfy the Bohr-Sommerfeld quantization condition [86–88]$ \begin{array}{l} \displaystyle\int_{R_1}^{R_2}\sqrt{\dfrac{2\mu}{\hbar^2}\left|Q_{\alpha}-V(R)\right|}dr=(G-\ell+1)\dfrac{\text{π}}{2}, \end{array} $
(8) where
$ R_1 $ and$ R_2 $ are the first two classical turning points determined by$ V(R)=Q_{\alpha} $ . The global quantum number G is usually taken as [83, 89]$ G=\left\{\begin{array}{lll} 22 & N>126,\\ 20 & 82<N\leqslant126,\\ 18 & N\leqslant 82. \end{array}\right. $
(9) The α-cluster penetration factor through the potential barrier is calculated using the well-known WKB approximation [25–27]
$ \begin{array}{l} P_T=\mathrm{exp}\left[-2 \displaystyle\int_{R_2}^{R_3}\sqrt{\dfrac{2\mu}{\hbar^2}|Q-V(R)|}dR\right], \end{array} $
(10) where
$ R_3 $ is the third classical turning point. Then the α-decay width Γ can be obtained using the TPA$ \begin{array}{l} \Gamma=P_\alpha F\dfrac{\hbar^2}{4\mu}P_T, \end{array} $
(11) where
$ P_{\alpha} $ is the α-cluster preformation factor in the parent nucleus, which will be discussed in detail in the next section. The normalization factor F is defined by the TPA and can be calculated by [28, 29]$ \begin{array}{l} F \displaystyle\int_{R_1}^{R_2}\dfrac{1}{2\sqrt{\dfrac{2\mu}{\hbar^2}|Q-V(R)|}}dR=1. \end{array} $
(12) Finally, the α-decay half-life can be calculated using the famous relationship
$ T_{ \rm{cal}}=\hbar\ln2/\Gamma $ . By fixing the α-cluster preformation factor as unity in the calculation of the decay half-life$ T_{ \rm{ext}} $ , it can be also extracted from the experimental decay half-life$ T_{ \rm{expt}} $ by$ \begin{array}{l} P^{ \rm{ext}}_{\alpha}=\dfrac{T_{ \rm{ext}}}{T_{ \rm{expt}}}. \end{array} $
(13) Hence, we can systematically compare the deduced preformation factors from theoretical mass models and the extracted ones from experimental decay half-lives.
-
Within the DDCM, the total potential
$ V(R) $ between the α cluster and the daughter nucleus is the sum of the nuclear potential$ V_N(R) $ , Coulomb potential$ V_C(R) $ , and centrifugal potential$ V_{\ell}(R) $ :$ \begin{array}{l} V(R)=V_N(R)+V_C(R)+V_{\ell}(R), \end{array} $
(1) where R represents the distance between the centers of mass of the α cluster and the daughter nucleus. The nuclear potential
$ V_N(R) $ and Coulomb potential$ V_C(R) $ are calculated using the double-folding model [82–85]:$ V_N(R)=\lambda\int_{ }^{ }\int_{ }^{ }\rho_1(\boldsymbol{r_1})\rho_2(\boldsymbol{r_2})g_{00}(s,\epsilon)\mathrm{d}\boldsymbol{r_1}\mathrm{d}\boldsymbol{r_2}, $
(2) $ V_C(R)=\int_{ }^{ }\int_{ }^{ }\rho_{1p}(\boldsymbol{r_1})\rho_{2p}(\boldsymbol{r_2})\dfrac{e^2}{|\boldsymbol{s}|}\mathrm{d}\boldsymbol{r_1}\mathrm{d}\boldsymbol{r_2}, $
(3) where
$ \rho_1 $ and$ \rho_2 $ represent the mass density distributions of the α cluster and daughter nucleus, while$ \rho_{1p} $ and$ \rho_{2p} $ denote their proton density distributions, respectively. The density distribution of the α cluster is commonly taken as the Gaussian form [82, 84, 85]$ \begin{array}{l} \rho_1(\boldsymbol{r_1})=0.4229\exp(-0.7024r_1^2), \end{array} $
(4) and the density distribution of the daughter nucleus is taken as the standard two-parameter Fermi form
$ \rho_2(r_2)=\dfrac{\rho_{20}}{1+\exp\left(\dfrac{r_2-c}{a}\right)},$
(5) where the half-radius
$ c=1.07A_2^{1/3} $ fm and diffuseness parameter a = 0.54 fm are referenced from textbooks. The value of$ \rho_{20} $ is determined by integrating the density distribution equivalent to the mass number$ A_2 $ of the daughter nucleus. The quantity$ g_{00}(s,\epsilon) $ in Eq. (2) denotes the M3Y-Reid effective nucleon-nucleon interaction$ g_{00}(s,\epsilon)=7999\dfrac{e^{-4s}}{4s}-2134\dfrac{e^{-2.5s}}{2.5s}-276(1-0.005\epsilon)\delta(s), $
(6) where
$ \epsilon=Q_{\alpha}/A_1 $ in which$ A_1=4 $ is the mass number of the α cluster. The centrifugal potential$ V_{\ell}(R) $ is defined as$ \begin{array}{l} V_{\ell}(R)=\dfrac{\hbar^2}{2\mu}\dfrac{\ell(\ell+1)}{R^2}, \end{array} $
(7) where
$ \ell $ denotes the orbital angular momentum carried by the α cluster and μ represents the reduced mass of the two-body system. For favored α decays with no changes of angular momentum and parity between the parent and daughter nuclei,$ \ell=0 $ is adopted, which applies to the majority of superheavy nuclei considered in this work. For unfavored decays, the minimum allowed$ \ell $ , which is consistent with angular momentum and parity conservation, is used. The nuclear potential strength λ in Eq. (2) is determined to satisfy the Bohr-Sommerfeld quantization condition [86–88]$ \begin{array}{l} \displaystyle\int_{R_1}^{R_2}\sqrt{\dfrac{2\mu}{\hbar^2}\left|Q_{\alpha}-V(R)\right|}\mathrm{d}r=(G-\ell+1)\dfrac{\text{π}}{2}, \end{array} $
(8) where
$ R_1 $ and$ R_2 $ are the first two classical turning points determined by$ V(R)=Q_{\alpha} $ . The global quantum number G is usually taken as [83, 89]$ G=\left\{\begin{array}{lll} 22 & N>126,\\ 20 & 82<N\leqslant126,\\ 18 & N\leqslant 82. \end{array}\right. $
(9) The α-cluster penetration factor through the potential barrier is calculated using the well-known WKB approximation [25–27]
$ \begin{array}{l}P_T=\mathrm{exp}\left[-2\displaystyle\int_{R_2}^{R_3}\sqrt{\dfrac{2\mu}{\hbar^2}|Q-V(R)|}\mathrm{d}R\right],\end{array} $
(10) where
$ R_3 $ is the third classical turning point. Then, the α-decay width Γ can be obtained using the TPA$ \begin{array}{l} \Gamma=P_\alpha F\dfrac{\hbar^2}{4\mu}P_T, \end{array} $
(11) where
$ P_{\alpha} $ is the α-cluster preformation factor in the parent nucleus, which will be discussed in detail in the next section. The normalization factor F is defined by the TPA and can be calculated using [28, 29]$ \begin{array}{l}F\displaystyle\int_{R_1}^{R_2}\dfrac{1}{2\sqrt{\dfrac{2\mu}{\hbar^2}|Q-V(R)|}}\mathrm{d}R=1.\end{array} $
(12) Finally, the α-decay half-life can be calculated using
$ T_{ \rm{cal}}=\hbar\ln2/\Gamma $ . By fixing the α-cluster preformation factor as unity in the calculation of the decay half-life$ T_{ \rm{ext}} $ , it can be also be extracted from the experimental decay half-life$ T_{ \rm{expt}} $ using$ \begin{array}{l} P^{ \rm{ext}}_{\alpha}=\dfrac{T_{ \rm{ext}}}{T_{ \rm{expt}}}. \end{array} $
(13) Hence, we can systematically compare the deduced preformation factors from the theoretical and extracted mass models from experimental decay half-lives.
-
Within the DDCM framework, α decay is treated as the preformed α cluster inside the parent nucleus penetrating the potential barrier. Hence, the preformation factor
$ P_{\alpha} $ is necessary for the α-decay process. Total microscopic calculations are generally impractical for heavy and superheavy nuclei owing to the complexity of many-body correlations. Here, we use the recently developed CFM to provide systematic evaluations.The CFM is originally proposed to calculate the α-cluster preformation factor for even-even parent nuclei with the ratio of the effective formation energy
$ E_{f\alpha} $ and the relevant total energy E of the α cluster$ \begin{array}{l} P^{ \rm{CFM}}_{\alpha}=\dfrac{E_{f_{\alpha}}}{E}, \end{array} $
(14) where the above two energies can be calculated by using the relevant proton-, neutron-, and α-cluster separation energies. This approach is further developed to study the α decays for odd-A and odd–odd nuclei by including the odd-nucleon effects with two separate treatments. By considering the blocking effects of unpaired nucleons on the separation energies, Deng et al. proposed the use of the relevant two-nucleon separation energies in place of the single-nucleon energies for the effective formation energy
$ E_{f\alpha} $ [42]. This CFM framework is referred to as Type I in this paper. The corresponding formulas for$ E_{f\alpha} $ and E can be denoted as$ E_{f_{\alpha}}=\left\{\begin{array}{llll} 2S_p(N,Z)+2S_n(N,Z)-S_{\alpha}(N,Z), \quad e-e\\ 2S_p(N,Z)+S_{2n}(N,Z)-S_{\alpha}(N,Z), \quad e-o\\ S_{2p}(N,Z)+2S_n(N,Z)-S_{\alpha}(N,Z), \quad o-e\\ S_{2p}(N,Z)+S_{2n}(N,Z)-S_{\alpha}(N,Z), \quad o-o \end{array}\right.$
(15) and
$ \begin{array}{l} E=S_{\alpha}(N,Z), \end{array} $
(16) where
$ S_p $ ,$ S_n $ ,$ S_{2p} $ ,$ S_{2n} $ , and$ S_{\alpha} $ represent the separation energies of a single proton, single neutron, two protons, two neutrons, and an α cluster, respectively. These can be calculated from the relevant binding energies of the corresponding nuclei using$ \left\{\begin{array}{ll} S_p(N,Z)=B(N,Z)-B(N,Z-1), \\ S_n(N,Z)=B(N,Z)-B(N-1,Z), \\ S_{2p}(N,Z)=B(N,Z)-B(N,Z-2), \\ S_{2n}(N,Z)=B(N,Z)-B(N-2,Z), \\ S_{\alpha}(N,Z)=B(N,Z)-B(N-2,Z-2) \end{array}\right. $
(17) On the other hand, by considering the blocking effects of the unpaired nucleons on the residual nuclei, Ahmed et al. [44] introduced the odd-nucleon effects into both the separation energies and the corresponding total energies E. This CFM framework is referred to as Type II, and the explicit expressions can be denoted as
$ E_{f_{\alpha}}=\left\{\begin{array}{llll} 2S_p(N,Z)+2S_n(N,Z) -S_{\alpha}(N,Z),\quad e-e \\ \begin{aligned}[b] 2S_p(N,Z-1)+2S_n(N,Z-1) \\ \qquad -S_{\alpha}(N,Z-1), \quad e-o \end{aligned}\\ \begin{aligned}[b] 2S_p(N-1,Z)+2S_n(N-1,Z) \\ \qquad -S_{\alpha}(N-1,Z),\quad o-e \end{aligned}\\ \begin{aligned}[b] 2S_p(N-1,Z-1)+2S_n(N-1,Z) \\ \qquad-S_{\alpha}(N-1,Z), \quad o-o \end{aligned} \end{array}\right. $
(18) and
$ E=\left\{\begin{array}{llll} B(N,Z)-B(N-2,Z-2), \quad e-e\\ B(N,Z)-B(N-2,Z-3), \quad e-o\\ B(N,Z)-B(N-3,Z-2), \quad o-e\\ B(N,Z)-B(N-3,Z-3). \quad o-o \end{array}\right.$
(19) The above formulism shows that the α-cluster preformation factor from both types of CFM are closely related to the relevant binding energies. Thus, both the α-decay energies
$ Q_{\alpha} $ and the preformation factors$ P_{\alpha} $ can be deduced from the binding energies from nuclear mass models. The corresponding α-decay half-lives can be calculated under the double-folding potential within the DDCM. Hence, different mass predictions with various nuclear mass models can result in diverse α-decay energies and α-cluster preformation factors, as well as the corresponding α-decay half-lives, especially in superheavy element region with relatively large uncertainty of theoretically predicted nuclear masses. -
Within the DDCM framework, α decay is treated as the preformed α cluster inside the parent nucleus penetrating the potential barrier. Hence, the preformation factor
$ P_{\alpha} $ is necessary for the α-decay process. Total microscopic calculations are generally impractical for heavy and superheavy nuclei because of the complexity of many-body correlations. Here we use the recently developed cluster formation model (CFM) to provide systematic evaluations.The CFM is originally proposed to calculate α-cluster preformation factor for even-even parent nuclei with the ratio of the effective formation energy
$ E_{f\alpha} $ and the relevant total energy E of the α cluster$ \begin{array}{l} P^{ \rm{CFM}}_{\alpha}=\dfrac{E_{f_{\alpha}}}{E}, \end{array} $
(14) where the above two energies can be calculated by using the relevant proton-, neutron-, and α-cluster separation energies. Shortly after, this approach is further developed to study the α decays for odd-A and odd–odd nuclei by including the odd-nucleon effects with two separate treatments. By considering the blocking effects of unpaired nucleons on the separation energies, Deng et al. proposed to use the relevant two-nucleon separation energies instead of the single-nucleon energies for the effective formation energy
$ E_{f\alpha} $ [42]. Here we call this CFM framework as Type I. The corresponding formulas for$ E_{f\alpha} $ and E can be denoted as$ E_{f_{\alpha}}=\left\{\begin{array}{llll} 2S_p(N,Z)+2S_n(N,Z)-S_{\alpha}(N,Z), \quad e-e\\ 2S_p(N,Z)+S_{2n}(N,Z)-S_{\alpha}(N,Z), \quad e-o\\ S_{2p}(N,Z)+2S_n(N,Z)-S_{\alpha}(N,Z), \quad o-e\\ S_{2p}(N,Z)+S_{2n}(N,Z)-S_{\alpha}(N,Z), \quad o-o \end{array}\right.$
(15) and
$ \begin{array}{l} E=S_{\alpha}(N,Z), \end{array} $
(16) where
$ S_p $ ,$ S_n $ ,$ S_{2p} $ ,$ S_{2n} $ , and$ S_{\alpha} $ represent the separation energies of a single proton, single neutron, two protons, two neutrons, and an α cluster, respectively. They can be calculated from the relevant binding energies of the corresponding nuclei by$ \left\{\begin{array}{ll} S_p(N,Z)=B(N,Z)-B(N,Z-1), \\ S_n(N,Z)=B(N,Z)-B(N-1,Z), \\ S_{2p}(N,Z)=B(N,Z)-B(N,Z-2), \\ S_{2n}(N,Z)=B(N,Z)-B(N-2,Z), \\ S_{\alpha}(N,Z)=B(N,Z)-B(N-2,Z-2) \end{array}\right. $
(17) On the other hand, by considering the blocking effects of the unpaired nucleons on the residual nuclei, Ahmed et al. [44] introduced the odd-nucleon effects into both the separation energies and the corresponding total energies E. We call this CFM framework as Type II and the explicit expressions can be denoted as
$ E_{f_{\alpha}}=\left\{\begin{array}{llll} 2S_p(N,Z)+2S_n(N,Z) -S_{\alpha}(N,Z),\quad e-e \\ \begin{aligned}[b] 2S_p(N,Z-1)+2S_n(N,Z-1) \\ \qquad -S_{\alpha}(N,Z-1), \quad e-o \end{aligned}\\ \begin{aligned}[b] 2S_p(N-1,Z)+2S_n(N-1,Z) \\ \qquad -S_{\alpha}(N-1,Z),\quad o-e \end{aligned}\\ \begin{aligned}[b] 2S_p(N-1,Z-1)+2S_n(N-1,Z) \\ \qquad-S_{\alpha}(N-1,Z), \quad o-o \end{aligned} \end{array}\right. $
(18) and
$ E=\left\{\begin{array}{llll} B(N,Z)-B(N-2,Z-2), \quad e-e\\ B(N,Z)-B(N-2,Z-3), \quad e-o\\ B(N,Z)-B(N-3,Z-2), \quad o-e\\ B(N,Z)-B(N-3,Z-3). \quad o-o \end{array}\right.$
(19) From above formulism, we can see that the α-cluster preformation factor from both the two types of CFM are closely related to the relevant binding energies. With the binding energies from nuclear mass models, both the α-decay energies
$ Q_{\alpha} $ and the preformation factors$ P_{\alpha} $ can be deduced. Under the double-folding potential within the DDCM, the corresponding α-decay half-lives can be calculated. Hence, different mass predictions with various nuclear mass models can result in diverse α-decay energies and α-cluster preformation factors, as well as the corresponding α-decay half-lives, especially in superheavy element region with relatively large uncertainty of theoretically predicted nuclear masses. -
Within the DDCM and CFM framework, systematic evaluations of α-decay properties can be achieved across known and extrapolated superheavy nuclei by combining nuclear mass models. Using theoretical nuclear masses from WS4, FRDM, DZ10, and KTUY, we computed α-decay energies
$ Q_{\alpha} $ , α-cluster preformation factors$ P_{\alpha} $ , and α-decay half-lives$ T_{1/2} $ . The decay energies deduced from the experimental nuclear masses given in AME2020 are employed as benchmark calculation.Since the decay energy is crucial for α decays, we first examine the consistency between the theoretical decay energies and the experimental data deduced from AME2020 for all known α-decay superheavy parent nuclei from
$ ^{228}{ \rm{Th}} $ to$ ^{295}{ \rm{Og}} $ . Table 1 lists the corresponding root-mean-square error (RMSE) for the α-decay energies, which is calculated usingWS4 FRDM DZ10 KTUY RMSE 0.2455 0.3679 0.5319 0.4371 Table 1. Root mean square errors (RMSEs) of the decay energy
$ Q_{\alpha} $ deduced using different mass models compared with those from the experimental masses given in AME2020 for all known α-decay superheavy parent nuclei ranging from$ ^{228}{ \rm{Th}} $ to$ ^{295}{ \rm{Og}} $ .$ \rm{RMSE}=\sqrt{\dfrac{1}{N}\sum\limits^N_{i=1}(Q^{ \rm{theo}}_{\alpha,i}-Q^{ \rm{expt}}_{\alpha,i})^2}, $
(20) where N denotes the number of the involved experimental α-decay energies. Table 1 shows that in general, all nuclear mass models can well reproduce the deduced experimental decay energies with very small RMSEs. Specifically, the WS4 and FRDM results achieve the smallest errors, typically below 0.4 MeV, whereas the DZ10 model displays the largest error; the results for KTUY lie within the range. The large differences for the α-decay energies from the DZ10 model could result in relatively large discrepancies for the corresponding theoretical α-decay half-lives.
To study the correlations for the α-decay energies among different nuclear masses, the corresponding Pearson correlation coefficient P is calculated, which is defined as
$ \begin{array}{l} P=\dfrac{ \displaystyle\sum(x_i-\overline{x})(y_i-\overline{y})}{\sqrt{ \displaystyle\sum(x_i-\overline{x})^2}\sqrt{ \displaystyle\sum(y_i-\overline{y})^2}}. \end{array} $
(21) The Pearson coefficient P is widely used in statistics to measure the degree of linear dependence between two sets of variables
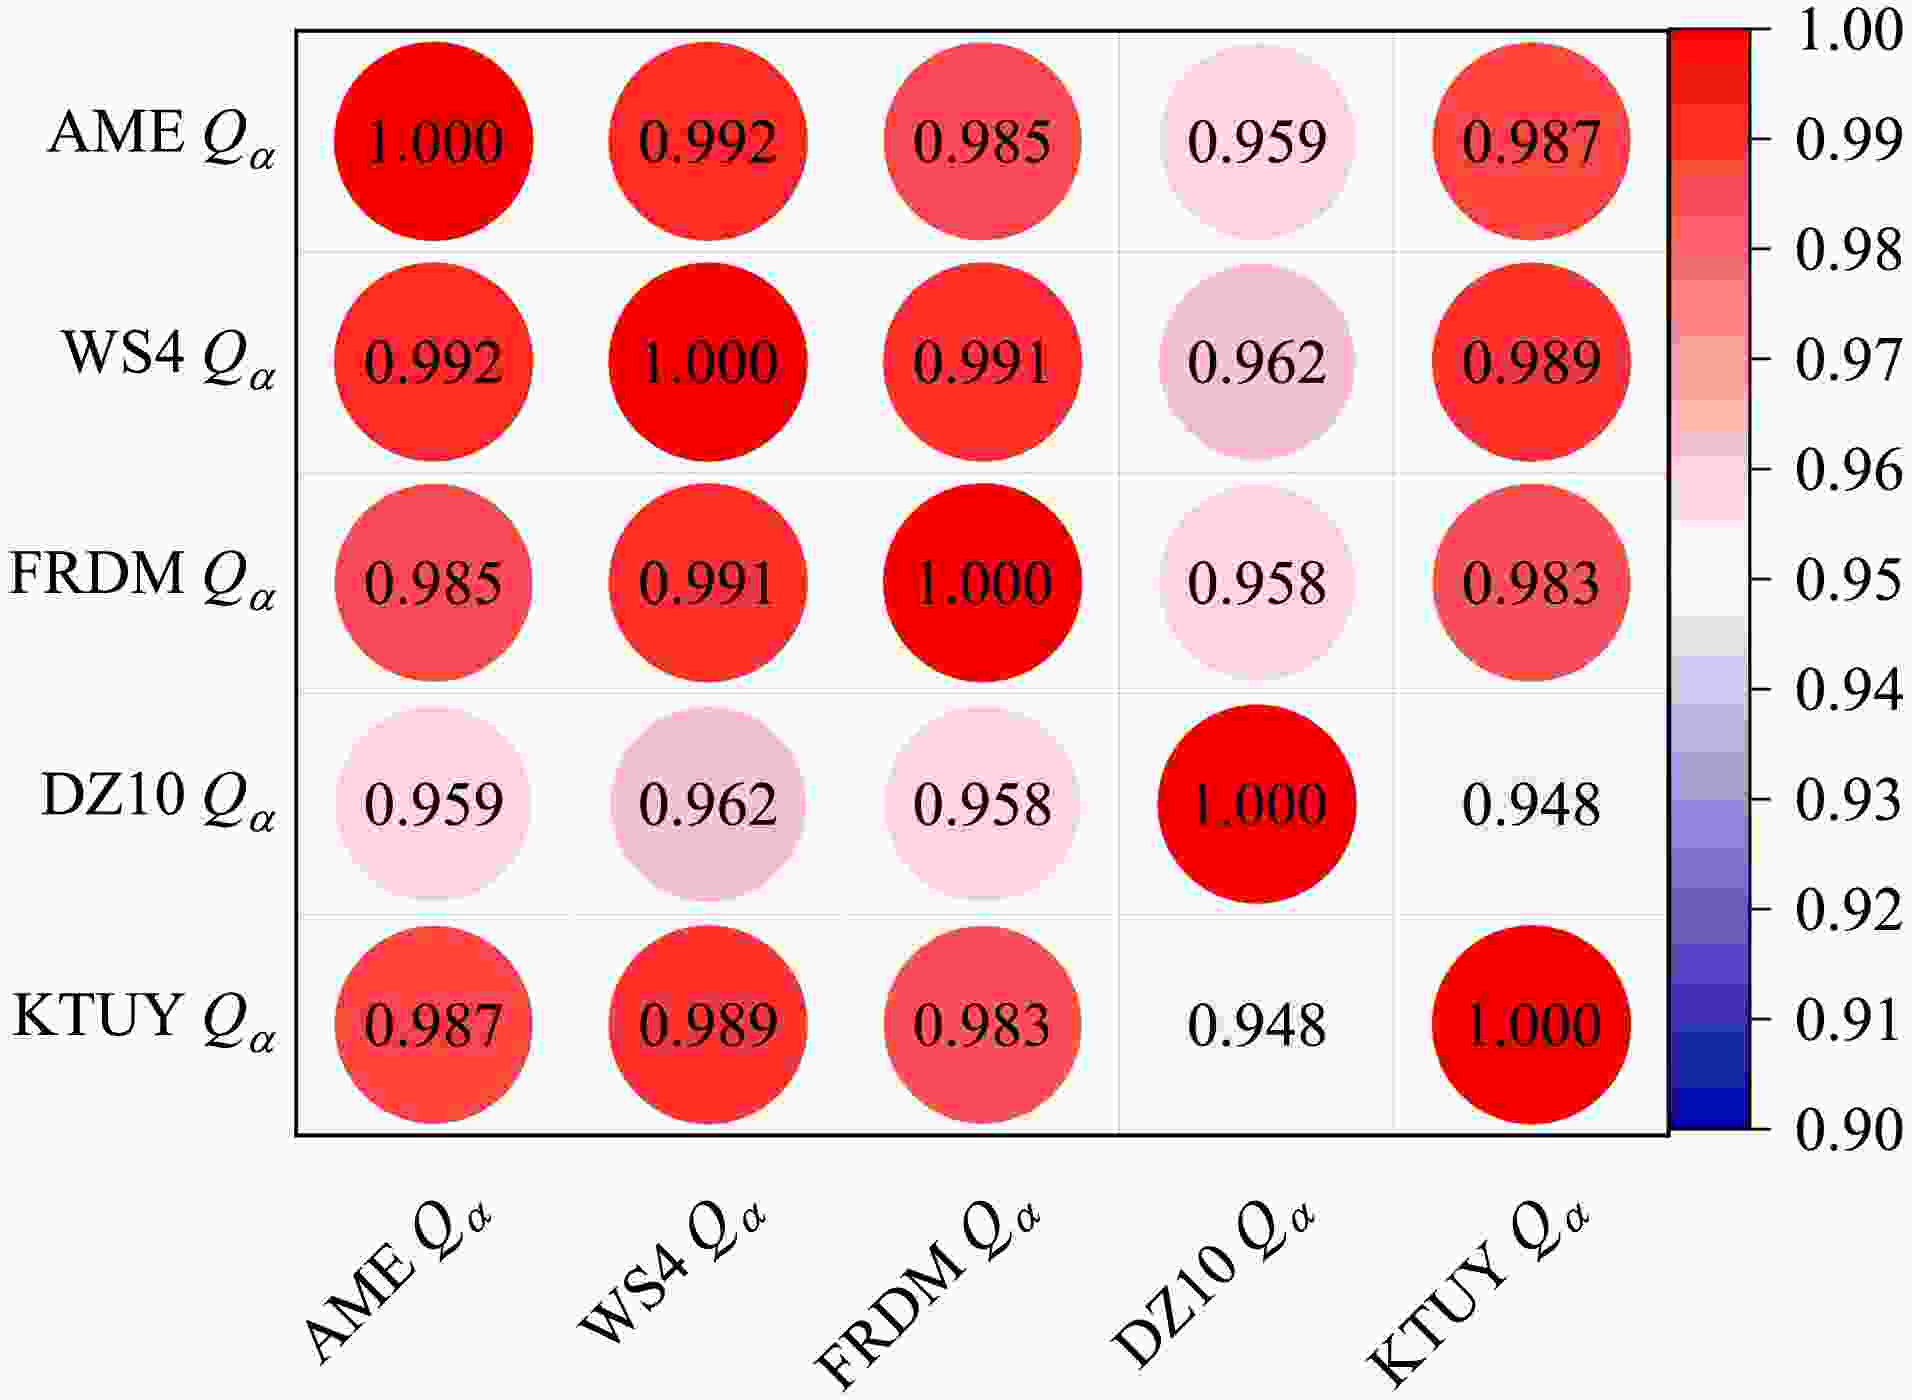
$\{ x_i \}$ and$\{ y_i \}$ , where$ \overline{x} $ and$ \overline{y} $ denote their averaged values, respectively. The absolute value of the Pearson coefficient P lies in the range of$ 0-1 $ , where$ |P|\sim1.0 $ indicates a very strong correlation and$ |P|\sim0.0 $ demonstrates a very weak correlation between$\{ x_i \}$ and$\{ y_i \}$ . In Fig. 1, we show the results of the Pearson coefficients for the decay energies among different nuclear masses. Clearly, all values of the Pearson coefficient between the theoretical mass models and the AME2020 data are very close to unity, which indicates very good consistency for reproducing the experimental data across all nuclear mass models. In addition, the very large Pearson coefficients among the different mass models also demonstrate the consistency to reproduce the available data. The DZ10 model corresponds to the smallest Pearson coefficients, which is in agreement with the largest RMSE value shown in Table 1.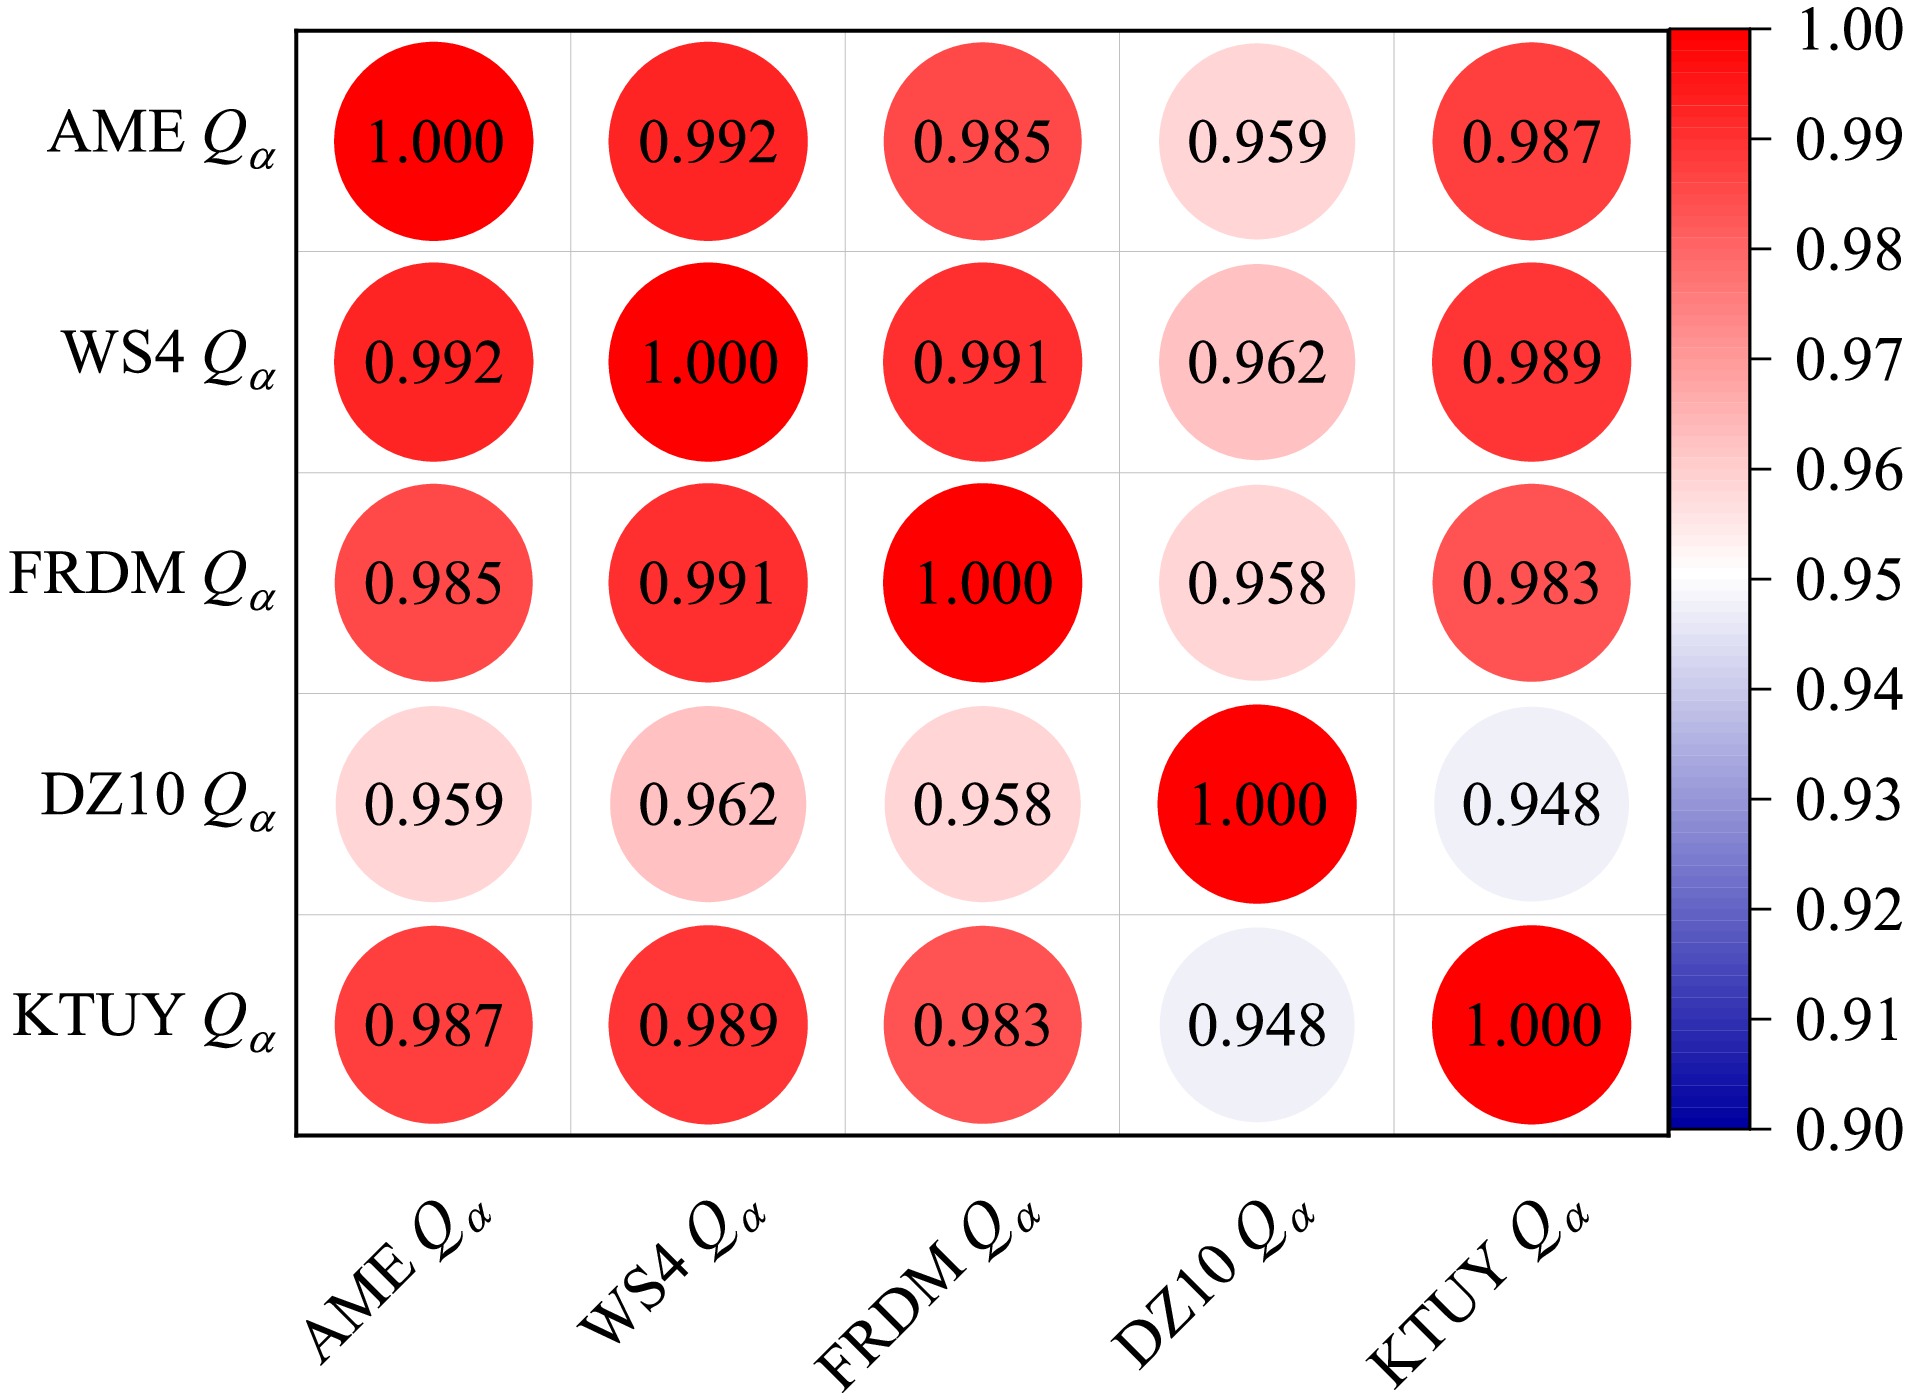
Figure 1. (color online) Pearson correlations among different decay energies
$ Q_{\alpha} $ deduced from WS4, FRDM, DZ10, and KTUY mass models and the experimental masses given in AME2020.These α-decay energies can be used to further extract the α-cluster preformation factors
$ P^{ \rm{ext}}_{\alpha} $ from the experimental decay half-lives using Eq. (13). Using the nuclear masses from different theoretical models, we can also calculate the preformation factors$ P^{ \rm{CFM}}_{\alpha} $ using Eq. (14) under the CFM. In Fig. 2, we show the Pearson coefficients among the preformation factors obtained using both the experimental extractions and the CFM calculations. The preformation factors within CFM in Fig. 2(a) are calculated using the Type I Eqs. (15)–(16) and those in Fig. 2(b) are calculated using the Type II Eqs. (18)–(19).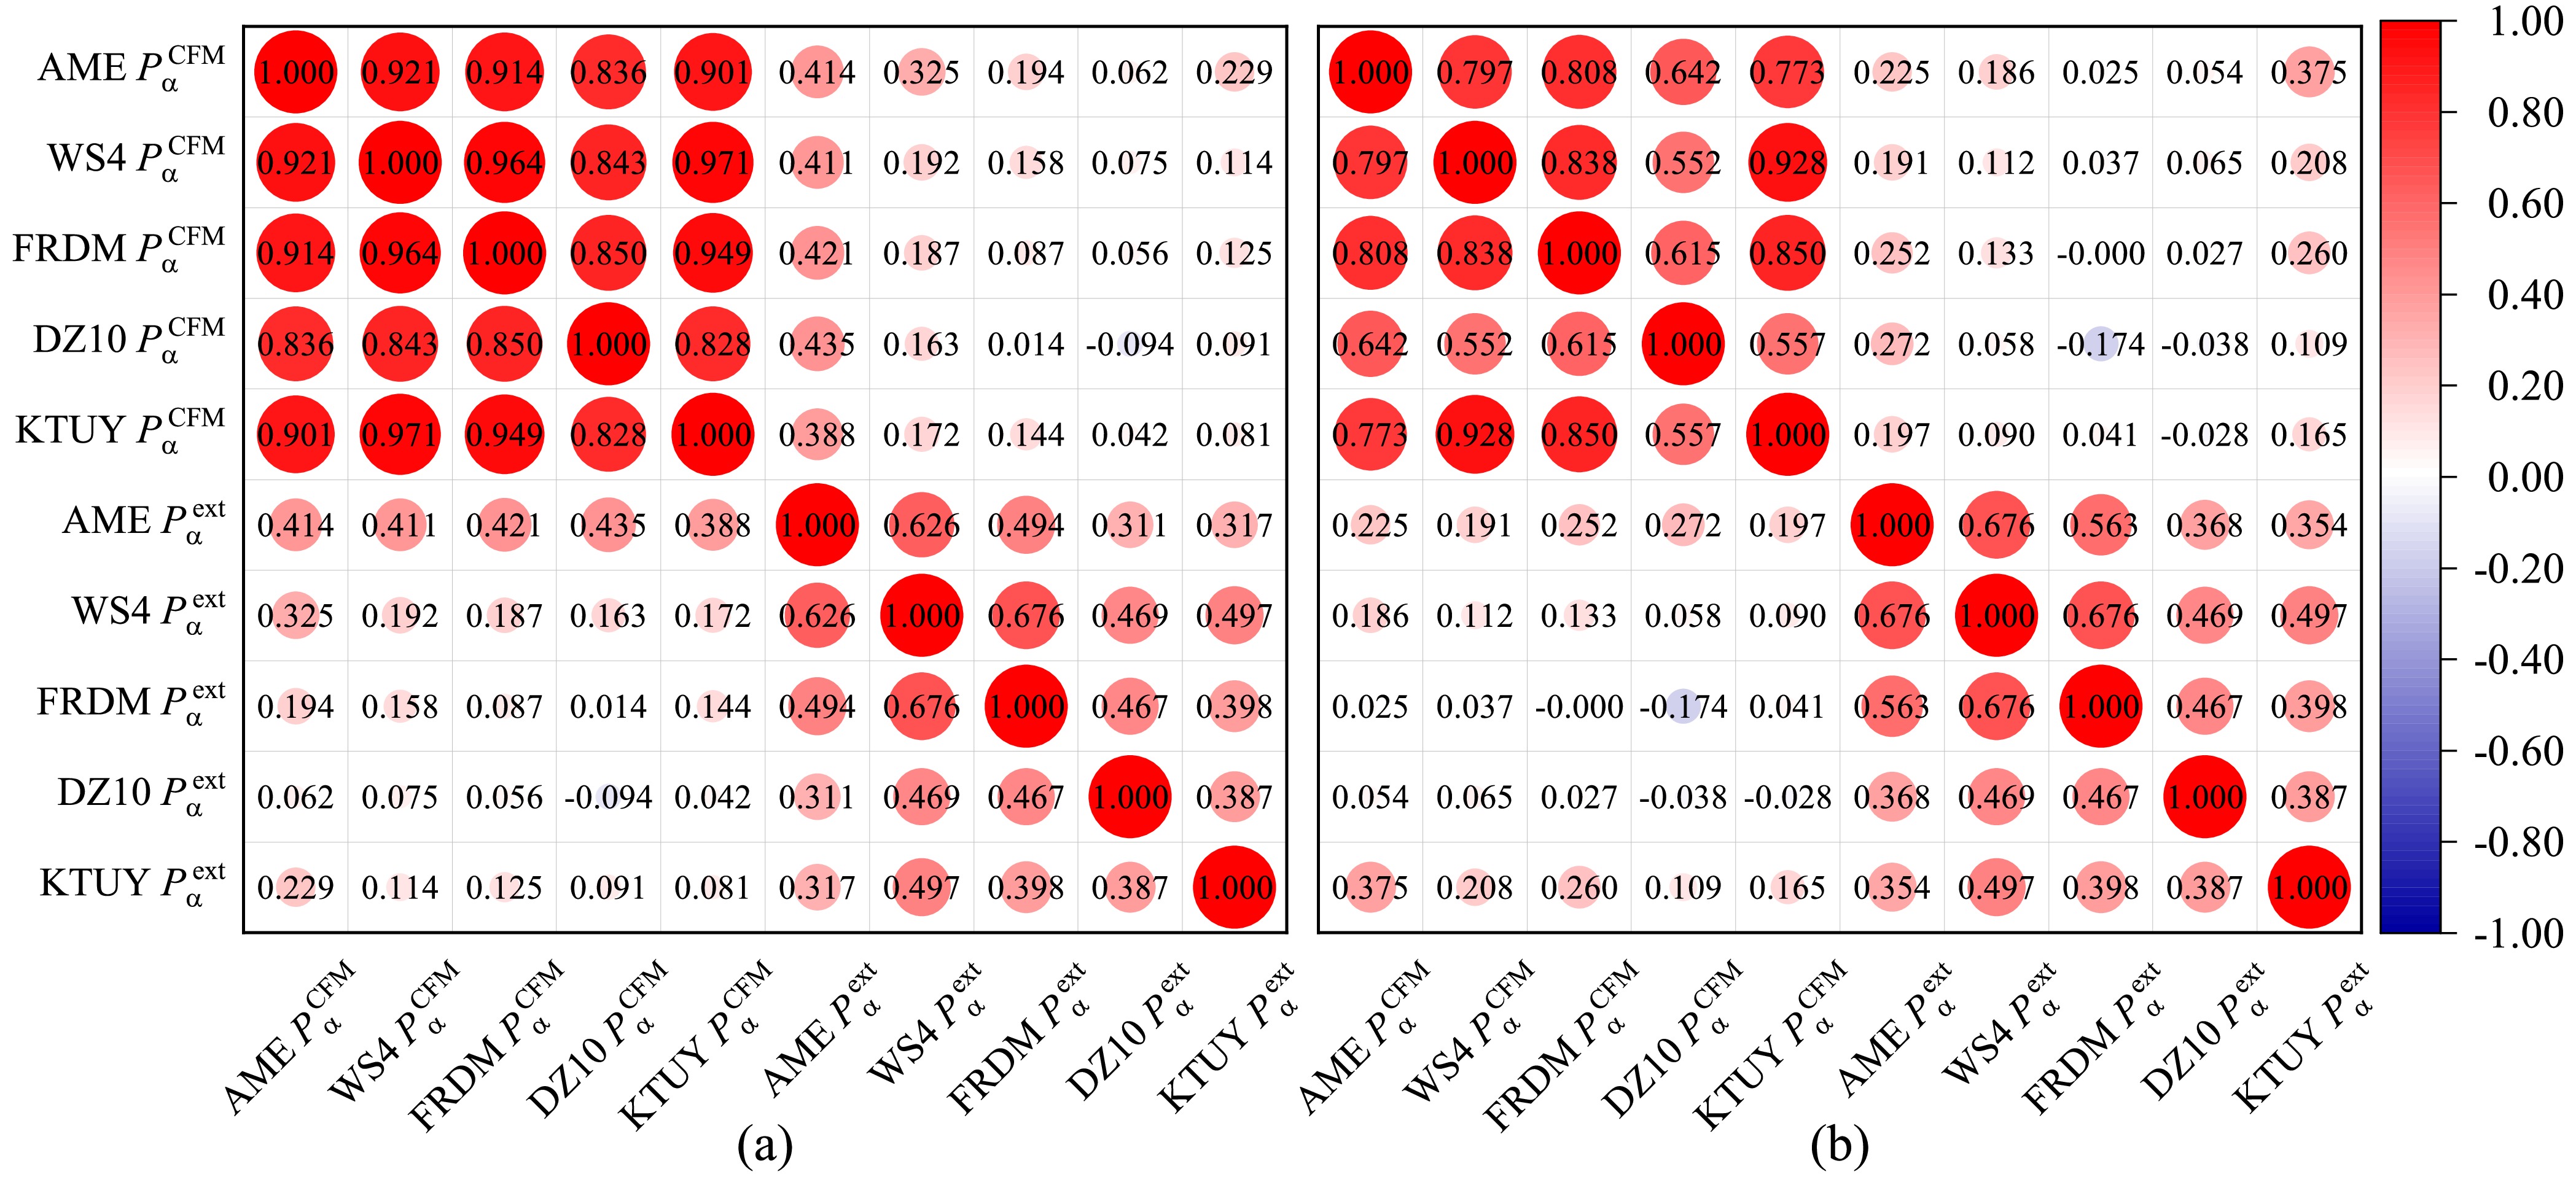
Figure 2. (color online) Pearson correlations among the preformation factors obtained using the extractions from experimental half-lives using Eq. (13) and by the CFM calculations using Eq. (14). The CFM results in panel (a) are calculated using Type I formulas with Eqs. (15)–(16) and those in panel (b) are calculated using Type II formulas with Eqs. (18)–(19).
The upper left block of Fig. 2(a) shows the Pearson coefficients among the CFM-calculated preformation factors with the experimental masses obtained using AME2020 (AME
$ P^{ \rm{CFM}}_{\alpha} $ ) and with the theoretical masses from corresponding models (model$ P^{ \rm{CFM}}_{\alpha} $ ). It can be seen that the Pearson coefficients are generally very close to unity. Specifically, the results obtained using the WS4, FRDM, and KTUY models have values above 0.9, while those of DZ10 are relatively small, which is consistent with the larger decay energy deviation from the experimental data. The lower right block of Fig. 2(a) shows the Pearson coefficients among the extracted preformation factors with the deduced experimental decay energies obtained using AME2020 (AME$ P^{ \rm{ext}}_{\alpha} $ ) and with the theoretical decay energies from corresponding mass models (model$ P^{ \rm{ext}}_{\alpha} $ ). It can be seen that these Pearson coefficients for the extracted preformation factors are generally smaller than those obtained using the CFM calculations with nuclear mass models. This trend can be mainly attributed to the exponential dependence of the decay half-life on the decay energy. Hence, the small difference in the nuclear mass and the decay energy can lead to a large discrepancy in the decay half-life, thus resulting in a large difference in the extracted preformation factors and small corresponding Pearson coefficients. However, the values of the Pearson coefficients are generally around 0.5, which indicates consistency among these extracted preformation factors.The results in the lower left block (conjugate in the upper right block) of Fig. 2(a) demonstrate the correlations among the preformation factors deduced from nuclear masses with CFM (
$ P^{ \rm{CFM}}_{\alpha} $ ) and those extracted with the experimental decay half-lives ($ P^{ \rm{ext}}_{\alpha} $ ). The values of the Pearson coefficients are generally small. These types of weak correlations cause not only the exponential dependence on the decay energy$ Q_{\alpha} $ but also the discrepancies from the theoretical nuclear masses. Considering the exponential sensitivity of the decay half-life$ T_{\rm cal} $ to the decay energy$ Q_{\alpha} $ , small discrepancies in$ Q_{\alpha} $ can lead to orders-of-magnitude changes in$ T_{\mathrm{cal}} $ . Hence, the correlation between$ P^{ \rm{ext}}_{\alpha} $ and$ P^{ \rm{CFM}}_{\alpha} $ will be significantly affected by the accuracy of the decay energy and the nuclear masses. Additionally, the differences of the theoretical nuclear masses contribute to these weak correlations among the mass models via the decay energy$ Q_{\alpha} $ and the CFM-calculated preformation factors. However, when both experimental masses and experimental decay half-lives are used, the extracted preformation factors (AME$ P^{ \rm{ext}}_{\alpha} $ ) show obvious correlations with those from nuclear masses under CFM (model$ P^{ \rm{CFM}}_{\alpha} $ ), as shown by the Pearson coefficients around 0.4 in the first line of this block. This is because the fact that the mass models can effectively reproduce the experimental masses as well as the deduced experimental decay energies. Hence, the correlations are enhanced by reducing the discrepancy from the decay energies. It is worth noting that the extracted WS4 preformation factors (WS4$ P^{ \rm{ext}}_{\alpha} $ ) have a relatively large Pearson coefficient of 0.325 with the factors AME$ P^{ \rm{CFM}}_{\alpha} $ , which indicates the ability of the WS4 mass model to accurately reproduce the experimental masses and decay energies.In Fig. 2(b), the Pearson coefficients for CFM calculations shown in the upper left block from the Type II formulas are generally a little smaller than those obtained using the Type I formulas, while the values for extractions in the lower right block from Type II are generally a little larger than those from Type I. This trend indicates that though the Type II treatment on the odd-nucleon effect weakens the correlations among the preformation factors within different mass models, it promotes the correlations from extractions within experimental decay half-lives. However, the overall correlations shown in Fig. 2(b) agree very well with those shown in Fig. 2(a), thus indicating the very consistent inclusion of the odd-nucleon effect on the preformation factors between these two types of CFM formulas. Hence, the type I CFM formulas are used to calculate the α-cluster preformation factors
$ P_{\alpha} $ throughout the following calculations.With the deduced preformation factors under the CFM and corresponding decay energies, we can further calculate the α-decay half-lives within the DDCM. In Figs. 3–6, we present the theoretical α-decay energies and calculated α-decay half-lives for different mass models as well as the available experimental data for possible α-decay chains with even-even, even-odd, odd-even, and odd-odd superheavy parent nuclei, respectively. The dotted lines denote the α-decay energies
$ Q_{\alpha} $ and the solid lines represent the corresponding decay half-lives$ T_{1/2} $ . The black lines represent the available experimental α-decay half-lives given in AME2020 with known α-decay branch ratios, while the colored lines correspond to the theoretical calculations where the decay energies and preformation factors are both deduced from the nuclear masses. All panels are plotted from large mass and proton numbers to small ones, which demonstrates the possible α-decay chains. Generally, the theoretical α-decay energies decrease with decreasing mass and proton numbers, while the trend for the theoretical decay half-lives is inverse. This trend is attributed to the fact that the larger decay energy enhance the probability of the α-cluster penetrating the potential barrier, which leads to a smaller decay half-life. Additionally, Figs. 3–6 show that among all models, the WS4 and FRDM masses provide the most consistent half-life predictions with the AME2020 data, while the DZ10 exhibits systematic fluctuations in the superheavy region. The higher accuracy of the former two mass models originates from their refined macroscopic–microscopic frameworks, which include updated shell and deformation corrections optimized for heavy nuclei. In contrast, while successful in medium-mass regions, the DZ10 model tends to estimate the nuclear masses in the superheavy domain with large uncertainty, which yields larger deviations in decay energies and half-life predictions. The detailed numerical values for the experimental α-decay half-lives and those calculated with the DDCM using AME2020, WS4, FRDM, DZ10, and KTUY nuclear masses are listed in Table 2 for the known nuclei shown in Figs. 3–6. Theoretical calculations generally agree with the experimental data, as is particularly apparent in the AME2020 results which have the smallest RMSE of 0.8. Besides, the results with WS4 masses are more consistent with the experimental data than those with FRDM, DZ10, and KTUY masses.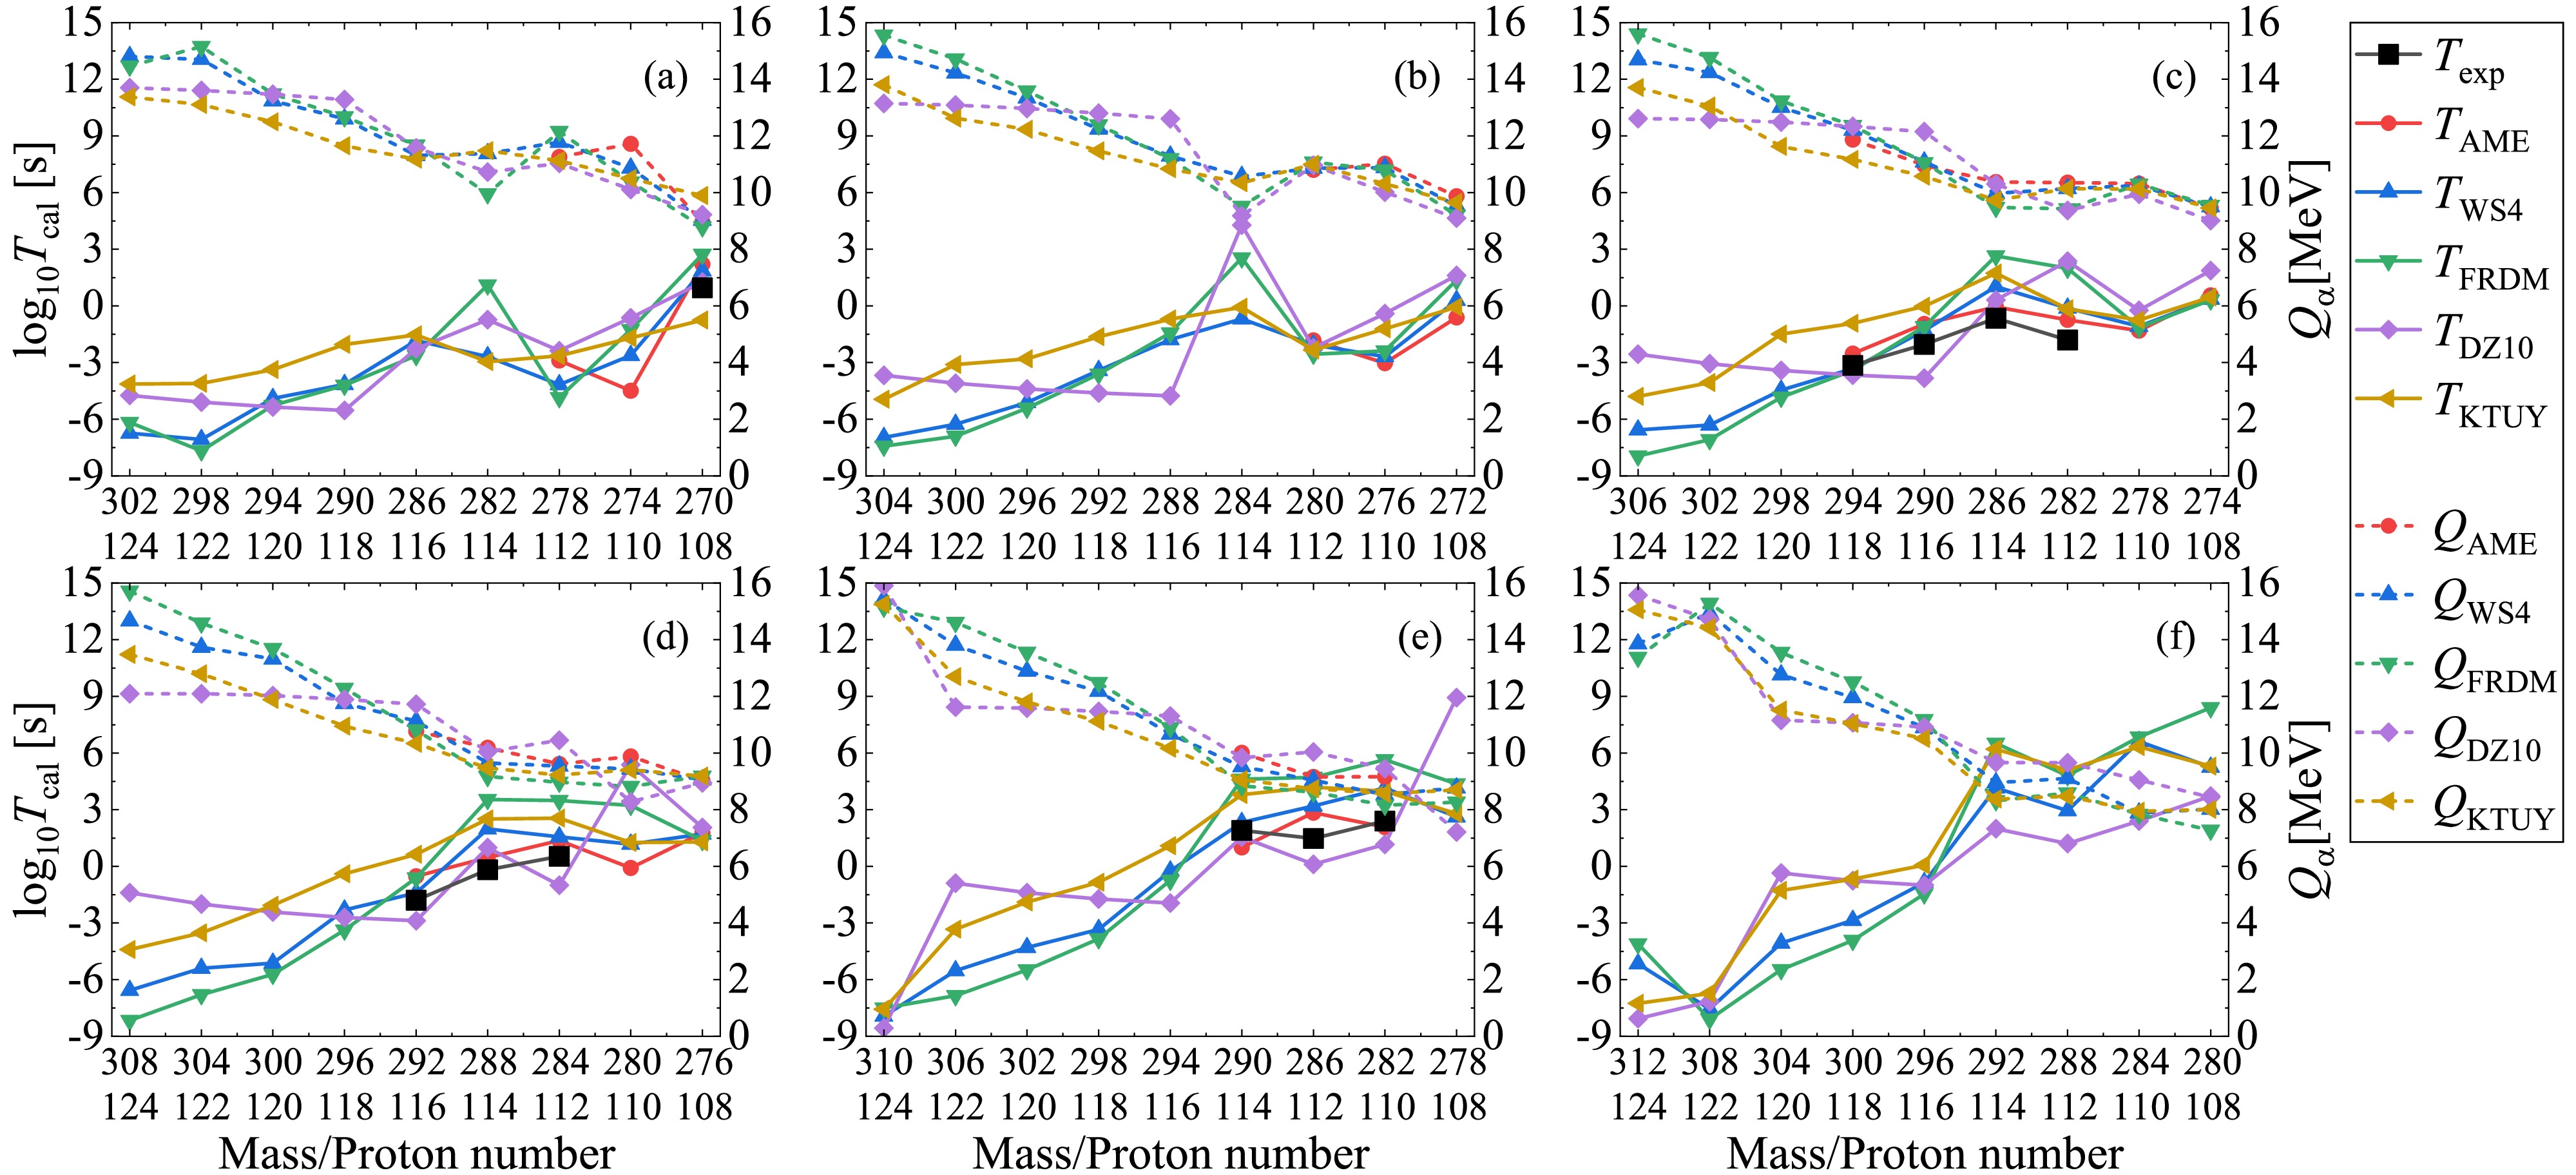
Figure 3. (color online) Theoretical α-decay energies and calculated α-decay half-lives using different mass models as well as the available experimental data given in AME2020 for possible α-decay chains with even-even superheavy parent nuclei.
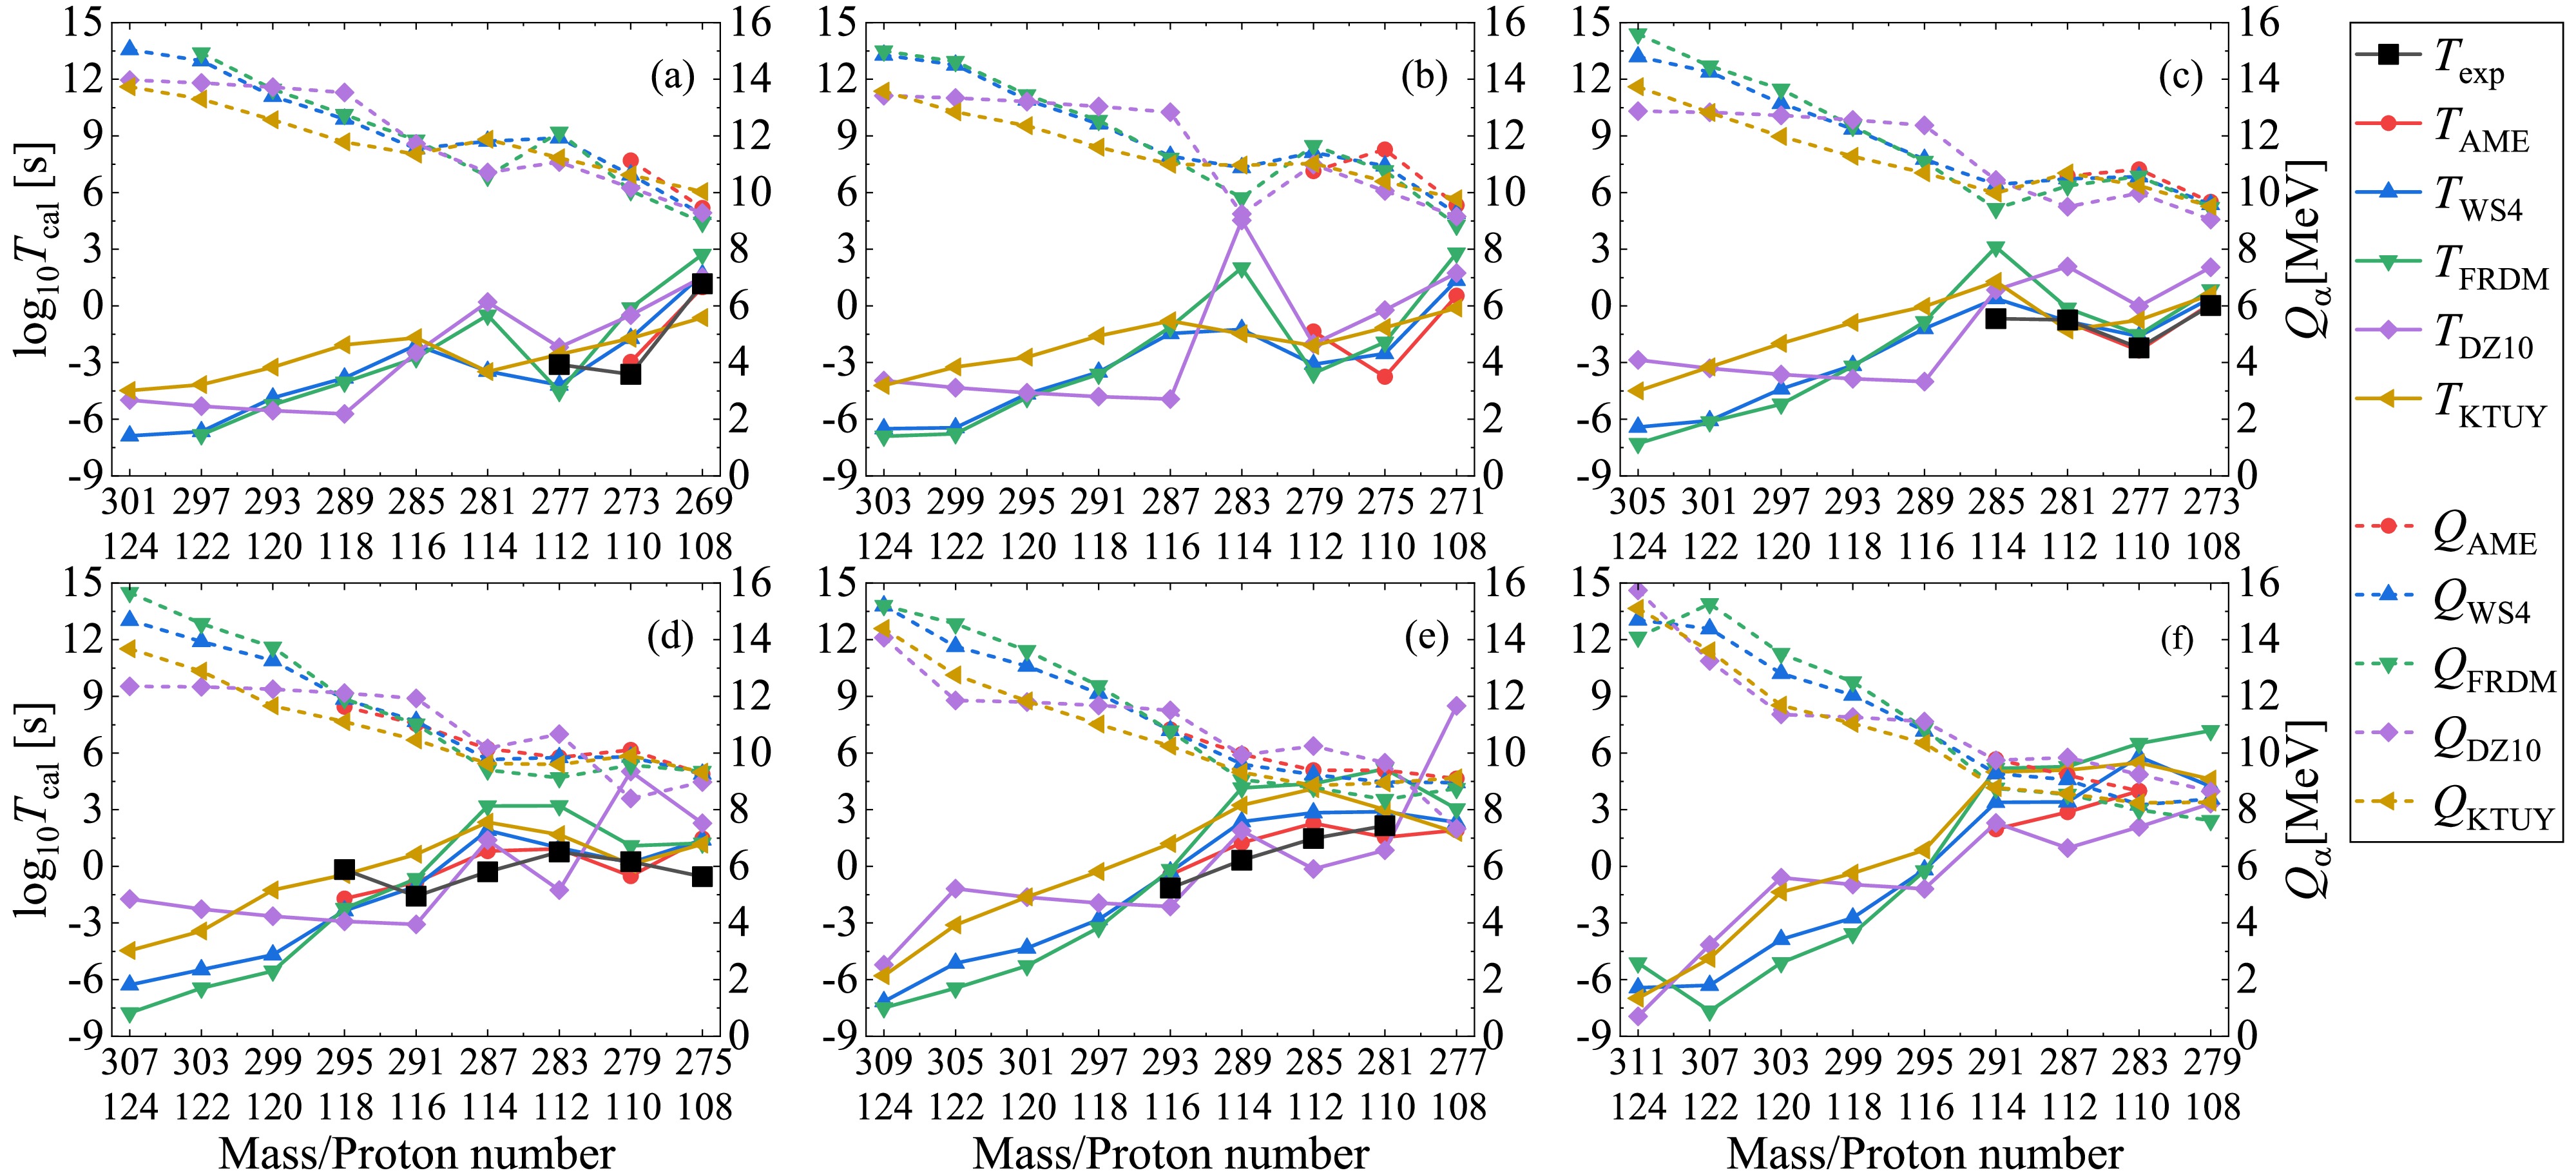
Figure 4. (color online) Same as Fig. 3 but for even-odd superheavy parent nuclei.
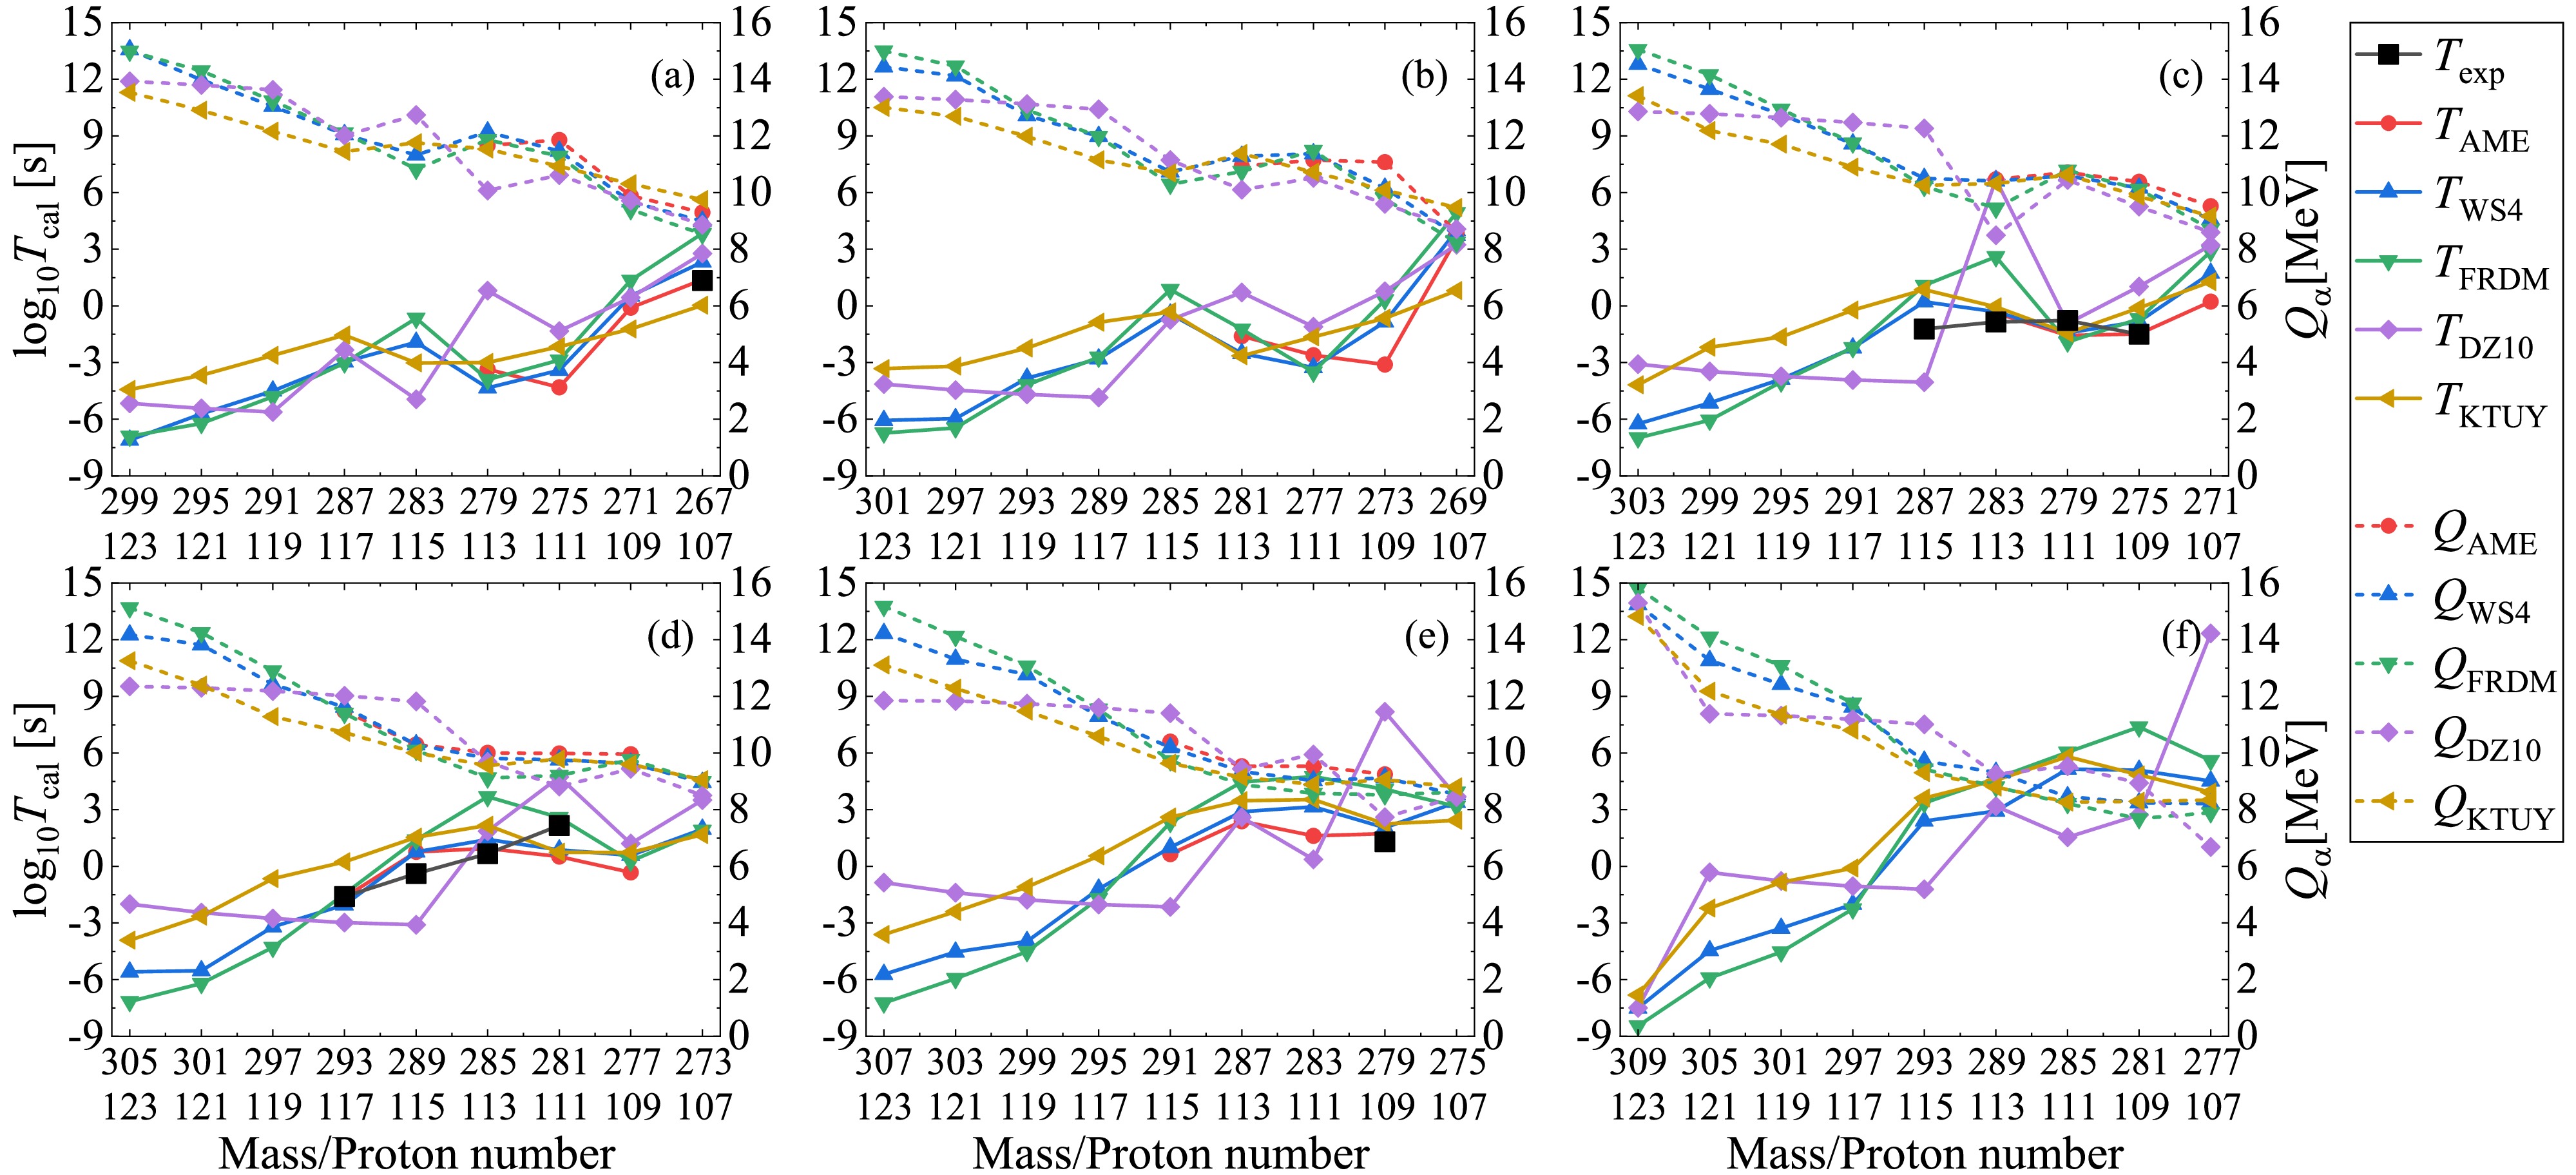
Figure 5. (color online) Same as Fig. 3 but for odd-even superheavy parent nuclei.
Next, let's concentrate on the results in Fig. 3. From each panel of Fig. 3 for even-even nuclei, it can be seen that for the superheavy parent nuclei with available deduced experimental decay energies
$ Q_{ \rm{AME}} $ (red dashed lines), the theoretical decay energies (colored dashed lines) from different mass models agree with each other very well. However, there are discrepancies among the theoretical predictions for the unknown superheavy parent nuclei, especially for those with large mass and proton numbers. For the α-decay half-lives, all the theoretical calculations (solid lines) can well reproduce the available experimental data (black lines), with the discrepancy generally in one order of magnitude. Especially, from the comparison between the solid red and black lines, we can find that within the decay energies and preformation factors both deduced from the experimental nuclear masses (AME2020), the calculated decay half-lives by the DDCM are in good agreement with the experimental data, indicating the good prediction accuracy of the DDCM. For the superheavy parent nuclei with smaller mass and proton numbers, due to the less uncertainty of the decay energies among different nuclear mass models, their predicted decay half-lives agree with each other very well. However, as shown from the starting points for the much heavier parent nuclei in each panel, the theoretical predicted decay energies are divergent from different mass models, resulting in large differences among these half-life predictions. Besides, for the isotopes from panel (a) to panel (f) in Fig. 3, such as those with the proton number$ Z=108 $ , we can see that the theoretical decay energies$ Q_{\alpha} $ will decrease if the superheavy parent nuclei have more neutrons. As a result, the corresponding predicted decay half-lives$ T_{1/2} $ are also increased for heavier isotopes. For example, the α-decay half-life of$ ^{270}_{108} \rm{Hs} $ is around the order of$ 10^2 $ s, while it is as large as$ 10^8 $ s for$ ^{280}_{108} \rm{Hs} $ . Although there are differences among the predicted decay half-lives, all the mass models demonstrate that the superheavy nuclei tend to become more stable with more neutrons compared with the present measured isotopes, which is consistent with the predicted “island of stability” near$ N\approx184 $ . These results provide quantitative support for ongoing experimental efforts to synthesize superheavy isotopes with more neutrons of elements with Z=119–120 using$ ^{50} $ Ti- or$ ^{54} $ Cr-induced reactions.The trends of the results shown in Figs. 4–6 for even-odd, odd-even, and odd-odd superheavy parent nuclei are very similar to those shown in Fig. 3 for the even-even nuclei. The theoretical calculations can accurately reproduce the experimental data for the superheavy nuclei with available decay energies. The predicted decay energies for the superheavy nuclei with small mass and proton numbers are consistent with each other among different mass models, while those with large mass and proton numbers have large discrepancies. As a result, the corresponding decay half-lives for the superheavy parent nuclei with available experimental data and with small mass and proton numbers are in good agreement with each other, generally within one order of magnitude discrepancy, while the differences among different mass models are large for the superheavy nuclei with large mass and proton numbers. Hence, the present theoretical mass models can predict relatively more consistent α-decay energies for unknown isotopes than for unknown superheavy elements. In the future, the α-decay properties of unknown isotopes can be employed to check the extrapolation reliability of different nuclear mass models as well as be used to further predict unknown superheavy elements.
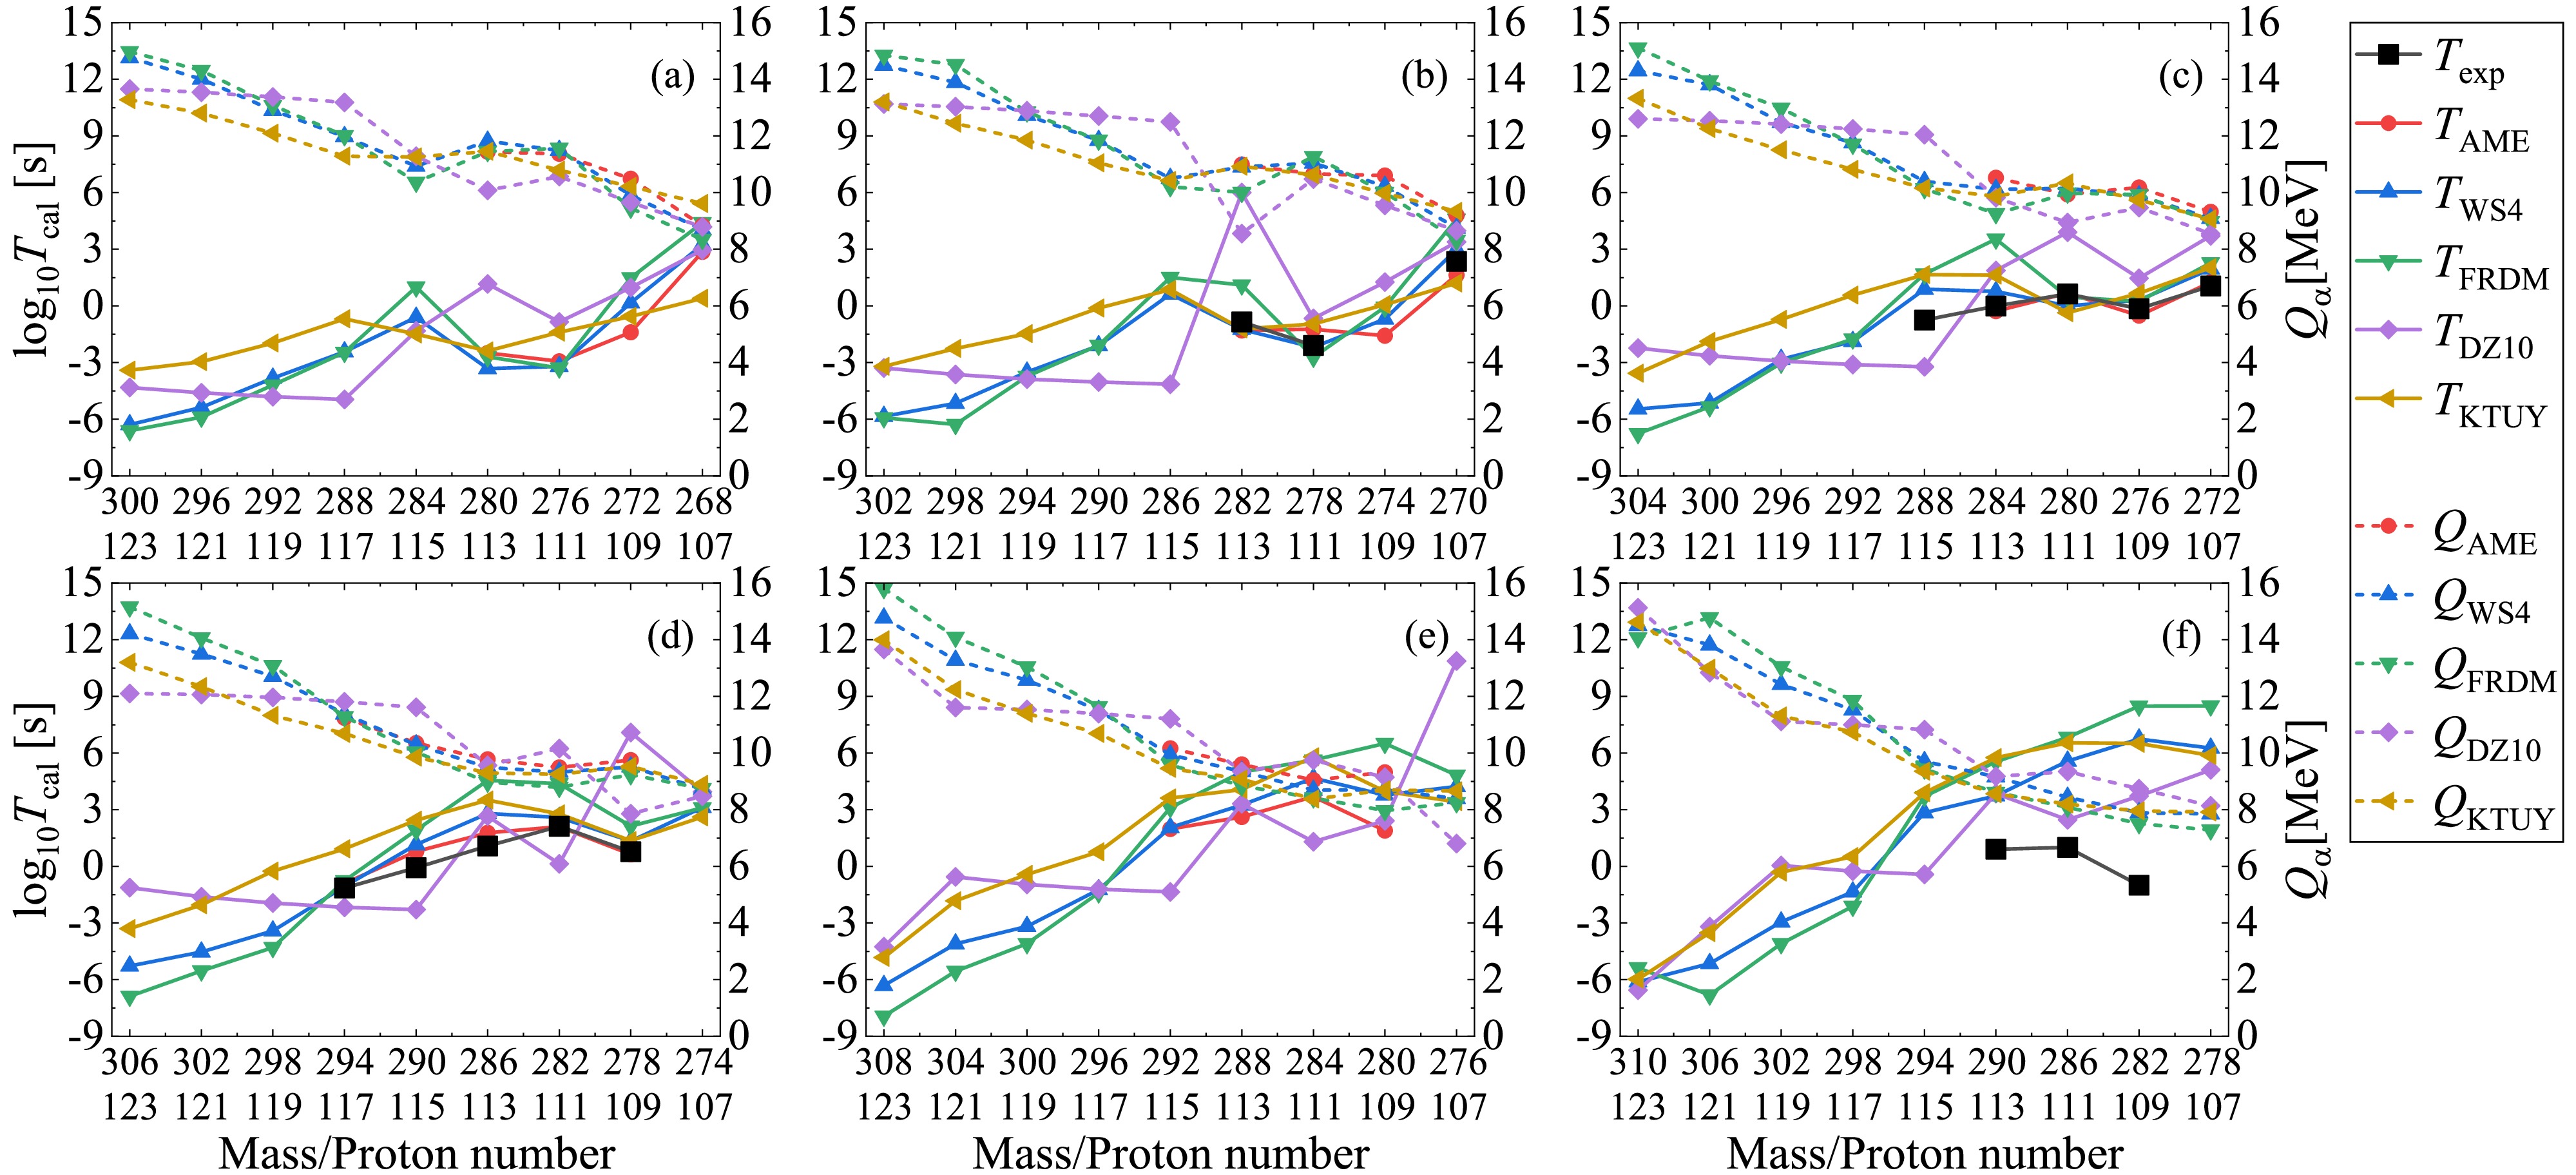
Figure 6. (color online) Same as Fig. 3 but for odd-odd superheavy parent nuclei.
A Z $ \log_{10}T_{\mathrm{exp}}/\mathrm{s} $ $ \log_{10}T_{\mathrm{AME}}/\mathrm{s} $ $ \log_{10}T_{\mathrm{WS4}}/\mathrm{s} $ $ \log_{10}T_{\mathrm{FRDM}}/\mathrm{s} $ $ \log_{10}T_{\mathrm{DZ10}}/\mathrm{s} $ $ \log_{10}T_{\mathrm{KTUY}}/\mathrm{s} $ 270 108 0.9542 2.2033 1.8534 2.7329 1.2590 −0.7488 272 108 −0.6159 0.2882 1.3680 1.6121 −0.0658 274 108 0.5625 0.3597 0.3084 1.8747 0.4616 276 108 1.7719 1.7098 1.3653 2.0505 1.2850 274 110 −4.4981 −2.6237 −1.2527 −0.6394 −1.7032 276 110 −3.0367 −2.6888 −2.3824 −0.4053 −1.2142 278 110 −1.3154 −1.0886 −1.1539 −0.2408 −0.7480 280 110 −0.0900 1.1702 3.2231 5.3795 1.2578 282 110 2.4014 2.0740 4.1514 5.6401 1.1600 3.9835 278 112 −2.8880 −4.1681 −4.8579 −2.3797 −2.6439 280 112 −1.8288 −2.0696 −2.5568 −2.2240 −2.3406 282 112 −1.8037 −0.7425 −0.1146 1.9899 2.3708 −0.1562 284 112 0.5315 1.3605 1.5598 3.4882 −1.0032 2.5436 286 112 1.4771 2.8427 3.1899 4.7132 0.1055 4.1916 286 114 −0.6569 −0.0587 1.0237 2.6452 0.3143 1.7322 288 114 −0.1851 0.4647 1.9768 3.5379 0.9875 2.5002 290 114 1.9031 1.0021 2.3257 4.6088 1.5506 3.7946 290 116 −2.0458 −0.9539 −1.3042 −1.0991 −3.8273 −0.0216 292 116 −1.7959 −0.5264 −1.4071 −0.6114 −2.8858 0.6309 294 118 −3.1549 −2.5281 −3.3218 −3.4187 −3.6680 −0.9201 269 108 1.1761 0.9896 1.6533 2.7232 1.5322 −0.6284 271 108 0.5424 1.3585 2.7936 1.7417 −0.1211 273 108 0.0253 0.1192 0.4103 0.8539 2.0474 0.5906 275 108 −0.5528 1.4691 1.4030 1.2235 2.2748 1.1768 277 108 1.9092 2.3288 3.0438 8.4894 1.7878 273 110 −3.6198 −2.9717 −1.7228 −0.1080 −0.4918 −1.7254 275 110 −3.7542 −2.5221 −1.9273 −0.2207 −1.1495 277 110 −2.2218 −2.3708 −1.6182 −1.5318 −0.0254 −0.7579 279 110 0.2430 −0.5155 0.1897 1.0890 5.0247 0.0969 281 110 2.1461 1.5324 2.8942 5.1638 0.8471 2.9974 283 110 3.9934 5.8096 6.5100 2.0892 5.4835 277 112 −3.1024 −4.1969 −4.5360 −2.1951 −2.5659 279 112 −1.3501 −3.0915 −3.5669 −2.0067 −2.1088 281 112 −0.7447 −0.8491 −0.8134 −0.1266 2.0843 −1.2802 283 112 0.7636 0.9265 0.9830 3.2037 −1.2542 1.6729 285 112 1.4771 2.2832 2.8369 4.3812 −0.1431 4.1085 287 112 2.8689 3.4086 5.2776 0.9645 5.0929 285 114 −0.6778 0.3818 3.1222 0.8405 1.2954 287 114 −0.2924 0.8063 1.9083 3.1927 1.3894 2.3371 289 114 0.3222 1.2447 2.3606 4.1463 1.8832 3.2366 291 114 1.9705 3.3823 5.1876 2.2958 4.9979 291 116 −1.5850 −0.8377 −1.0636 −0.6566 −3.0753 0.6363 293 116 −1.1549 −0.4481 −0.2928 −0.1759 −2.1325 1.2085 295 118 −0.1675 −1.7111 −2.3503 −2.2362 −2.9102 −0.4436 267 107 1.3424 1.3920 2.3185 3.8407 2.7752 0.0335 269 107 3.5596 3.9890 4.9322 3.2414 0.8114 271 107 0.2222 1.7274 2.8833 3.2121 1.2822 271 109 −0.0946 0.5230 1.3595 0.4446 −1.2262 273 109 −3.1088 −0.8499 0.3244 0.7714 −0.6580 275 109 −1.5086 −1.4891 −0.8299 −0.6856 1.0251 −0.1097 277 109 −0.3207 0.5852 0.2643 1.2018 0.7281 279 111 −0.7696 −1.5661 −1.4275 −1.9151 −0.9333 −1.4368 281 111 2.1648 0.5127 0.8683 2.5834 4.7339 0.7403 283 111 1.6086 3.1470 4.7474 0.3682 3.5424 279 113 −3.3594 −4.3395 −3.8980 0.8057 −2.9949 281 113 −1.5979 −2.5209 −1.2381 0.7137 −2.6460 283 113 −0.8539 −0.3812 −0.3147 2.5972 6.6919 −0.0498 285 113 0.6628 0.9413 1.4239 3.6872 1.8626 2.1744 287 113 2.3858 2.8949 4.4630 2.5884 3.4723 287 115 −1.2218 0.2158 1.0875 −4.0421 0.8652 289 115 −0.3872 0.7644 0.7669 1.4003 −3.0994 1.5415 291 115 0.6461 0.9994 2.3222 −2.1555 2.6052 293 117 −1.6021 −1.6441 −2.0396 −1.4658 −2.9758 0.2322 268 107 2.8578 3.2398 4.4050 2.9598 0.3997 270 107 2.3579 1.6387 2.9934 4.5878 3.3850 1.2087 272 107 1.0531 1.2425 1.9570 2.2745 3.7146 2.0226 272 109 −1.3962 0.1623 1.4835 0.9691 −0.5563 274 109 −1.5835 −0.6992 −0.0690 1.2581 0.0651 276 109 −0.1549 −0.5155 0.3046 0.2320 1.4631 0.6707 278 109 0.7782 0.6384 1.3282 2.1319 7.0820 1.3559 280 109 1.8950 3.7765 6.5020 2.4097 3.9677 282 109 −1.0000 6.7376 8.4851 3.7226 6.5040 276 111 −2.9333 −3.2062 −3.2868 −0.8513 −1.3953 278 111 −2.0969 −1.2334 −2.1979 −2.7220 −0.6644 −0.9623 280 111 0.6335 0.6725 −0.0036 0.4767 3.9036 −0.3641 282 111 2.1139 2.0946 2.5922 4.3775 0.1325 2.7752 284 111 3.6910 4.6629 5.6215 1.3015 5.7912 286 111 1.0000 5.5703 6.8245 2.4572 6.5413 280 113 −2.4996 −3.3176 −2.6973 1.1593 −2.3916 282 113 −0.8539 −1.2978 −1.2468 1.1099 6.0008 −1.2248 284 113 −0.0132 −0.2838 0.7654 3.5324 1.8742 1.6284 286 113 1.0792 1.7789 2.7992 4.5533 2.6541 3.5013 288 113 2.6155 3.2479 4.9915 3.3144 4.0637 290 113 0.9031 3.7270 5.5409 3.8462 5.7562 288 115 −0.7520 0.8855 1.6860 −3.2236 1.6512 290 115 −0.0757 0.7825 1.1555 1.9115 −2.2890 2.4377 292 115 1.9733 2.0576 3.1115 −1.3562 3.6144 294 117 −1.1549 −0.8999 −1.0697 −0.7599 −2.1668 0.9242 Table 2. Comparison between the experimental α-decay half-lives and the calculated values under the DDCM using AME2020, WS4, FRDM, DZ10, and KTUY nuclear masses.
-
Within the DDCM and CFM framework, systematic evaluations of α-decay properties can be achieved across known and extrapolated superheavy nuclei by combining nuclear mass models. Using theoretical nuclear masses from WS4, FRDM, DZ10, and KTUY, we computed α-decay energies
$ Q_{\alpha} $ , α-cluster preformation factors$ P_{\alpha} $ , and α-decay half-lives$ T_{1/2} $ . The decay energies deduced from the experimental nuclear masses given in AME2020 are employed as benchmark calculation.Since the decay energy is crucial for α decays, we first check the consistency between the theoretical decay energies and the experimental data deduced from AME2020 for all the known α-decay superheavy parent nuclei from
$ ^{228}{ \rm{Th}} $ to$ ^{295}{ \rm{Og}} $ . In Table I, we show the corresponding root-mean-square error (RMSE) for the α-decay energies, which is calculated byWS4 FRDM DZ10 KTUY RMSE 0.2455 0.3679 0.5319 0.4371 Table 1. Root Mean Square Errors (RMSEs) of the decay energy
$ Q_{\alpha} $ deduced by different mass models compared with those from the experimental masses given in AME2020 for all the known α-decay superheavy parent nuclei from$ ^{228}{ \rm{Th}} $ to$ ^{295}{ \rm{Og}} $ .$ \rm{RMSE}=\sqrt{\dfrac{1}{N}\sum\limits^N_{i=1}(Q^{ \rm{theo}}_{\alpha,i}-Q^{ \rm{expt}}_{\alpha,i})^2}, $
(20) where N denotes the number of the involved experimental α-decay energies. From Table 1 we can see that in general, all the nuclear mass models can well reproduce the deduced experimental decay energies with very small RMSEs. In detail, the WS4 and FRDM results achieve the smallest errors, typically below 0.4 MeV, whereas the DZ10 model displays the largest error and the KTUY model lies between them. The large differences for the α-decay energies from the DZ10 model could result in relatively large discrepancies for the corresponding theoretical α-decay half-lives.
To study the correlations for the α-decay energies among different nuclear masses, the corresponding Pearson correlation coefficient P is calculated, which is defined as
$ \begin{array}{l} P=\dfrac{ \displaystyle\sum(x_i-\overline{x})(y_i-\overline{y})}{\sqrt{ \displaystyle\sum(x_i-\overline{x})^2}\sqrt{ \displaystyle\sum(y_i-\overline{y})^2}}. \end{array} $
(21) The Pearson coefficient P is widely used in statistics to measure the degree of linear dependence between two sets of variables
$\{ x_i \}$ and$\{ y_i \}$ , where$ \overline{x} $ and$ \overline{y} $ are their averaged values, respectively. The absolute value of the Pearson coefficient P is in the range of$ 0-1 $ , where$ |P|\sim1.0 $ indicates a very strong correlation and$ |P|\sim0.0 $ demonstrates a very weak correlation between$\{ x_i \}$ and$\{ y_i \}$ . In Fig. 1, we give the results of the Pearson coefficients for the decay energies among different nuclear masses. It is obvious that all the values of the Pearson coefficient between the theoretical mass models and the AME2020 data are very close to unity, indicating very good consistency for reproducing the experimental data by all the nuclear mass models. In addition, the very large Pearson coefficients among the different mass models also demonstrate the consistency to reproduce the available data. Relatively, the DZ10 model corresponds to the smallest Pearson coefficients, which is accordant with the largest RMSE shown in Table 1.
Figure 1. (color online) Pearson correlations among different decay energies
$ Q_{\alpha} $ deduced from WS4, FRDM, DZ10, and KTUY mass models and the experimental masses given in AME2020.With these obtained α-decay energies, we can further extract the α-cluster preformation factors
$ P^{ \rm{ext}}_{\alpha} $ from the experimental decay half-lives with Eq. (13). Using the nuclear masses from different theoretical models, we can also calculate the preformation factors$ P^{ \rm{CFM}}_{\alpha} $ with Eq. (14) under the CFM. In Fig. 2, we show the Pearson coefficients among the preformation factors from both the experimental extractions and the CFM calculations. The preformation factors within CFM in Fig. 2(a) are calculated by the Type I Eqs. (15)-(16) and those in Fig. 2(b) are calculated by the Type II Eqs. (18)-(19).
Figure 2. (color online) Pearson correlations among the preformation factors obtained by the extractions from experimental half-lives with Eq. (13) and by the CFM calculations with Eq. (14). The CFM results in panel (a) are calculated by Type I formulas with Eqs. (15)-(16) and those in panel (b) are calculated by Type II formulas with Eqs. (18)-(19).
In the upper left block of Fig. 2(a) are the Pearson coefficients among the CFM-calculated preformation factors with the experimental masses from AME2020 (AME
$ P^{ \rm{CFM}}_{\alpha} $ ) and with the theoretical masses from corresponding models (model$ P^{ \rm{CFM}}_{\alpha} $ ). It can be seen that the Pearson coefficients are generally very close to unity. In detail, the results with WS4, FRDM, and KTUY are all larger than 0.9, while those with DZ10 are relatively small, which is consistent with the larger decay energy deviation from the experimental data. In the lower right block of Fig. 2(a) are the Pearson coefficients among the extracted preformation factors with the deduced experimental decay energies from AME2020 (AME$ P^{ \rm{ext}}_{\alpha} $ ) and with the theoretical decay energies from corresponding mass models (model$ P^{ \rm{ext}}_{\alpha} $ ). It can be seen that these Pearson coefficients for the extracted preformation factors are generally smaller than those from the CFM calculations with nuclear mass models. This is mainly because of the exponential dependence of the decay half-life on the decay energy. Hence, the small difference in the nuclear mass and the decay energy can lead to large discrepancy in the decay half-life, resulting in large difference in the extracted preformation factors and small corresponding Pearson coefficients. However, the values of the Pearson coefficients are generally around 0.5, indicating consistency among these extracted preformation factors.The results in the lower left block (conjugate in the upper right block) of Fig. 2(a) demonstrate the correlations among the preformation factors deduced from nuclear masses with CFM (
$ P^{ \rm{CFM}}_{\alpha} $ ) and those extracted with the experimental decay half-lives ($ P^{ \rm{ext}}_{\alpha} $ ). The values of the Pearson coefficients are generally small. Such kind of weak correlations among them originates not only the exponential dependence on the decay energy$ Q_{\alpha} $ but also the discrepancies from the theoretical nuclear masses. Considering the exponential sensitivity of the decay half-life$ T_{cal} $ to the decay energy$ Q_{\alpha} $ , small discrepancies in$ Q_{\alpha} $ can lead to orders-of-magnitude changes in$ T_{cal} $ . Hence, the correlation between$ P^{ \rm{ext}}_{\alpha} $ and$ P^{ \rm{CFM}}_{\alpha} $ will be significantly affected by the accuracy of the decay energy and the nuclear masses. Besides, the differences of the theoretical nuclear masses will also contribute to these weak correlations among the mass models via the decay energy$ Q_{\alpha} $ and the CFM-calculated preformation factors. However, when both experimental masses and experimental decay half-lives are used, the extracted preformation factors (AME$ P^{ \rm{ext}}_{\alpha} $ ) show obvious correlations with those from nuclear masses under CFM (model$ P^{ \rm{CFM}}_{\alpha} $ ), as shown by the Pearson coefficients around 0.4 in the first line of this block. This is because the mass models can reproduce well the experimental masses as well as the deduced experimental decay energies. Hence, the correlations are enhanced by reducing the discrepancy from the decay energies. It is worth noting that the extracted WS4 preformation factors (WS4$ P^{ \rm{ext}}_{\alpha} $ ) have a relatively large Pearson coefficient 0.325 with the factors AME$ P^{ \rm{CFM}}_{\alpha} $ , which indicates the very good accuracy of the WS4 mass model to reproduce the experimental masses and decay energies.In Fig. 2(b), the Pearson coefficients for CFM calculations in the upper left block from the Type II formulas are generally a little smaller than those from the Type I formulas, while the values for extractions in the lower right block from the Type II are generally a little larger than those from the Type I. That is to say, though the Type II treatment on the odd-nucleon effect weakens the correlations among the preformation factors within different mass models, it promotes the correlations from extractions within experimental decay half-lives. However, the overall correlations shown in Fig. 2(b) agree very well with those in Fig. 2(a), indicating the very consistent inclusion of the odd-nucleon effect on the preformation factors between these two types of CFM formulas. Hence, we take the type I CFM formulas as an example to calculate the α-cluster preformation factors
$ P_{\alpha} $ throughout the following calculations.With the deduced preformation factors under the CFM and corresponding decay energies, we can further calculate the α-decay half-lives within the DDCM. In Figs. 3-6, we present the theoretical α-decay energies and calculated α-decay half-lives for different mass models as well as the available experimental data for possible α-decay chains with even-even, even-odd, odd-even, and odd-odd superheavy parent nuclei, respectively. The dotted lines denote the α-decay energies
$ Q_{\alpha} $ and the solid lines represent the corresponding decay half-lives$ T_{1/2} $ . The black lines represent the available experimental α-decay half-lives given in AME2020 with known α-decay branch ratios, while the colored lines correspond to the theoretical calculations where the decay energies and preformation factors are both deduced from the nuclear masses. Besides, all panels are plotted from large mass and proton numbers to small ones, demonstrating the possible α-decay chains. Generally, the theoretical α-decay energies in all figures decrease with the decreasing mass and proton numbers, while the tendency for the theoretical decay half-lives is inverse. This is because the larger decay energy will enhance the probability of α-cluster penetrating the potential barrier, leading to smaller decay half-life. Besides, from Figs. 3-6 we can also see that among all models, the WS4 and FRDM masses provide the most consistent half-life predictions with the AME2020 data, while the DZ10 exhibits systematic fluctuations in the superheavy region. The higher accuracy of the former two mass models originates from their refined macroscopic–microscopic frameworks, which include updated shell and deformation corrections optimized for heavy nuclei. In contrast, while successful in medium-mass regions, the DZ10 model tends to estimate the nuclear masses in the superheavy domain with large uncertainty, resulting in larger deviations in decay energies and half-life predictions. The detailed numerical values for the experimental α-decay half-lives and those calculated with the DDCM using AME2020, WS4, FRDM, DZ10, and KTUY nuclear masses are listed in Table 2 for the known nuclei in Figs. 3-6. It is shown that the theoretical calculations generally agree with the experimental data, especially the AME2020 results with a smallest RMSE of 0.8. Besides, the results with WS4 masses are more consistent with the experimental data than those with FRDM, DZ10 and KTUY masses.
Figure 3. (color online) Theoretical α-decay energies and calculated α-decay half-lives from different mass models as well as the available experimental data given in AME2020 for possible α-decay chains with even-even superheavy parent nuclei.
Figure 4. (color online) Same as Fig. 3 but for even-odd superheavy parent nuclei.
Figure 5. (color online) Same as Fig. 3 but for odd-even superheavy parent nuclei.
Next let's concentrate on the results in Fig. 3. From each panel of Fig. 3 for even-even nuclei, it can be seen that for the superheavy parent nuclei with available deduced experimental decay energies
$ Q_{ \rm{AME}} $ (red dashed lines), the theoretical decay energies (colored dashed lines) from different mass models agree with each other very well. However, there are discrepancies among the theoretical predictions for the unknown superheavy parent nuclei, especially for those with large mass and proton numbers. For the α-decay half-lives, all the theoretical calculations (solid lines) can well reproduce the available experimental data (black lines), with the discrepancy generally in one order of magnitude. Especially, from the comparison between the solid red and black lines, we can find that within the decay energies and preformation factors both deduced from the experimental nuclear masses (AME2020), the calculated decay half-lives by the DDCM are in good agreement with the experimental data, indicating the good prediction accuracy of the DDCM. For the superheavy parent nuclei with smaller mass and proton numbers, due to the less uncertainty of the decay energies among different nuclear mass models, their predicted decay half-lives agree with each other very well. However, as shown from the starting points for the much heavier parent nuclei in each panel, the theoretical predicted decay energies are divergent from different mass models, resulting in large differences among these half-life predictions. Besides, for the isotopes from panel (a) to panel (f) in Fig. 3, such as those with the proton number$ Z=108 $ , we can see that the theoretical decay energies$ Q_{\alpha} $ will decrease if the superheavy parent nuclei have more neutrons. As a result, the corresponding predicted decay half-lives$ T_{1/2} $ are also increased for heavier isotopes. For example, the α-decay half-life of$ ^{270}_{108} \rm{Hs} $ is around the order of$ 10^2 $ s, while it is as large as$ 10^8 $ s for$ ^{280}_{108} \rm{Hs} $ . Though there are differences among the predicted decay half-lives, however, all the mass models demonstrate that the superheavy nuclei tend to become more stable with more neutrons compared with the present measured isotopes, which is consistent with the predicted “island of stability” near$ N\approx184 $ . These results provide quantitative support for ongoing experimental efforts to synthesize superheavy isotopes with more neutrons of elements with Z=119–120 using$ ^{50} $ Ti- or$ ^{54} $ Cr-induced reactions.The tendency of the results in Figs. 4-6 for even-odd, odd-even, and odd-odd superheavy parent nuclei are very similar to those in Fig. 3 for the even-even nuclei. For the superheavy nuclei with decay energies available, all the theoretical calculations can reproduce the experimental data very well. The predicted decay energies for the superheavy nuclei with small mass and proton numbers are consistent with each other among different mass models, while there are large discrepancies for those with large mass and proton numbers. As a result, the corresponding decay half-lives for the superheavy parent nuclei with available experimental data and with small mass and proton numbers agree with each other well, generally within one order of magnitude discrepancy, while the differences among different mass models are large for the superheavy nuclei with large mass and proton numbers. Hence, the present theoretical mass models can predict relatively more consistent α-decay energies for unknown isotopes than for unknown superheavy elements. In the future, the α-decay properties of unknown isotopes can be employed to check the extrapolation reliability of different nuclear mass models as well as for further predictions of unknown superheavy elements.
Figure 6. (color online) Same as Fig. 3 but for odd-odd superheavy parent nuclei.
A Z $ \log_{10}T_{\mathrm{exp}} [\mathrm{s}] $ $ \log_{10}T_{\mathrm{AME}} [\mathrm{s}] $ $ \log_{10}T_{\mathrm{WS4}} [\mathrm{s}] $ $ \log_{10}T_{\mathrm{FRDM}} [\mathrm{s}] $ $ \log_{10}T_{\mathrm{DZ10}} [\mathrm{s}] $ $ \log_{10}T_{\mathrm{KTUY}} [\mathrm{s}] $ 270 108 0.9542 2.2033 1.8534 2.7329 1.2590 −0.7488 272 108 −0.6159 0.2882 1.3680 1.6121 −0.0658 274 108 0.5625 0.3597 0.3084 1.8747 0.4616 276 108 1.7719 1.7098 1.3653 2.0505 1.2850 274 110 −4.4981 −2.6237 −1.2527 −0.6394 −1.7032 276 110 −3.0367 −2.6888 −2.3824 −0.4053 −1.2142 278 110 −1.3154 −1.0886 −1.1539 −0.2408 −0.7480 280 110 −0.0900 1.1702 3.2231 5.3795 1.2578 282 110 2.4014 2.0740 4.1514 5.6401 1.1600 3.9835 278 112 −2.8880 −4.1681 −4.8579 −2.3797 −2.6439 280 112 −1.8288 −2.0696 −2.5568 −2.2240 −2.3406 282 112 −1.8037 −0.7425 −0.1146 1.9899 2.3708 −0.1562 284 112 0.5315 1.3605 1.5598 3.4882 −1.0032 2.5436 286 112 1.4771 2.8427 3.1899 4.7132 0.1055 4.1916 286 114 −0.6569 −0.0587 1.0237 2.6452 0.3143 1.7322 288 114 −0.1851 0.4647 1.9768 3.5379 0.9875 2.5002 290 114 1.9031 1.0021 2.3257 4.6088 1.5506 3.7946 290 116 −2.0458 −0.9539 −1.3042 −1.0991 −3.8273 −0.0216 292 116 −1.7959 −0.5264 −1.4071 −0.6114 −2.8858 0.6309 294 118 −3.1549 −2.5281 −3.3218 −3.4187 −3.6680 −0.9201 269 108 1.1761 0.9896 1.6533 2.7232 1.5322 −0.6284 271 108 0.5424 1.3585 2.7936 1.7417 −0.1211 273 108 0.0253 0.1192 0.4103 0.8539 2.0474 0.5906 275 108 −0.5528 1.4691 1.4030 1.2235 2.2748 1.1768 277 108 1.9092 2.3288 3.0438 8.4894 1.7878 273 110 −3.6198 −2.9717 −1.7228 −0.1080 −0.4918 −1.7254 275 110 −3.7542 −2.5221 −1.9273 −0.2207 −1.1495 277 110 −2.2218 −2.3708 −1.6182 −1.5318 −0.0254 −0.7579 279 110 0.2430 −0.5155 0.1897 1.0890 5.0247 0.0969 281 110 2.1461 1.5324 2.8942 5.1638 0.8471 2.9974 283 110 3.9934 5.8096 6.5100 2.0892 5.4835 277 112 −3.1024 −4.1969 −4.5360 −2.1951 −2.5659 279 112 −1.3501 −3.0915 −3.5669 −2.0067 −2.1088 281 112 −0.7447 −0.8491 −0.8134 −0.1266 2.0843 −1.2802 283 112 0.7636 0.9265 0.9830 3.2037 −1.2542 1.6729 285 112 1.4771 2.2832 2.8369 4.3812 −0.1431 4.1085 287 112 2.8689 3.4086 5.2776 0.9645 5.0929 285 114 −0.6778 0.3818 3.1222 0.8405 1.2954 287 114 −0.2924 0.8063 1.9083 3.1927 1.3894 2.3371 289 114 0.3222 1.2447 2.3606 4.1463 1.8832 3.2366 291 114 1.9705 3.3823 5.1876 2.2958 4.9979 291 116 −1.5850 −0.8377 −1.0636 −0.6566 −3.0753 0.6363 293 116 −1.1549 −0.4481 −0.2928 −0.1759 −2.1325 1.2085 295 118 −0.1675 −1.7111 −2.3503 −2.2362 −2.9102 −0.4436 267 107 1.3424 1.3920 2.3185 3.8407 2.7752 0.0335 269 107 3.5596 3.9890 4.9322 3.2414 0.8114 271 107 0.2222 1.7274 2.8833 3.2121 1.2822 271 109 −0.0946 0.5230 1.3595 0.4446 −1.2262 273 109 −3.1088 −0.8499 0.3244 0.7714 −0.6580 275 109 −1.5086 −1.4891 −0.8299 −0.6856 1.0251 −0.1097 277 109 −0.3207 0.5852 0.2643 1.2018 0.7281 279 111 −0.7696 −1.5661 −1.4275 −1.9151 −0.9333 −1.4368 281 111 2.1648 0.5127 0.8683 2.5834 4.7339 0.7403 283 111 1.6086 3.1470 4.7474 0.3682 3.5424 279 113 −3.3594 −4.3395 −3.8980 0.8057 −2.9949 281 113 −1.5979 −2.5209 −1.2381 0.7137 −2.6460 283 113 −0.8539 −0.3812 −0.3147 2.5972 6.6919 −0.0498 285 113 0.6628 0.9413 1.4239 3.6872 1.8626 2.1744 287 113 2.3858 2.8949 4.4630 2.5884 3.4723 287 115 −1.2218 0.2158 1.0875 −4.0421 0.8652 289 115 −0.3872 0.7644 0.7669 1.4003 −3.0994 1.5415 291 115 0.6461 0.9994 2.3222 −2.1555 2.6052 293 117 −1.6021 −1.6441 −2.0396 −1.4658 −2.9758 0.2322 268 107 2.8578 3.2398 4.4050 2.9598 0.3997 270 107 2.3579 1.6387 2.9934 4.5878 3.3850 1.2087 272 107 1.0531 1.2425 1.9570 2.2745 3.7146 2.0226 272 109 −1.3962 0.1623 1.4835 0.9691 −0.5563 274 109 −1.5835 −0.6992 −0.0690 1.2581 0.0651 276 109 −0.1549 −0.5155 0.3046 0.2320 1.4631 0.6707 278 109 0.7782 0.6384 1.3282 2.1319 7.0820 1.3559 280 109 1.8950 3.7765 6.5020 2.4097 3.9677 282 109 −1.0000 6.7376 8.4851 3.7226 6.5040 276 111 −2.9333 −3.2062 −3.2868 −0.8513 −1.3953 278 111 −2.0969 −1.2334 −2.1979 −2.7220 −0.6644 −0.9623 280 111 0.6335 0.6725 −0.0036 0.4767 3.9036 −0.3641 282 111 2.1139 2.0946 2.5922 4.3775 0.1325 2.7752 284 111 3.6910 4.6629 5.6215 1.3015 5.7912 286 111 1.0000 5.5703 6.8245 2.4572 6.5413 280 113 −2.4996 −3.3176 −2.6973 1.1593 −2.3916 282 113 −0.8539 −1.2978 −1.2468 1.1099 6.0008 −1.2248 284 113 −0.0132 −0.2838 0.7654 3.5324 1.8742 1.6284 286 113 1.0792 1.7789 2.7992 4.5533 2.6541 3.5013 288 113 2.6155 3.2479 4.9915 3.3144 4.0637 290 113 0.9031 3.7270 5.5409 3.8462 5.7562 288 115 −0.7520 0.8855 1.6860 −3.2236 1.6512 290 115 −0.0757 0.7825 1.1555 1.9115 −2.2890 2.4377 292 115 1.9733 2.0576 3.1115 −1.3562 3.6144 294 117 −1.1549 −0.8999 −1.0697 −0.7599 −2.1668 0.9242 Table 2. Comparison between the experimental α-decay half-lives and the calculated values under the DDCM using AME2020, WS4, FRDM, DZ10, and KTUY nuclear masses.
-
Within the density-dependent cluster model (DDCM), we systematically study the effects of nuclear masses on α-decay properties of superheavy nuclei for different mass models, namely WS4, FRDM, DZ10, and KTUY. The experimental masses given in AME2020 are used for benchmark calculation. The consistency of α-decay energies between different nuclear mass models and the experimental data are checked at first for all the known superheavy parent nuclei from
$ ^{228}{ \rm{Th}} $ to$ ^{295}{ \rm{Og}} $ . It is found that the WS4 and FRDM results achieve smaller errors, while the DZ10 model displays a relatively large discrepancy.Under the framework of cluster formation model (CFM) with two types of formulas to include the odd-nucleon effect, the α-cluster preformation factors for the superheavy parent nuclei are calculated with the experimental masses and the theoretical masses from different mass models. With the deduced experimental decay energies, the corresponding preformation factors are also extracted from the experimental decay half-lives. The correlations among the CFM calculations and the half-life extractions are systematically studied by calculating the corresponding Pearson correlation coefficients. The results of the Pearson coefficients indicate that the CFM preformation factors are consistent with each other very well among different mass models. The extracted preformation factors also agree with each other but with less correlations among them. This is because of the exponential dependence of the decay half-life on the decay energy. Hence, the small differences in the decay energy from different nuclear masses will result in large discrepancies of the decay half-lives. Besides, though the preformation factors between the CFM calculations and the half-life extractions generally show weak correlations for each mass model, the WS4 data set demonstrates remarkably close correlations between them. In addition, the two types of CFM formulas lead to very similar correlations for all data sets, indicating the consistent inclusion of the odd-nucleon effect on the α-cluster preformation factor within the CFM.
Under the DDCM, the decay half-lives of possible α-decay chains with even-even, even-odd, odd-even, and odd-odd superheavy nuclei are calculated. Similar tendency for all the possible decay chains are obtained that with the decreasing mass and proton numbers, the theoretical decay energies decrease and the corresponding decay half-lives increase. In detail, for the superheavy parent nuclei with experimental data available, both the deduced experimental decay energies and half-lives can be reproduced well. Besides, the decay energies and half-lives for the unknown superheavy isotopes with small mass and proton numbers can be predicted with smaller uncertainty, generally with one order of magnitude differences for the half-lives. However, there are larger discrepancies for the decay energies and half-lives for the unknown superheavy elements with large mass and proton numbers. Besides, it is found that the theoretical decay energies
$ Q_{\alpha} $ for superheavy isotopes will decrease with the increasing neutron number, leading to the increasing predicted decay half-lives. Hence, the superheavy nuclei tend to become more stable with more neutrons compared with the present available isotopes and the island of superheavy nuclei could be searched by synthesizing the superheavy isotopes with more neutrons. -
Within the DDCM, we systematically study the effects of nuclear masses on α-decay properties of superheavy nuclei for different mass models, namely, WS4, FRDM, DZ10, and KTUY. The experimental masses given in AME2020 are used for benchmark calculation. The consistency of α-decay energies between different nuclear mass models and the experimental data are firstly checked for all the known superheavy parent nuclei from
$ ^{228}{ \rm{Th}} $ to$ ^{295}{ \rm{Og}} $ . The WS4 and FRDM results achieve smaller errors, while the DZ10 model displays a relatively large discrepancy.Under the framework of CFM with two types of formulas to include the odd-nucleon effect, the α-cluster preformation factors for the superheavy parent nuclei are calculated using the experimental masses and the theoretical masses from different mass models. With the deduced experimental decay energies, the corresponding preformation factors are also extracted from the experimental decay half-lives. The correlations among the CFM calculations and the half-life extractions are systematically studied by calculating the corresponding Pearson correlation coefficients. The results of the Pearson coefficients indicate that the CFM preformation factors are consistent with each other among different mass models. The extracted preformation factors are also in good agreement with each other but with less correlations among them. This result is attributed to the exponential dependence of the decay half-life on the decay energy. Hence, the small differences in the decay energy from different nuclear masses can result in large discrepancies of the decay half-lives. Additionally, though the preformation factors between the CFM calculations and the half-life extractions generally show weak correlations for each mass model, the WS4 data set demonstrates remarkably close correlations between them. In addition, the two types of CFM formulas lead to very similar correlations for all data sets, which indicates the consistent inclusion of the odd-nucleon effect on the α-cluster preformation factor within the CFM.
Under the DDCM, the decay half-lives of possible α-decay chains with even-even, even-odd, odd-even, and odd-odd superheavy nuclei are calculated. Similar tendency for all the possible decay chains are obtained which shows a decrease in the theoretical decay energies and an increase in the corresponding decay half-lives with decreasing mass and proton numbers. Specifically, for the superheavy parent nuclei with experimental data available, both the deduced experimental decay energies and half-lives can be reproduced well. Additionally, the decay energies and half-lives for the unknown superheavy isotopes with small mass and proton numbers can be predicted with smaller uncertainty, generally with one order of magnitude differences for the half-lives. However, there are larger discrepancies for the decay energies and half-lives for the unknown superheavy elements with large mass and proton numbers. Additionally, we determine that the theoretical decay energies
$ Q_{\alpha} $ for superheavy isotopes will decrease with the increasing neutron number, thus leading to the increasing predicted decay half-lives. Hence, the superheavy nuclei tend to become more stable with more neutrons compared with the present available isotopes and the island of superheavy nuclei could be searched by synthesizing the superheavy isotopes with more neutrons.
Effects of nuclear masses from different mass models on the α-decay properties of superheavy nuclei
- Received Date: 2025-11-11
- Available Online: 2026-04-15
Abstract: Using four representative nuclear mass models, namely, WS4, FRDM, DZ10, and KTUY, we perform a systematic investigation on how nuclear masses affect the α-decay properties of superheavy nuclei, including decay energies, α-cluster preformation factors, and corresponding half-lives. The α-cluster preformation factors are obtained from two types of cluster-formation model (CFM) and extracted from experimental decay half-life. All mass models reproduce the known α-decay energies with small root-mean-square errors, while WS4 and FRDM show the highest accuracy. Strong correlations among preformation factors from different mass models are identified in both CFM and extracted results, although the exponential dependence of half-lives on decay energy weakens correlations between the two approaches. For possible α-decay chains of superheavy nuclei, the decay energy systematically decreases and the predicted half-life increases with decreasing proton number. This trend is also observed from the calculations for superheavy isotopes with same proton number. These results indicate that isotopes of superheavy elements with more neutrons are expected to exhibit enhanced stability, thus providing theoretical reference for future synthesis of elements with Z=119 and 120.


 DownLoad: